Understanding Re-finding behavior in Naturalistic Email Interaction Logs David Elsweiler
Morgan Harvey
Martin Hacker
Department of Computer Science (8 AI), University of Erlangen, Germany
Department of Computer and Information Sciences, University of Strathclyde, Scotland
Department of Computer Science (8 AI), University of Erlangen, Germany
[email protected]
[email protected]
ABSTRACT In this paper we present a longitudinal, naturalistic study of email behavior (n=47) and describe our efforts at isolating re-finding behavior in the logs through various qualitative and quantitative analyses. The presented work underlines the methodological challenges faced with this kind of research, but demonstrates that it is possible to isolate refinding behavior from email interaction logs with reasonable accuracy. Using the approaches developed we uncover interesting aspects of email re-finding behavior that have so far been impossible to study, such as how various features of email-clients are used in re-finding and the difficulties people encounter when using these. We explain how our findings could influence the design of email-clients and outline our thoughts on how future, more in depth analyses, can build on the work presented here to achieve a fuller understanding of email behavior and the support that people need.
Categories and Subject Descriptors H3.3 [Information Search and Retrieval]:
General Terms Measurement,Management,Experimentation, Human Factors
Keywords Personal Information Management, Re-finding, Naturalistic User Evaluation, Query Log Analysis
1. INTRODUCTION There is an increasing body of evidence showing that people regularly require to re-find and re-use information they create, acquire or receive [9, 23, 25]. The tools used to do this, however, such as web-browsers, email-clients, search engines etc., are often not designed with re-finding in mind and, as a result, re-finding is frequently difficult, time-consuming
Permission to make digital or hard copies of all or part of this work for personal or classroom use is granted without fee provided that copies are not made or distributed for profit or commercial advantage and that copies bear this notice and the full citation on the first page. To copy otherwise, to republish, to post on servers or to redistribute to lists, requires prior specific permission and/or a fee. SIGIR’11, July 24–28, 2011, Beijing, China. Copyright 2011 ACM 978-1-4503-0757-4/11/07 ...$10.00.
[email protected]
and frustrating [1, 5, 24]. Designing better tools or improving the tools that we already have requires knowledge of what people need, how they behave and the reasons for their behavior. Currently our knowledge about these aspects is very limited and most of what we do know comes from studies of re-finding either files or web pages. Despite evidence showing that email is the information type re-found most often [9] and for many users the hub of their information space [27], there have been no naturalistic investigations of how people interact with email-clients to refind, how and when the strategies change and how these behaviors may be supported. Naturalistic investigations of web page re-finding, e.g. [23, 25], on the other hand, have provided key insights into the behavior people employ when refinding. These include discovering that different types of refinding occur within and across sessions and that strategies converge for regularly accessed items. Similar approaches for email would allow researchers to discover if these behaviors transfer or if the varied uses of email and many differences in form and function between web pages and email messages mean that people behave differently and need alternative re-finding support. One of the principal reasons that naturalistic approaches have not been used to analyze email behavior is that emailclients are not like search engines. They are used for several purposes and many user interactions will have nothing at all to do with re-finding i.e. checking, reading, sending, organizing mails. This leads to a large amount of noise in the logs and difficulties in drawing conclusions about re-finding behavior. In this paper, we present a naturalistic study of email behavior and describe our efforts at isolating refinding behavior in the logs through various qualitative and quantitative analyses. The presented work underlines the methodological challenges faced with this kind of research, but shows that by using a specific logistic regression model developed as part of this work, that it is possible to isolate re-finding behavior from email-client interaction logs with reasonable accuracy. By demonstrating that re-finding interactions can be successfully and reliably isolated within logdata, we make it possible to study email re-finding behavior in the same way that web page re-finding can currently be studied with Search Engine (SE) logs. Using the approaches developed we uncover interesting aspects of email re-finding behavior that have so far been impossible to study. We also outline our thoughts on how future, more in depth analyses can build on the work presented here to achieve a fuller un-
derstanding of email behavior and the support that people need. The paper is structured as follows: Section 3 describes the main study methodology; Section 4 outlines additional experiments used to create an annotated dataset for training and testing models for isolating re-finding behavior. Section 5 details the modeling work and model performance. Sections 6 and 7 use the modeling work as a means to analyze re-finding behavior and discuss the main findings with respect to previous work. Finally, we conclude in Section 8 by summarizing the main contributions and outlining our plans for extending the work in the future. First, to motivate the work and provide a platform to discuss our findings, we summarize appropriate related work.
2. BACKGROUND LITERATURE Personal Information Management (PIM) is the research domain interested in learning about and supporting the behavior people exhibit to acquire, store, organize and re-find information [15]. Re-accessing information has been shown to be an activity people undertake regularly. For example, 60-80% of web-page visits are re-accesses [18] and approx. 40% of web searches are performed with the aim of re-finding something seen before [23, 25]. Similar access patterns have been observed for many other information types, including Unix commands, borrowed library books, and human recollections [9]. Analyses of desktop-search tools show that email is the type of media people re-find most often [9]. Email has historically been an important topic within PIM, with numerous studies investigating the different uses of email (e.g. for collaborative working [8], management of contacts [28], tasks [29], and documents [29, 2]) and how collections are organized to account for these uses [29]. To date there has been limited focus on the methods people employ to re-find email messages and the studies which have been performed have been laboratory-based and have focused on behavior with novel tools [21] or specific aspects relating to behavior (e.g. user recollections [10]). The lack of research on email re-finding contrasts that of files and web pages, from which we know about preferences for browse over search in different scenarios [3, 4]; particular seeking tactics [24, 6]; that re-finding tends to be performed in bursts [25]; that strategies are honed over time for regularly refound objects [25] and that different behavior is exhibited for within and between session searches [25]. We believe that complementing this work with research on email re-finding behavior is important given the differences between email messages and other types of information objects in terms of the way they are acquired and used, as well as the frequency with which people have been shown to re-find information within their email collections. There are several unanswered research questions that could be answered by a naturalistic examination of email behavior. • How often do people re-find and how much time do they spend doing this? • What strategies do people use to re-find and how do strategies change for in different situations? Do different people use different strategies or are relatively homogeneous approaches applied? Do individual users employ different strategies to re-find the same messages? Do email re-finding strategies converge over time as [25] found with web-page re-finding? • Are there indicators of people having difficulty when
re-finding and can we learn what these difficulties are and how to resolve them? • Are there patterns in the emails that people tend to refind and can these be used to predict which messages may need to be re-found in the future? Answering such questions could potentially have a huge impact on the way we design email-clients. A prerequisite to answering these and similar questions, however, is the ability to isolate the interactions associated with re-finding behavior within naturalistic log files. In the following sections we outline our efforts at achieving this and evaluate the performance of our methods.
3.
NATURALISTIC STUDY
We performed a naturalistic investigation by developing an extension for the popular, open-source email-client Mozilla Thunderbird1 , which captured user interactions with the client during the course of normal usage. We recorded interactions such as opening folders, selecting messages, sort operations, changing views (e.g. to show only unread messages), submitting queries etc.. The query strings and information about the results were also recorded. Further, events such as opening and closing Thunderbird’s specialist search facilities, as well as queries submitted to these facilities and actions performed with the found messages were recorded. For privacy reasons no data relating to message content was stored but message senders and subjects were given an identifier and particular message properties (timestamp information, read before flag, message size etc.) were noted. By utilizing Mozilla mailing lists and user fora we were able to recruit a diverse study population. 47 participants (37 male, 10 female, aged 21-49), from 7 countries volunteered to take part over a period of 4 months. The population included people with a broad range of occupations from a film-festival organizer, a lab-technician and software engineers to teachers, lawyers and consultants, although academics and students were particularly well represented. The academic participants had backgrounds stretching across the sciences and humanities. Analyzing the log data revealed large differences in email usage. For example, some participants interacted with their email-clients regularly throughout the day, while others checked email less often. Some collections were well established (up to 15 years old) and had several hundred thousand messages and other collections were only a few months old and contained less than 100 messages (median 3,892). As our study was longitudinal in nature, it provides the possibility to determine how email usage in such new collections developed over time. The collected log files consisted of 205,742 interactions. The vast majority of interactions ( ˜ 80%) were message selects, ˜ 14% were folder opened, ˜ 2% were keyword search queries and ˜ 1% were sort operations. The advanced searching features were rarely used, only being opened 83 times and with 139 queries being submitted. Only 14 out of the 47 participants made use of these facilities. Despite relatively few search operations being performed, breaking the select-message interactions down reveals considerable re-accessing behavior. ˜ 55% of the messages that were selected had been previously read and as Table 1 shows, many of re-accessed messages were quite old with ˜ 7% of 1
See http://www.mozilla.org. We used version 2.3
the re-accessed messages being received over a year previously. The oldest message accessed was 6.65 years old. These statistics are similar to those for other types of information as noted in Section 2. Message Originally Received Over 1 year previously Over 180 days previously Over 90 days previously Over 60 days previously Over 30 days previously Over 1 week previously Over 1 day previously Over 1 hour previously
Count 6936 2627 2793 2097 3398 9859 16984 32777
Percentage ˜ 7% 2% 3% 2% 3% 10% 18% 36%
Table 1: Re-accessed Messages Over Time Although generating statistics about the frequency of interactions can provide an interesting overview of re-accessing behavior and suggests that the participants have been refinding, to learn about user strategies in greater detail requires the isolation of re-finding interactions. What we need is to establish chains (sequences) of interactions representing only re-finding behavior and relating to a single task. This would allow us to perform analyses similar to those performed with search engine logs. The following sections outline our efforts at achieving this.
4. FURTHER DATA COLLECTION 4.1 Manual Analyses As a first step in the process, we analyzed a subset of the logs manually to determine if features existed in the logs that may indicate that a re-finding task was being performed. We divided the dataset into interaction chains by looking for hard and soft boundaries. A hard boundary was defined as a new start of the email client and following previous work [22, 7], a soft boundary was defined as a gap greater than 5 minutes between interactions. We randomly chose ˜ 1% of the dataset (250 chains) and also took the chains before and after these for manual analysis. These ˜ 750 chains were color-coded and printed, with each interaction being represented by one line of text including important meta-data and each interaction type having a unique color. A manual analysis of these chains by three researchers (separately marking each chain positively or negatively depending on whether they believed it to contain re-finding behavior or neutral if they were unsure) revealed high overlap across researchers. The researchers achieved a very high agreement (96%), with 21% being marked positive and 8% neutral. As a result of this process several chain features were identified that the researchers believed helped indicate whether or not a re-finding task was present in the chain. These are shown in Table 2. As the features used to manually determine re-finding behavior were relatively straightforward and experimenters achieved a high-level of agreement, we attempted to recreate our coding behavior automatically with a heuristic-based algorithm. By utilizing the indicators listed in Table 2, we were able to calculate an overall score for each chain. We applied weights to the features as they occurred in the logs and normalized the score by the number of interactions. At this stage the weights (see Table 2) were derived from our impression of their importance in our own personal classification process and adjusted by trial and error to achieve
Indicator Quicksearch Query submitted Advanced search facilities opened Query to advanced search submitted Particularly old, previously read message access Messages in folder sorted Folder opened New message access Message re-access shortly after accessing Short-duration chains
Sign + + + + + + -
Weight 20 30 30 20 8 0 10 0 NI
Table 2: Indicators of Re-finding behavior (NI = not implemented in algorithm)
best results against our judgements. To account for situations where the user returned to read emails more thoroughly shortly after they had been originally received, we assigned a neutral weight to selected messages that had been accessed recently (in the previous 48 hours). We chose this value because although it is certainly feasible that people may have to re-find something they have accessed or read less than two days previously, in particular people who receive large amounts of mail, it is possible that the message could be clicked on without involving any re-finding behavior, which would lead to the detection of many chains that do not contain tasks. Given the frequency with which we observed this behavior in the logs without any other hints of re-finding behavior in the chains, we felt it better to make a trade off in terms of small loss of recall in favor of a large benefit in precision. After some experimentation we settled on an overall threshold score of 1.8, i.e, if a chain had a score of 1.8 or higher based on the weights in Table 2, the algorithm classified the chain as containing re-finding behavior.
4.2
Creating an Annotated Dataset
To evaluate the performance of the algorithm we performed a small additional user study to create an annotated dataset. In a second step we used what we learned from this study to create a fuller dataset more suitable for training models by performing a second critical incident study where the participants confirmed or rejected chains classified by a version of our algorithm optimized for recall. The following subsections outline this work in detail.
4.2.1
Critical Incident Study 1: Manual Logging
We performed a critical-incident study where 5 of the original participants repeated their participation, but used a modified version of the extension that allowed them to indicate when re-finding tasks started and ended. The only difference between this version and the original, which used the standard Thunderbird interface, was a button located in the top-right corner of the window that the participants were to click before they started and after they completed re-finding tasks. To help remind the participants that they should log their tasks, a pop-up message appeared every time the email client window was refocused. Upon marking a task as complete, a pop-up electronic form queried the participant regarding some simple information about the task (what they were looking for, if they were successful, how difficult the task was and how often they need to re-find this information). We collected data for approximately 2 weeks. The outcome of this additional experiment was a dataset of naturalistic logs – as in the original study – but this dataset was
annotated with interactions we knew to be associated with re-finding tasks. We refer to this as dataset 1 (DS1). Running the heuristic algorithm on DS1 achieved relatively high recall (0.77), although precision was lower (0.62). The algorithm marked 11.5% of the interaction chains as re-finding tasks, which was slightly higher than the percentage annotated by the participants themselves. To optimize performance we wanted to train a model using a machine learning approach. There were, however, a number of problems with our annotated dataset that made it unsuitable for this purpose. First, the population was small and relatively homogeneous. Second, one user was dominant in the logs, which was fine for testing the performance of the heuristic model, but not for training a new model. Third, we had concerns about the use of the log button approach. It is possible that despite giving frequent reminders that participants may have forgotten to log re-finding tasks. To deal with these issues and provide a dataset suitable for training and testing an improved model, we designed and performed a second critical-incident study, which exploited what we had learned so far and the heuristic algorithm we had tested on the first dataset.
4.2.2
Critical Incident Study 2: Automatic Detection
We integrated a version of our algorithm into the Thunderbird extension, allowing re-finding behavior to be detected live as the user interacted with their messages and providing the opportunity to question the participants on their behavior when the algorithm estimated a re-finding task to have taken place. We chose a version of our algorithm with high recall by weighting all re-accessed messages equally, regardless if they had been recently accessed. This naturally meant sacrificing precision. On DS1 this algorithm achieved a recall of 0.93 and precision of 0.18. Another change we had to make for this study was respect to soft chain boundaries. In a live re-finding setting, a gap of 5 minutes would have been impractical as we needed to detect re-finding tasks as close as possible to them happening in order to avoid the forgetting problems we believe may have occurred during the manual-logging study. Consequently, the algorithm was run on chains that preceded gaps in interactions lasting 40 seconds or longer (which after piloting we found to be an appropriate time gap) or preceding the user switching the focus to another window. When a refinding task was detected, the participant was asked whether or not they had been attempting to re-find. If the response was positive we questioned them on the task they were trying to perform. If the response was negative, we asked about the participants’ activities, i.e. what was the behavior which the algorithm had detected as re-finding. 9 participants, only one of whom did not take part in the initial study, responded to the algorithm’s prompts for a period of between 7 and 14 days during normal email usage. This approach allowed 118 re-finding chains to be detected and confirmed by the participants. We refer to this as dataset 2 (DS2). To achieve the largest possible dataset for training and testing models, we combined DS1 and DS2 (removing the interactions from the dominant participant in DS1). Although there will be some noise in the collection (e.g. we suspect some missing (forgotten to be recorded) tasks in the first dataset and there was a possibility that a 40 sec interaction gap may have meant missing interactions from tasks in the second collection), attaining a perfect set is
almost impossible for this problem and the combined dataset provides a solid basis from which to train and test models. The combined dataset (DS3) was generated from relatively heterogeneous sample of the original population and is of sufficient size for a problem of this nature. Using a softboundary of 5 minutes the dataset consists of 1,124 chains, 162 of which contain re-finding. Also, from the questionnaire responses in the critical incident studies, we know the dataset contains a broad range of re-finding tasks, task difficulties, familiarity with tasks and time-lapses between accessing and re-accessing the sought-after message.
5. 5.1
MODELLING WORK Model Selection
Our problem can be defined as one of identifying whether a chain contains or does not contain a re-finding task. Our evidence to base this decision on is a set of numerical features. We decided that it would be advantageous to focus the model on achieving high precision scores so as to gain the most accurate understanding of re-finding behavior possible. While there are a large number of classification models available, due to the binary nature of the class and our requirement for high precision, the most natural choice is a logistic regression model. In such a model the class of the dependent variable yi (in this case, whether a chain contains or does not contain a re-finding behavior) is assumed to be drawn independently from a Bernoulli distribution. The probability of “success” of each Bernoulli trial is assumed to be related to the explanatory variables. This model is a special case of the class of models known as generalized linear models as the explanatory variables are each multiplied by their own coefficient and then combined linearly. If there are n features in the data then we typically have a coefficient vector θ of size n + 1 in order to allow for an intercept in the linear equation. This also requires that the feature vector be augmented by adding a value of 1 in the first position. Given our vector of coefficients and a new data point xi we calculate the output of the linear model as follows: n+1 X yˆi = θj × xij = θT xi (1) j=1
In the case of logistic regression we wish to bound the output of the linear model to be between 0 and 1 (i.e. to ensure the output is a valid probability). To achieve this we apply the logistic function to the output from the linear equation above: 1 P (y i = 1|xi ; θ) = (2) ˆ 1 + e− y i The values of the coefficients in the vector θ are trained by maximizing the log likelihood over the training set using iteratively re-weighted least squares (IRLS) [17]. This algorithm will return a close approximation to the best coefficient values in order to minimize the classification error given the observed data. However due to the relative sparsity and high-dimensionality of the data and the potential for collinearity between the explanatory variables this model is prone to over-fitting. In order to prevent such over-fitting we can add regularization terms to the end of the linear model. These regularization terms are added to penalize large parameter values and “shrink” the estimates of these
coefficients towards zero, relative to the maximum likelihood estimate. It has been shown by experiment that L1 regularization works well for such models [19]. In L1 regularization (also known as “Lasso” regularization) the penalty term encourages the sum of the absolute values of the coefficients to be small. As mentioned earlier, we can fit the parameters of the model by maximizing the log likelihood of the data: m X argmaxθ logP (y i = 1|xi ; θ) − αR(θ) (3) i=1
In the above optimization problem we have added a function R(θ) which is the regularization term and a constant α which can be varied and allows us to control how much regularization to apply. Note that if either R(θ) or α are 0 then the models decompose back to the un-regularized version. In L1 regularization the term function R(θ) is simply: P n+1 j=1 |θj |. To optimize the value of α we train a model over a range of values and then test each model on held-out testing data over a number of folds (cross-validation). To choose the optimal value of α we simply choose the value which maximizes an objective function, in this case the log likelihood of the heldout data.
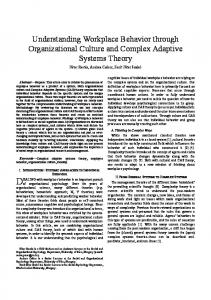
5.2 Feature selection and model parameters The manual analyses above form the basis for the model feature selection. In addition to the set of features listed in Table 2 we also examined a number of features that were impossible to detect accurately by a human assessor (e.g., the maximum time gap between interactions in the chain, the average age of messages and the number of unique messages). While L1 regularization has the proven ability to automatically select relevant features it is still sensible to first perform some manual exploratory data analysis to identify useful features. By comparing each feature individually in the training data over the 2 classes we can gain an understanding of which will be useful as predictors in the model. In particular, if the feature values are significantly different when conditioned on each of the 2 class labels then it is likely that they will be useful indicators. We can then rely on the regularization to deal with issues of over-fitting and collinearity. This analysis can be performed by either visually comparing plots as shown in Figure 1 or by using an appropriate statistical test. For example, the MaxInteractionGap feature shown in the figure visually appears longer on average for re-finding tasks and this observation is confirmed by a highly significant Wilcoxon signed-rank test (p ≪ 0.01) Using this methodology we created a series of competing models and tested their performance over the datasets obtained from the critical incident studies. The results from this are presented in Table 3. Since we are most interested in the accuracy of our predictions rather than coverage we chose F0.5 as the metric on which to determine the utility of each model. The F0.5 score is the harmonic mean of the precision and recall where the precision is given twice the relative weight of the recall. The results show that model 3 returns consistently the best score over the labelled datasets and we therefore use that for the analysis of our larger dataset. It turns out in evaluating these models that the more parsimonious models perform better overall. This is preferable
Figure 1: Boxplots of Max Interaction Gap conditioned on whether it is a re-finding chain. Note that in this case we have taken the log of the interaction gap in order to make the plot clearer. Model fitted 1 fitted 2 fitted 3 heuristic
Table 3: mance
F0.5 DS1 0.7849 0.7452 0.8615 0.6451
F0.5 DS2 0.6605 0.6801 0.6803 0.6582
F0.5 DS3 0.6469 0.6467 0.7200 0.5993
P DS3 0.72 0.74 0.9 0.61
R DS3 0.46 0.43 0.4 0.56
Fitted logistic regression model perfor-
as they are also less likely to be over-fit when compared to models that make use of more factors and are on the whole more generalizable. Fitted model 3 uses the number of old messages which have not recently been reaccessed (noOld), the number of times search facilities were used (search), the maximum gap between interactions (maxGap) and the length of the chain (length) as indicators of re-finding behavior as follows: P (y|x; θ) = logit(1.689 + 0.365noOld + 1.763search +2.44 × 10⁻⁵ maxGap − 3.18 × 10⁻³ length) It is interesting to note that the model fitting process has utilized features in a similar way to the earlier heuristic approach. This suggests that many of the assumptions made in that algorithm based on manual analysis of logs were correct. Full details of all models will be published in a technical report.
5.3
Scope and limitations of these analyses
Although our best model (fitted 3) is only able to detect approximately 40% of re-finding tasks, we argue that, from the perspective of our research aims, the tasks that the model is able to detect are those most important and interesting to analyze. Wilcoxon SR tests on the training data show that the tasks missed by the model were significantly shorter than those detected both in terms of number of interactions (median = 3 , IQR = 6 vs 10, IQR = 12, p ≪ 0.01) and in terms of time (median time in mins= 0.37, IQR 3.05 vs 3.31, IQR 7.75, p ≪ 0.01). These tasks also contained far fewer non-recently accessed messages that were received more than two days previously (median = 0, IQR 1 vs median = 2, IQR 3, p ≪ 0.01). All of this evidence combines to suggest that the tasks our model misses are those which are fairly straightforward to complete and less interesting to study in terms of learning about the problems people have and the behavior people employ to resolve these problems. It is also worth noting that all models showed better per-
formance on dataset 1 (DS1). We believe that the tasks that were difficult to detect in DS2 would have been less likely to cue the participant to log the task for DS1. In the creation of DS2 the participants were provided with an active cue i.e. they were directly asked if they were re-finding something, explaining the presence of such tasks in the collection and accounting for the lower precision scores for DS2. We must acknowledge that it is possible that multiple refinding tasks could be present within a single detected chain and / or re-finding tasks could cross chains. Analyzing the manually annotated logs in dataset 1 shows that this happened in 6% and 12% of chains respectively. Additionally, we also need to concede that there will be interactions in some chains not to do with re-finding. Analyzing DS1 where the annotations will be most accurate, shows that there is a median of 3.5 (IQR=4.75) non-re-finding interactions (that occur before and / or after re-finding) for chains correctly identified as containing re-finding behavior. Both of these points should be taken into account when reading the analyses in the following section. In the remainder of this paper we analyze the chains classified as re-finding using fitted model 3 on the full unannotated dataset. We refer to such chains as re-finding chains. We start by looking at general characteristics of re-finding behavior, looking at how prevalent re-finding is and what the associated behavior looks like. We then look at how specific features of the email client were used during re-finding, providing a better understanding of how people re-find, as well as the problems encountered during re-finding. Finally, we examine the distribution of re-finding over time to establish how often the same messages are re-found and present some initial analyses regarding how the frequency of re-access and the time between accessing and re-accessing influence behavior.
6. ANALYSING RE-FINDING BEHAVIOR 6.1 Overview of Re-finding Although previous studies of re-finding behavior have shown re-finding to be prevalent (e.g. approx. 40% of search engine queries are re-finding queries [23] and on average 4.4 queries per day are submitted to desktop search engines [9]), the metrics used in these studies are inappropriate to gauge the frequency of re-finding in the context of email use. Instead we look at more useful metrics for our purpose – the percentage of chains that contain re-finding and how frequently these chains occur with respect to the number of days email was used. According to our best model, 6.08% of interaction chains contain re-finding [95%CI = 5.78-6.39]2 and this increases to 15.2% [95%CI = 14.45-15.96] if we adjust the figure to account for the training data recall score of 0.4. Examining the regularity of tasks across participants showed huge variance. Cluster analysis3 revealed two clear groups of users. The first group (n=33) re-found relatively infrequently (me2 using binomial proportion confidence intervals [95%] assuming a normal approximation 3 We used hierarchical agglomerative clustering using Ward’s method, which looks at cluster analysis as an analysis of variance problem, instead of using distance metrics or measures of association. Analyzing the resulting dendrogram showed many sub-clusters, but in order to keep analyses simple we chose to look at the two main clusters.
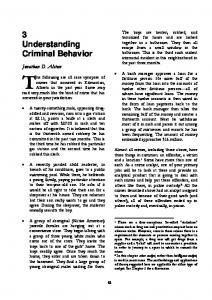
dian = 0.25 tasks per day of email use4 ). The second group (n=14) re-found much more regularly (median = 2.193 tasks per day). The cluster of users who frequently re-found had significantly more mails overall but made use of email on a very similar number of days during the study period as the users in the other cluster. There is very little in the literature regarding how much time people spend re-finding, but to help understand the cost of re-finding on the lives of the participants, we felt it important to look at the lengths of the re-finding chains in minutes.
Figure 2: The distribution of re-finding chain lengths in minutes There was no significant difference between the time taken to complete tasks for the two clusters of users. The distribution of chain lengths was Zipfian for both groups with both distributions exhibiting a long and heavy tail. Figure 2 shows the distribution for all re-finding chains, the median chain length was 4.05 minutes, with the longest chain lasting 71.7 minutes. The number of interactions in the re-finding chains follows a similar pattern. Again, the distribution is Zipfian with the median interaction count being 11 interactions and the longest chain containing 501 interactions. These findings suggest that the majority of re-finding tasks seem to be quite short, mostly taking a few minutes. On occasion, however, our data suggest people can spend much longer looking for emails they need. The Zipfian distribution is extremely important with respect to this work with nearly all of the analyses we perform conforming to this distribution (inverse power law). Both the median age of messages re-finding chains and the number of messages viewed within these chains follow this distribution and both exhibit long and heavy tails. The median age of messages is 14.7 days (max = 2,430) and the median number of messages viewed is 4 (max = 290). All of the statistical analyses in this section indicate that the majority of re-finding tasks are short and straight-forward. Nevertheless, there is evidence that some tasks cause problems. Just how problematic re-finding emails can be is underlined by examining the Message Uncertainty Ratio (MUR) for re-finding chains, i.e. the ratio of unique messages viewed to the total number of messages viewed. Only 34.07% of chains have MUR of 1, i.e. that all of the messages were viewed only once. 13.02% have an MUR greater than or equal to 2. This suggests that people are pretty regularly 4
These figures are recall adjusted
getting lost, viewing on average every message in the chain at least twice in over 13% of re-finding tasks. The maximum MUR is 12, which is incredibly high. As a next step we examine the re-finding chains to establish the approaches taken and the features of the email client people use in order to re-find. First, we examine the use of folders in re-finding before moving to analyze the use of sorting and finally the search queries submitted. The analyses help build up an understanding of the way people use the features of current email clients to re-find and reveals some problems they have.
participants were looking in the same folders multiple times when re-finding, suggesting disorientation.
6.2 The Use of Folders in Re-finding While there is considerable literature on how and why people create folder organizations [16, 29], there has been no work on how people tend to use folders when re-finding content. Our data allows us to investigate this issue. Out of our population, 14 participants described themselves as being no-filers, 16 described themselves as Filers and 17 described themselves as Spring-cleaners. The median number of folders (other than the “default” folders, i.e. inbox, outbox, drafts and trash) was 13 with counts ranging from 0 all the way up to 192. Our data indicate that when the participants had folders, these folders tended to be used regularly during re-finding. 71.07% of re-finding chains for users with folders involved opening a folder other than the inbox. If we look at the proportion of re-finding chains where folders other than the inbox were opened we can see (as would be expected) that people with more folders are more likely to look in folders other than the inbox when re-finding. Figure 3 shows how folder usage increases with the number of folders in the user’s collection. As we expected, there appears to be a strong linear relationship between the number of folders a users has and how many folders they look at when re-finding. This visual relationship is confirmed by the linear model of folder usage given folder count having an adjusted R2 statistic of 0.9162 (F-statistic=318.2, p ≪ 0.05). For users with more than the default folders, the median number of unique folders (other than the inbox) in re-finding chains involving folders is 2 (IQR 2), suggesting that people are quite good at using folders to re-find. Nevertheless, the data show that 38.17% of these chains contained 2 or more unique folders (other than the inbox) indicating that they regularly first look in an incorrect folder before moving to the correct one. In 21.86% of chains they look at 3 or more folders. Again this follows an Zipfian distribution, with the maximum number of unique folders in a chain being 26. 145 (10.7%) chains involved 5 or more unique folders and 36 (2.7%) instances of chains involved 10 or more unique folders. This indicates that there are certainly situations where individuals are very poor at judging which folder to look in and must check many folders before locating the correct one or giving up. Further, when we examine Folder Uncertainty Ratio (FUR), i.e. the number of folders opened with respect to the number of unique folders opened, there is evidence that the participants were occasionally becoming disorientated when looking within their folders to re-find. 29.5% of chains involving folders other than the inbox had an FUR score >1 and 8.67% had an FUR score ≥ 2. The maximum FUR score was 4.67. All of this evidence combines to show that quite often the
Figure 3: Plot of folder usage against number of folders in the collection
6.3
The Use of Sorting in Re-finding
Our data shows surprisingly little use of sorting during refinding tasks. Only 1.4% of the detected re-finding chains contained a sort operation5 . This contrasts with the findings of investigations of desktop search tool usage, which have shown users to like sorting the results of desktop searches [9, 7]. It also contrasts with the findings of Elsweiler and colleagues [12], who performed a laboratory-based study to investigate email re-finding behavior. In their study sorting was a popular means of narrowing the information space to facilitate re-access by browsing. Nevertheless, there was no inline “quick-search” facility available in their interface and as this was the only difference between their interface and ours, this could mean that searching is a preferable means to narrow down the search space. Of the 492 total instances of sorting within re-finding chains, 318 (64.6%) were sorts on the date column and 72 (14.6%) were on the sender column. Again this contrasts with the study in [12] where the sender was the most common attribute to sort on. As we show in the following section this is the most frequently queried on attribute, perhaps indicating that people like to re-find based on the sender of the message, but prefer to use a search query to facilitate this when the option is available.
6.4
Analyzing Submitted Queries
Searching seems to be an extremely popular re-finding tactic. 93.8 % of re-finding chains contained at least one search query. The mean number of queries per re-finding chain was 2.29 (max=21) with the distribution again reflecting the basic Zipfian trend reported above. The queries submitted were extremely short. Most (90.88%) were single words and only 0.8% had a length greater than 5
This finding is not an artifact of the model as the number of sorting interactions in the dataset as a whole was also extremely low
2 terms, with the mean number of terms in the queries being 1.10. The mean character length of all queries was 5.87 and many of the queries were partial words. This is much shorter than reported in the literature with 1.6 words being reported for desktop search [9, 7] and 12.1 characters for webpage re-finding [25]. We found a trend that the length of the query in words increased the later in the re-finding chain they appeared, perhaps indicating that after failing with shorter queries, the queries tended to be reformulated by appending characters or terms. This result aligns with previous work by [25] who found that web re-finding queries tended to get longer later in the session. Table 4 shows the frequency with which queries were submitted to different fields. As would be expected the default option, i.e. to submit queries to both the “subject” or “sender” fields, was the most common option. Like previous work, people’s names were highly prevalent in the queries, although the “to or cc” field was very infrequently chosen. We thought that some fields may be used as a backup strategy after an initial strategy had failed e.g. that the user may start by trying to search using the default “subject” and “sender” option and if this failed try to search on the entire message. Examining the query position in the chain against the field, however, failed to provide any evidence to support this hypothesis. Field subject sender subject or send (default) entire message to or cc
Count 231 585 1677 412 179
Percentage 7.49 18.97 54.38 13.36 5.8
Table 4: Distribution of Query Fields In terms of query performance, over one quarter of all queries (25.17%) failed i.e. returned no hits at all. Contrastingly, many queries returned a large number of hits. Over one third (33.78%) returned over 20 results (median = 7 and the maximum 17110). 8.09% of queries returned a single hit. To examine what these outcomes mean in terms of performance we looked at whether or not they tended to represent the last query submitted in a chain (a possible indicator of satisfaction with the outcome). Of the queries returning 0 hits only 12.85% were the last query in the chain. In other words, the user tended to reformulate the query afterwards. However, only 40.78% of those queries with 1 hit were the last query in the chain, a lower percentage than those returning >1 hits (51.57%). This suggests that returning 1 hit is not a good indicator of query success. The median message click/query ratio was 3 with most chains having a ratio of 1 (32.44%). However, in 15.3% of chains containing queries this ratio was greater than 10, again indicating that there are many instances where refinding is not straightforward and people are resorting to orienteering strategies [24] in order to find their emails. This behavior is different from that for web-page re-finding where the majority of re-finding queries are single click queries [25].
6.5 Re-finding Over Time In line with previous work on web-page re-finding with search engines [25], we looked at how individual messages were re-found over time. We used an equivalent definition of re-finding to that used in this previous work, defining a re-
found message to be any message viewed that has been read before and appears within a chain classified as re-finding. Using this definition we found that only 3.59% of all messages received by participants were later re-found. However, 39.1% of all re-found messages were re-found again within the 4 month study period. Although this may sound reasonably high, it is in fact much lower than the figure reported for web-page re-finding (66.1% for 1 month of data)[25]. The vast majority of emails were only re-found relatively infrequently (85% were re-found less than 6 times (median=2). Nevertheless, this again followed the familiar long and heavy tailed Zipfian distribution, with messages being re-found up to 75 times within the study period. This demonstrates how email messages can stay in regular active use over long time periods. Tyler and Teevan discovered a similar longtailed distribution for re-re-finding web-pages [25]. They also found that re-finding tends to happen in bursts, with most re-finding occurring only a short time after another instance of re-finding. We found similar burstiness in email re-finding behavior. Out of all of the re-found messages that would be later re-re-found 70.09% were re-found again within 24 hours and 87.41% were re-found again within 1 week. Intuitively, our data suggest that the participants became better at re-finding the more often they had to re-find a message. For messages which are frequently re-found the length of chains are significantly shorter. For example if we compare the median length of chains containing emails re-found more than the median number of times (median times re-found = 2) with the length of chains for emails re-found the median number of times or less we can see a large difference (55 against 43). The two distributions of chain lengths are confirmed to be significantly different according to a Wilcoxon SR test (p ≪ 0.01). We found a very similar relationship between the length of chains and the time gap between re-finding and re-finding again. In a similar vain to the previous analysis we use the median gap length as a divider, in this case a gap of 3.4 hours. We found that the mean chain length for emails with a time gap less than the median was significantly shorter than for emails with a gap larger than the median (52 against 57). This finding is backed-up by a highly significant Wilcoxon SR test (p=0.0008) and concurs with evidence from the literature [13, 11].
7.
SUMMARY AND DISCUSSION
7.1
Summary of main findings
Our findings with respect to the re-finding chains can be summarized as follows: • The frequency of re-finding behavior varies greatly We found 2 main clusters of users: 1 cluster tended to refind relatively infrequently (on average once every 4 days) and the other much more regularly (on average more than 2 times per day). • Email re-finding can be very challenging Many re-finding tasks were short and straight-forward, but there was also strong evidence for tasks being difficult and in some cases very difficult. Indicators for this included longer chains, looking at more messages and in more folders, as well as disorientation (MUR and FUR).
• Orienteering was a common email re-finding strategy Orienteering behavior was a common re-finding strategy for our participants. Most queries were very short and often consisted of partial words or names. Further, the number of hits returned by the query was not a good indicator of performance, and there tended to be a large number of message clicks per query submitted. All of this suggests that the preferred method of re-finding was to narrow the search space with a short query and browse for clues that facilitated navigating to the email required. This combination of searching and browsing distinguishes email re-finding behavior from file re-finding where there is strong evidence that people prefer to navigate purely spatially to their information [3, 4] and web page re-finding where although orienteering is a common tactic [24], the evidence shows that people prefer to use search engines rather than use spatial-navigation facilities, such as bookmark organizations [5, 14]. • The same messages tend to re-found time and again When analyzing re-finding over time, we found that many (39%) re-found emails were re-found again, most of which (70%) within a day. There was also evidence that re-finding messages becomes easier with frequency and becomes more difficult the longer the time gap between accessing and reaccessing.
7.2 Design Implications Although our findings suggest that much of email re-finding is straight-forward, there are many occasions when it can be hard. We found evidence for people spending long time periods re-finding, submitting long query chains and getting very lost. It is clear that extra help would be beneficial in such situations. Whilst we have only performed initial, highlevel analyses on the dataset, there are a number of ways the understanding of re-finding developed in this paper can be used to improve the re-finding experience in email clients. • Minimizing Disorientation We discovered that a real problem people seem to have when performing difficult email re-finding tasks is that they become disorientated and look in the same folders multiple times and repeatedly check the same messages. One way email interfaces could provide support in such situations would be to offer a search-trail metaphor. The system could keep a record of folders and messages that have been viewed within a chain and these could be highlighted in some way, perhaps by using color. Another solution could be to provide the user with the option to filter out folders already viewed within a search, i.e remove them from view. Both the highlighting and filtering concepts could be toggled on / off by the user as required. • Supporting Orienteering behavior Our findings suggest that people tend to prefer orienteering strategies when re-finding email messages. There was also evidence that users regularly require to view the content of numerous messages before finding what they need. Perhaps this is an indication that the standard representation of messages, message meta-data in columns, may not be enough for the user to judge the relevance of a message. To
facilitate better message previewing, we may need to provide summary snippets for emails similar to those used by web search engines. The number of clicks per query is much lower for web-page re-finding with search engines and better document representations may be one reason for this. Incorporating landmarks, which are an important part of how people orientate themselves in physical environments, may be another interface feature that could assist orienteering behavior. Our findings endorse the approach taken by Ringel and her colleagues [21] who investigated how temporal landmarks could be incorporated into email re-finding interfaces. Other interface features, similar to those suggested in [20], could allow the user to manually annotate connections between messages to allow them to be identified and used as landmarks. However, given the existing costs of processing email messages and the problems this causes [29], it seems an automatic means of achieving this would be preferable. Our dataset could be used to analyze if certain messages are used as landmarks i.e. if re-accessing particular emails lead to re-accessing others. If this is the case, annotating these messages automatically may assist the user to successfully navigate their collection. • Highlighting Re-found messages We showed that messages that were re-found tended to be refound again, most within short time periods. It may, therefore, be worthwhile highlighting messages that have recently been re-found to make them easier to locate or by providing a means to filter to these messages, given that people are normally able to identify when they last accessed a message [10]. A useful extension of this work would be try and predict more accurately which messages might be likely to be re-found again. We talk about this idea in more detail below.
8.
CONCLUSIONS AND FUTURE WORK
In this paper we have presented a naturalistic study of email re-finding and described our efforts at isolating refinding behavior from the logs. By performing two additional user studies we were able to create an annotated dataset and train and test various models, showing that refinding could be detected with good accuracy. Examining the resulting re-finding chains allowed us to uncover interesting aspects of email re-finding behavior that until now had been been impossible to study. The ability to accurately isolate re-finding behavior from email interaction logs opens up the possibility to learn about many aspects of behavior using datasets such as ours. We are currently applying for ethics permission to release an anonymous version of our dataset to the research community. Below we outline some of our ideas of how our work could be extended. Here we presented some initial high-level analyses that looked at the use of specific email client features (e.g. folders, sorting, searching) in isolation. It would be useful to investigate behavior at chain level to determine how different features are used in combination and to determine how strategies evolve over time. For example, do users converge on an optimal approach to re-finding when a particular message is regularly re-found? This could be analyzed in a number of ways, e.g. by employing search trails [26] or modeling behavior as a probabilistic model [12].
The logs could also be used to better understand when and why re-finding tasks are difficult. This could be achieved by looking for relationships between context and user variables and the indicators that we uncovered for task difficulty (chain length, message and folder uncertainty etc.). This kind of analysis on naturalistic data would complement similar analyses that have been performed on lab-study data [6, 11]. We mentioned above the potential benefit of being able to predict which messages are likely to be re-found in the future. In this paper we identified two factors which may influence the probability of a message needing to be re-found in the future – whether or not the message had been refound before and the time that had elapsed since re-finding. We are currently building on these findings to learn if other message or user properties can help predict if and when a message may be needed again in the future.
Acknowledgments The first author was supported by the Alexander von Humboldt Foundation, Germany.
9. REFERENCES
[1] A. Aula, N. Jhaveri, and M. K¨ aki. Information search and reaccess strategies of experienced web users. In Proc. 14th ˇ Conf. World Wide Web, pages 583–592. ACM Press, IntSl 2005. [2] O. B¨ alter. Keystroke level analysis of email message organization. In Proc. SIGCHI conference on Human factors in computing systems, pages 105–112, 2000. [3] D. K. Barreau and B. Nardi. Finding and reminding: File organization from the desktop. ACM SIGCHI Bulletin, 27(3):39–43, 1995. [4] O. Bergman, R. Beyth-Marom, R. Nachmias, N. Gradovitch, and S. Whittaker. Improved search engines and navigation preference in personal information management. ACM Trans. Inf. Syst., 26(4):1–24, 2008. [5] R. Boardman and M. A. Sasse. ”stuff goes into the computer and doesn’t come out”: a cross-tool study of personal information management. In CHI ’04: Proc. SIGCHI, pages 583–590, 2004. [6] R. G. Capra and M. A. Perez-Quinones. Using web search engines to find and refind information. Computer, 38(10):36–42, 2005. [7] E. Cutrell, D. Robbins, S. Dumais, and R. Sarin. Fast, flexible filtering with phlat. In Proc. SIGCHI conference on Human Factors in computing systems, pages 261–270, 2006. [8] N. Ducheneaut and V. Bellotti. E-mail as habitat: an exploration of embedded personal information management. interactions, 8(5):30–38, 2001. [9] S. Dumais, E. Cutrell, J. Cadiz, G. Jancke, R. Sarin, and D.C. Robbins. Stuff i’ve seen: a system for personal information retrieval and re-use. In Proc. ACM SIGIR ’03:, pages 72–79, 2003. [10] D. Elsweiler, M. Baillie, and I. Ruthven. Exploring memory in email refinding. ACM Trans. Inf. Syst., 26(4):1–36, 2008.
[11] D. Elsweiler, M. Baillie, and I. Ruthven. What makes re-finding information diffcult? a study of email re-finding. In Proc. ECIR 2011, 2011. [12] D. Elsweiler, M. Hacker, and S. Mandl. Visualising pim behaviour with markov chains. In Personal Information Management Workshop at Annual Meeting of American Society for Information Science (ASIST 2009), 2009. [13] D. Elsweiler and I. Ruthven. Towards task-based personal information management evaluations. In Proc. ACM SIGIR conference on Research and development in information retrieval, pages 23–30, 2007. [14] W. Jones, H. Bruce, and S. Dumais. How do people get back to information on the web? how can they do it better? Proc. INTERACT, 2003. [15] W. Jones and J. Teevan, editors. Personal Information Management. Seattle: University of Washington Press, 2007. [16] T. W. Malone. How do people organize their desks?: Implications for the design of office information systems. ACM Trans. Inf. Syst., 1(1):99–112, 1983. [17] P. McCullagh and J. A. Nelder. Generalized Linear Models (Second Edition). Chapman and Hall, 1989. [18] B. McKenzie and A. Cockburn. An empirical analysis of web page revisitation. In Proc. of the HICSS34, 2001. [19] A. Y. Ng. Feature selection, l1 vs. l2 regularization, and rotational invariance. In Proceedings of the twenty-first international conference on Machine learning, ICML ’04, pages 78–, New York, NY, USA, 2004. ACM. [20] V. L. O’Day and R. Jeffries. Orienteering in an information landscape: How information seekers get from here to there. In Proceedings of INTERCHI ’93, pages 438–445, 1993. [21] M. Ringel, E. Cutrell, S. Dumais, and E. Horvitz. Milestones in time: The value of landmarks in retrieving information from personal stores. In Proc. INTERACT 2003, pages 184–191, 2003. [22] C. Silverstein, M. Henzinger, H. Marais, and M. Moricz. Analysis of a very large alta vista query log. Technical report, SRC, 1998. Technical Note 1998-014. [23] J. Teevan, E. Adar, R. Jones, and M. Potts. Information re-retrieval: Repeat queries in yahoo’s logs. In Proc. SIGIR ’07, 2007. [24] J. Teevan, C. Alvarado, M. S. Ackerman, and D. R. Karger. The perfect search engine is not enough: a study of orienteering behavior in directed search. In Proc. SIGCHI conference on Human factors in computing systems, pages 415–422, 2004. [25] S. K. Tyler and J. Teevan. Large scale query log analysis of re-finding. In Proc. WSDM ’10, 2010. [26] R. W. White and S. M. Drucker. Investigating behavioral variability in web search. In Proc. international conference on WWW, pages 21–30, New York, NY, USA, 2007. ACM. [27] S. Whittaker, V. Bellotti, and J. Gwizdka. Personal Information Management, chapter Everything through Email, pages 167–189. Seattle: University of Washington Press., 2007. [28] S. Whittaker, Q. Jones, and L. Terveen. Contact management: Identifying contacts to support long term communication. In Proc. CSCW’02, pages 216–225, 2002. [29] S. Whittaker and C. Sidner. Email overload: exploring personal information management of email. In CHI ’96: Proc SIGCHI conference on Human factors in computing systems, pages 276–283, 1996.