textual query language such as SQL, through the use of the iconic metaphore. In this sense ..... form, see Figure 3, dedicated to the join definition. The tables 'book' and ... server component communicate with the database component through ...
Understanding SQL through Iconic Interfaces Lerina Aversano, Gerardo Canfora, Andrea De Lucia, Silvio Stefanucci (aversano/canfora/delucia/stefanucci)@unisannio.it
RCOST – Research Centre On Software Technology Department of Engineering, University of Sannio Palazzo Bosco Lucarelli, Piazza Roma - 82100 Benevento, Italy
Abstract Visual Query Languages represent an evolution, in terms of understandability and adaptability, with respect to traditional textual languages. We present an iconic query system that enables the interaction of a novice user with a relational database. Our goal is to help a novice user to learn and comprehend the relational data model and a textual query language such as SQL, through the use of the iconic metaphore. In this sense our approach is different from most of the visual query systems proposed in the literature that present the user with a higher level query language, hiding the underlying data model. We also present results from an experiment conducted with first year students to evaluate the effectiveness of our approach.
1 Introduction The need for more simple computer interactions is becoming nowadays a key factor for a large variety of software applications. This is particularly important for applications interacting with databases. Indeed, several studies suggest that traditional database query languages are not very simple to use for users non skilled on database technologies as a consequence of the fact that the interaction is based on a textual language such as SQL [R88, Zlo77, YS93]. Visual Query Languages represent an evolution, in terms of understandability and adaptability, with respect to traditional textual languages. Indeed, visual languages exploit the power of new technologies, and in particular multidimensional representations, colors, multiple windows and forms. The use of visual technologies enables a better human-computer interaction by representing database elements in a more natural way and creating an intuitive correspondence between the visual representation provided by the tool and the concepts of
interest to a user. Similar considerations can be applied with reference to the expressiveness of a query. Some main advantages related to the use of these approaches are: • •
a reduction of the time needed to formulate a query by human-computer interaction; an improved use of elaboration resources, due to the fact that the process of generating and selecting a query based on the conceptual description of the database does not involve the DBMS until the execution of the query.
On the other side, visual languages suffer of some technological limitations. For examples they are not useful to represent very complex objects because in this case the graphical structure produced could be very complex, confusing and difficult to use [BB95]. The effort spent to improve the approach of the user to database technology, in particular to reduce and simplify the effort needed to learn commercial database tools, has conducted to a wide diffusion of visual approaches. In the last years several visual paradigms for representing the information have been proposed. Mainly, they can be classified as follows: •
•
Tabular representations, where tables are used to represent data and query are performed by table filling. An example of this approach is the Query By Example (QBE) [Zlo77]; Diagrammatic representations, where graphs and diagrams are used to model and represent the data. As an example, Query By Diagram (QBD) [ACC90, ACS90, CS94] uses the EntityRelationship model [Chen76] to represent the information stored in the database. The QBD representation is characterized by a significant usability, based essentially on the use of pointing and clicking operations, and also by a powerful
•
representation for the queries that are performed by browsing the entity relationship diagram; Iconic representations, where icons are used to represent the data stored in the database. This approach is referred to as Query By Icons (QBI) and takes advantage of the iconic metaphor for the visualization of both structural information and constraints [MC95, MPSC95].
In this paper we present a visual system, named Keiron1, that enables the interaction with a database based on the iconic model. Our goal was not to build yet another visual query tool, rather an iconic system helping a novice user to learn and comprehend a textual query language such as SQL. Indeed, a limitation of visual query systems is the difficulty to express complex queries; more expert users tend to prefer more flexible textual languages to visual languages to express complex queries. Keiron captures and represents the schema of a database through metadata and uses them to map the database entities, namely tables, attributes, types, values and relationships, into visual representation. As a consequence, the system does not require a detailed knowledge about the database structure, neither it requires a knowledge of the SQL syntax. The queries can be formulated by simple click and drag & drop of icons representing the elements (entities and attributes) of the database. The main advantages that this approach presents can be summarized in the following points: 1.
2.
3.
the concepts presented in the database are represented as icons. Details about the logical design (tables and attributes) are not provided to the final user. In this way, the user can simply identify the objects from which he wants to start to compose its query; the system translates the iconic queries into SQL queries, thus enabling non skilled users to understand and learn the syntax of SQL while composing simple visual queries. the system provides the possibility to store visual queries and to select and execute previously created ones.
In this paper we also present results from an experiment conducted to evaluate the effectiveness and the usability of the Keiron iconic model. We compared the Keiron system with respect to SQL and the diagrammatic query language of MS-AccessTM . The paper is organized as follows. Section 2 discusses related work. Sections 3 and 4 present the visual query language and the architecture of the system, respectively. Section 5 presents results from an empirical study on the
1
Keiron was a centaur of Greek mythology famous for his widsom that made him a mythic educator of heroes such as Atteone, Aristeo, Ercole.
use of Keiron by students. Concluding remarks are outlined in Section 6.
2 Related work Very often a database is queried by users who are not familiar with the syntax of query languages such as SQL or simply are not interested in learning a complicated query language. Several alternatives to traditional textual query languages have been proposed to simplify the extraction of information from databases. Most of them are based on visual representations [CCLB95] and direct manipulation interaction mechanisms [S83]. Visual Query Systems (VQSs) may be defined as query systems essentially based on the use of visual representations to depict the domain of interest and express the related requests. VQSs provide user-friendly query interfaces for accessing a database. They include both a language to express the queries in a graphical form (i.e., a visual query language, VQL) and a variety of functionalities to facilitate human-computer interaction. The VQSs are oriented to a large variety of users who have limited technical skills and generally ignore the inner structure of the accessed database. Various VQSs have been proposed, adopting a range of different visual representations and interaction strategies [BCC91, CCL95]. VISUAL [BSO96] is a graphical icon-based query language designed for scientific databases where visualization of the relationships is important for the domain scientist to express queries, because the data has spatial properties and the queries are of exploratory nature. VISUAL graphical query objects and their placements imitate closely what domain scientists use in their applications to represent experiment data-related semantic relationships [SW85] (e.g., composition hierarchies, containment, class-subclass hierarchies, spatial relationships). It uses the example-element concept of QBE [Zlo77] to formulate query objects and takes from Summary-Table-by-Example (STBE) [OMO89] many concepts such as hierarchical subqueries, internal and external queries. Massari et al. [MC95, MPSC95] presented QBI, a visual query processing facility that allows users to query a database through the use of icons. The goal of the system is to provide a language that is easy to use also for non expert users, as it does not require special knowledge of the content of the underlying database or understanding the details of the database schema. Users are presented with database abstractions called complete objects, similar to the universal relation abstraction in relational databases [MU83]. Universal relation systems assume that the database is structured as a single relation whose attributes encapsulate all the semantics of the underlying database. In QBI each class provides a view of the underlying
database from its viewpoint. QBI takes advantage of iconic metaphors for the visualization offering a rather high level interface that allows users to interact with the database and expresses queries by composing and grouping various icons which are metaphors for data structures, attributes and relationships. Users then receive results as icons that can be used in further queries. The main difference between QBI and the other iconic interfaces proposed in the literature [GN88, TA89, THT90] is in the way icons are defined and used for expressing concepts: as opposed to QBI, other systems do not usually assign uniform semantics to icons and adopt instance browsing as the principal querying strategy. Massari et al. [MWC96] also developed a prototype of a query processing facility, based on QBI, that supports the exploration and query of databases from a mobile computer. This satisfies the main characteristics needed for an effective mobile query processing facility. In fact, the icons are particularly suitable for mobile computing since they can be manipulated without typing as the users compose queries by arranging icons interacting with a pointing device. The Query By Diagram (QBD) design [ACC90, ACS90, CS94] involves a fully graphical interface screen allowing the user to interact with an Entity-Relationship diagram of the database model using the mouse and keyboard. The diagrams are particularly effective in representing the relationships existing between concepts, which are mapped into correspondences among the diagram elements. QBD allows to query the database by schema navigation: the user of the QBD interface is always presented with a visual representation of the schema and may browse and explore it in a hierarchical layout, learning about relationships between sets of data, creating new versions of the schema (schema transformation) that more readily match the query that must be performed. The literature reports several experiments aiming at evaluating the ease of use of a single visual language, or aiming at establishing which is the easiest to use among two or more languages. Reisner [R88] reviews most of the experimental research on traditional query languages covering mainly work done on SQL and QBE [Zlo77]. Yen and Scamell [YS93] compared again QBE and SQL taking into account several factors, such as the use of the same DBMS, a similar environment, etc. In their experiment, the query language type affected user’s performance only in so-called “paper and pencil” tests, in which case QBE users have higher scores than SQL users. In on-line tests, the users accuracy was not affected by the type of the language adopted, but the user's satisfaction was much greater with QBE, and his/her efficiency much better. Another interesting work is presented in [AWS93] and exploited a language based on the querying technique called “dynamic query”: given a query, a new query is formulated simply by moving the position of a slider with a mouse and the resulting data is dynamically displayed.
The results confirmed that the dynamic query language would perform better than other query languages used in the experiment. Catarci and Santucci [CS95] compared the visual query language QBD with SQL. The results of the study showed that a visual language is easier to understand and use than a traditional textual language. In [BCM96] the feasibility of constructing queries with diagrammatic rather than iconic visual languages was compared. The aim was determining if there is significant interaction between the query class and the query language type and the type of query language and the experience of the user. The two visual query languages were QBD [ACS90, CS94] and QBI [MC95, MPSC95]. The two languages differ in both the adopted visual formalism (diagrams vs icons) and the main query strategy (navigation vs composition). Experimental results indicate that the effectiveness of the two query languages varies depending on the classes of queries and the kinds of users, supporting the idea that an interface offering to the user various visual representations and query modalities is the most appropriate for a wide set of users and applications. Our goal is different: we have developed a visual query system with the aim of helping novice users to understand and learn the syntax of SQL by exploiting the features of the iconic metaphor. Then we have experimented the system with a fist year computer science course and compared the performances with the diagrammatic language provided by MS-AccessTM (that presents similar features) and SQL itself.
3 A description of the Keiron visual language As described in [BCC91], the process of formulating a database query consists of three main phases: • • •
selection of the components of the database of interest, performed by the user; definitions of the conditions related to this selected parts to produce a results; analysis of the results obtained.
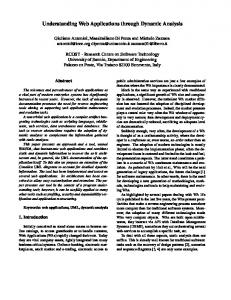
In the Keiron system, the first and second phases of this process, are performed using icons as graphical elements to represent the information involved, and in particular tables, attributes, and queries. Screen areas are used to determine the role of the icons within a query. Figure 1 shows a screenshot of the Keiron main query form. The upper area, numbered 1, lists the database tables and their attributes. Projected attributes, i.e. the attributes to be shown in the result table, are placed in the area 3, whereas the area 4 contains the selection predicates (simple predicates on the left and composed predicates on the right). Areas 2 and 5 depicts aggregation and ordering functions. Finally, the area 6 dynamically shows the SQL statement corresponding to the visual query. Keiron uses
additional panels to define the predicates (see Figure 2) and to express joins (see Figures 3 and 4). The composition of query starts with the identifications of all the involved attributes using drag and drop to move the corresponding icons in the interesting regions of the form. We now illustrates the characteristics of the visual language by means of two descriptive examples of queries taken from the set of queries used in the experiment described in Section 5. Both the examples refer to a simple library database.
1 2
region of the screen and the constant has been typed in the textbox. The corresponding SQL automatically generated is: SELECT book.title FROM book WHERE book.year=’1998’ Example 2. The second query consist of retrieving the titles of books published by the publisher ‘Mondadori’. To perform this query it is necessary to create a join. Clicking the join button in the main form the users obtains a new form, see Figure 3, dedicated to the join definition. The tables ‘book’ and ‘publisher’ are selected moving the corresponding icons from the right to the left part of the area a in Figure 3. Then, to specify the condition it is sufficient move the attribute ‘idpublisher’ in the area b. Similarly to the predicate formulation a new form appears to the user, see Figure 4. Figure 5 shows the form filled to perform the query. The corresponding SQL automatically generated is:
3
SELECT book.title FROM book INNER JOIN editor ON (book.idpublisher=publisher.idpublisher) WHERE publisher.name=’Mondadori’
Attribute to show
4 predicate
5 6
a Figure 1 – Form used to formulate the query in example 1
b
Figure 3 – Form used to formulate the join in example 2 Figure 2 – Form used to formulate the predicate in example 1 Example 1. The first query is a simple selection and consists of retrieving the titles of all the books published in 1998. Figures 1 and 2 show the forms filled to compose the query, in particular Figure 1 shows that the icon associated to the attribute ‘title’ has been located in the area numbered 2 for the projection. Moving the icon corresponding to the attribute ‘year’ in area 3 a form to construct the predicate appear to the user. Figure 2 shows this form where the icon ‘=’ has been moved in the central
Figure 4 – Form used to formulate the join condition in example 2
•
•
instructions starting from the iconic representation of the query; Meta-data manager: it is the module responsible for loading the meta-data characterizing the database to be queried; it is also in charge of managing the queries saved during the previous use of the database; Database Access Manager: it is responsible for managing the access to the database. User Client components Graphical User Interface query Query Manager
Client Access Interface
Network
Figure 5 – Form used to formulate the query in example 2 Server components
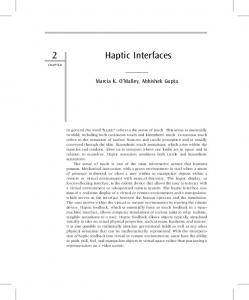
4 The Keiron system architecture Keiron is a Web based application that provides the user with a graphical interface exploiting the icon metaphor to query remote database. The architecture of the Keiron system is composed of three parts (see Figure 6): 1.
2. 3.
a database component containing the database to be queried and the meta-information necessary to characterize it, in particular tables, attributes and previously saved queries; a client component, implemented as a set of applets; a server component, that receives data from the client and send it to the database.
In the architecture there are two main packages, collecting the client and the server components, respectively; the server component communicate with the database component through ODBC. In particular, Figure 7, shows a detailed modularization of the client components. The modules composing the client package are: •
•
Presentation manager: it is the module responsible for managing the graphical components used by the system, and in particular the icons representing tables, attributes and queries in the database; Query manager: it is the module responsible for managing the graphical user interfaces. A key task of the query manager is to generate SQL
Server Access Interface query Server
Database components
D B M S
Database
Figure 6 – Keiron architecture
Query Manager
Presentation Manager
Metadata Manager
Database Access Manager
Figure 7 – Client components architecture For each database to be queried, the Keiron system stores meta-data to model the relations existing between the icons used to represent the database and the elements in the database. These meta-data are managed using the same DBMS on which the production database is stored. Accordingly, the database component in the architecture in Figure 6 is indeed a couple of databases, one containing supporting information used by the server component and the other containing the original database queried by the user.
The ER model of the information stored in the support database is depicted in figure 8. The main entity in the model is ‘Icon’ that has a relation with the other entities of the model that are graphically represented using icons, such as table, attribute and the generated query. The database entity that is not graphically represented using icons has a relation with table and query. Name (1, N)
(1, N)
DataBase
Id
Id
(1, 1)
Table
Icon (1, 1)
Name
Name Label
(1, 1) Imagine
(1, N) Name
(1, 1)
Query (1, 1)
(1, 1)
Location (1, 1)
SQL
Attribute (1, 1)
(1, 1)
Type
Figure 8 – ER model of the support database
5 Experimental study We have conducted a controlled experiment to evaluate in a comparative way the usability of the Keiron iconic model for relational databases with respect to SQL and the graphical querying interface of MS-AccessTM, that can be classified as a diagrammatic query language enriched by a table filling mechanism. 5.1 Experimental setting The participants to the experiment were 88 students recruited from the first computer science course of the Telecommunication Engineering program at the University of Sannio. Part of the course (about 12 hours) was devoted to introduce the basic concepts of relational DBMS and SQL with reference to MS-AccessTM. The student participated in the experiment as part of their exam; 69 of the students were male and 19 were female; the average age of the participants was twenty years; the knowledge of the students about the use of computers and DBMSs was homogeneous: about 20% of the participants had previous knowledge of basic computer science and DBMS concepts, but this gap was filled at the end of the course. The experiment was conducted in the University laboratory during the regular class period; therefore, the students were familiar with the laboratory environment, the hardware, and the operating system. Few days before the experiment, the students were randomly divided into small groups and each group underwent a short training session (half an hour) on the use of the iconic interface of the Keiron query system. In the first 15 minutes the system functionalities were shown
to all the students; then the participants could individually explore the interface and compose queries. Only 14 out of the 88 students participating in the experiment did not attend the training session. However, some of them autonomously learned the use of the Keiron tool during the following open training sessions, thanks to the support of other students who attended the guided sessions. Each student was presented with three databases and three groups of queries expressed in natural language, one for each database. The structure of the three databases was similar (few tables and few simple relations), as well as the complexity level of the three groups of queries. In particular, each database was associated with three queries each corresponding to a classical operation of the relational algebra (selection, projection, and join). The students were required to formulate the queries for each database with a different query language, namely MSAccessTM, Keiron, and SQL. Only the SQL queries were performed in the “paper and pencil” modality, while the other queries were executed using a PC. The students were required to successfully formulate at least six queries to pass the exam. At the end, 70 students successfully completed the test, while 18 did not pass the exam. 5.2 Results In our analysis we were mainly interested in the differences of the performances of students while using the different query environments and for the different query types. We measured the performances as the ratio of the number of resolved queries of each type over the number of students. Tables 1 and 2 show the results considering all the students and only the students that passed the exam, respectively. MS-AccessTM Keiron SQL
Projection Selection 85,2% 86,4% 86,4% 64,8% 83,0% 77,3%
Join 77,3% 55,7% 26,1%
Table 1 – Results for all the students MS-AccessTM Keiron SQL
Projection Selection 97,1% 97,1% 92,9% 77,1% 91,4% 87,1%
Join 85,7% 70,0% 31,4%
Table 2 – Results for all the approved students The projection is the simplest operation. From Table 1 it can be easily seen that the performances do not change significantly changing the query language. This is probably due to the simplicity and intuitiveness of this operation: in both the visual query languages there is only the need of dragging the projected attributes in the right position, while in SQL this is the simplest and elementary construct (just one table is involved and no where part has
to be specified). It is worth noting that if we consider the student who passed the experiment (Table 2), the only two students who failed the projection using MS-AccessTM dragged all the table attributes (and this is clearly wrong), while the students who failed the projection using Keiron or SQL failed also the related join and selection queries, because they likely did not remember how to use the Keiron tool or the SQL basic syntax. Also, the selection is a quite simple operation as it involves only one table. Therefore, we expected performances similar to the projection. We noticed that the specification and writing of the predicate are the main causes for the variations in the performances with respect to the projection (see Tables 1 and 2). The students did not have particular problems in expressing the selection predicate using MS-AccessTM. The small difference of success percentage in the SQL queries is attributable to SQL syntax errors in expressing the predicate (students were required to only write on the paper the SQL queries, so they could not execute them), while the more sensible difference for Keiron queries is certainly due to the small training time. In fact, we visually noted that some students did not remember very well where putting the icons to start up the dialog form for the query predicate. The join is the most complex operation. We used simple databases composed at most of five tables and designed join operations involving only two tables. There are strong differences in the performances of the students using the different query environments. The reason why students perform better when expressing this type of queries in MS-AccessTM seems to be the fact that MS-AccessTM graphical query composer automatically generates inner join constructs whenever a foreign key relationship has been previously defined between two tables. This sensibly helps the students that perceive the whole query construction path as a simple selection operation. This help is not provided in Keiron and this explains the lower success rate. However, the advantage of using the iconic tool over SQL is quite evident from the low percentage of successful queries composed in SQL, as most students made errors in specifying the join construct and condition. It is worth noting that, concerning the 14 students that did not attend the guided training sessions on the use of Keiron, 6 did not resolve any query using Keiron, 2 resolved the projection, and 6 completed all the proposed queries. The latter group of students probably attended the unguided training sessions supported by other students.
The experiment mainly concerned the analysis of the behavior of users while using different types of database tools. We compared the textual query language SQL, the diagrammatic query interface of MS-AccessTM and our iconic query tool. The results achieved are very interesting. Using the Keiron system users demonstrated to improve their knowledge of SQL, and in particular they appreciated the feasibility (area 6 in Figure 1) that allows to dynamically show the SQL text while composing the query. Using this functionality users made several exercises changing the position of the icons in the form and reading the dynamically changed SQL. As discussed in section 5, for simple and intuitive queries the users demonstrated no preference changing the query language. Projection and selection present some differences, as the users typically make errors in the predicate specification. For more complex queries, such as the join, the experiment demonstrated that users make more errors using SQL. However, the join also shows that users perform better with MS-AccessTM than with Keiron. The main reasons are: •
for queries including join, the query composer of MS-AccessTM automatically generates inner join constructs using foreign key relationship already defined by the user, while the Keiron prototype is more complex to use;
•
training with Keiron was too short, while MSAccessTM is a tool largely used, also by students that make most of course exercises using this tool.
Therefore, while the use of an iconic, and in general a visual, tool seems to improve the performances of users over SQL, our prototype still presents some technical limitations with respect to commercial diagrammatic query interfaces. Future work will be devoted to improve these technical issues. It is worth noting that the iconic approach is a valid support to improve the understanding of SQL, as most student improved their performances on SQL exercises after the use of Keiron.
Acknowledgements We would like to thank Massimo Melillo for his work on Keiron System.
References 6 Conclusion and discussion In this paper we presented an iconic system helping a novice user to learn and comprehend a textual query language such as SQL and evaluated the usability of the iconic model in a controlled experiment with students.
[ACC90] M. Angelaccio, T. Catarci, and G. Santucci, “QBD: A Fully Visual Query System”, Journal on Visual Languages and Computing, vol. 1, no. 2, 1990, pp 255-273. [ACS90] M. Angelaccio, T. Catarci, and G. Santucci, “QBD: A Graphical Query Language with
Recursion”, IEEE Transactions on Software Engineering, vol. 16, no.10, 1990, pp 1150-1163. [AWS93] C. Ahlberg, C. Williamson , and B. Shneiderman, “Dynamic Queries for Information Exploration: an Implementation and Evaluation”, B. Shneiderman ed. Sparks of Innovation, HumanComputer Interaction, Ablex Publ., Norwood, NJ, 1993, pp 281-294. [BB95] Burnett, M. Baker, C. Bohus, P. Carlson, S. Yang, and P. van Zee, “The Scaling-Up Problem for Visual Programming Languages”, IEEE Computer, vol. 8, no. 3, 1995, pp. 45-54. [BCC91] C. Batini, T. Catarci, M.F. Costabile, and S. Levialdi, “Visual Query Systems: A Taxonomy”, Proceedings of IFIP W.G. 2.6 Working Conference on Visual Databases, 1991, pp.153-168. [BCM96] A.N. Badre, T. Catarci, A. Massari, and G. Santucci, “Comparative Ease of use of a Diagrammatic Vs. an Iconic Query Language”, Electronic Setries Workshop in Computing, Springer, London, 1996. [BSO96] N. H. Balkir, E. Sukan, G. Ozsoyoglu, and Z. M. Ozsoyoglu, “VISUAL: A Graphical IconBased Query Language”, Proceedings of the 12th International Conference on Data Engineering (ICDE '96), 1996, pp. 524-533. [CCLB95] T. Catarci, M.F. Costabile, S. Levialdi, C. Batini, “Visual Query Systems for Databases: A Survey”, Technical Report SI/RR-95/17 of Dipartimento di Scienze dell’Informazione, University of Rome “La Sapienza”, 1995. [CCL95] T. Catarci, M.F. Costabile, S. Levialdi, and C. Batini, “Query Systems for Databases: A Survey”, Technical Report SI/RR-95/17, Università degli Studi di Roma, Sapienza, Dipartimento di Scienze dell’Informazione, 1995. [Chen76] P.P. Chen, “The Entity Relationship Model toward a Unified View of Data”, ACM Transactions on Database Systems, vol. 1, no. 1, 1976, pp. 9-36. [CS94] T. Catarci and G. Santucci, “Query By Diagram: A Graphical Environment For Querying Databases”, Proceedings of the ACM SIGMOD Conference on Management of Data, 1994, p. 515. [CS95] T. Catarci and G. Santucci, “Diagrammatic vs Textual Query Languages: A Comparative Experiment”, Proceedings of IFIP W.G. 2.6 Working Conference on Visual Databases, Lausanne, Switzerland, 1995, pp. 57-74. [GN88] I.P. Groette and E.G. Nillson, “SICON: an Icon Presentation Module for an E-R Database”, Proceedings of the 7th International Conference on Entity Relationship Approach, Rome, Italy, 1988, pp. 271-289. [MC95] A. Massari and P.K. Chrysanthis, “Visual Query of Completely Encapsulated Objects”, Proceedings
of the 5th International Workshop on Research Issue on Data Engineering, 1995, pp. 18-25. [MPSC95] A. Massari, S. Pavani, L. Saladini, and P.K. Chrysanthis, “QBI: Query By Icons”, Proceedings of the ACM SIGMOD Conference on Management of Data, 1995, p. 477. [MU83] D. Massari, J.D. Ullman, “Maximal Objects and the Semantics of Universal relation Databases”, ACM Transactions on Database Systems, vol. 8, no. 1, 1983, pp 1-14. [MWC96] A. Massari, S. Weissman, and P.K. Chrysanthis, “Supporting Mobile Database Access through Query by Icons”, Distributed and Parallel Databases Journal. (Special issue on databases and mobility), vol. 4, 1996, pp.249-269. [OMO89] G. Ozsoyoglu, V. Mates, and Z.M. Ozsoyoglu, “Query Processing Techniques in the Summary-Table-by- example Database Query Language”, ACM TODS, vol. 14, no. 4, Dec. 1989, pp. 526-573. [R88] P. Reisner, “Query Languages”, M. Helander ed. Handbook of Human-Computer Interaction, Elsevier Science Publ., 1988, pp 257-280. [S83] B. Shneiderman, “Direct Manipulation: A Step beyond Programming Languages”, IEEE Computer, 1983, vol. 16, no. 8, pp 57-69. [SW85] A. Shoshani and H.K.T. Wong, “Statistical and Scientific Database Issues”, IEEE Transaction on Software Engineering, Oct. 1985, pp. 1040-1047. [TA89] Y. Tonomura and S. Abe, “Content Oriented Visual Interfaces Using Video Icons for Visual Database Systems”, Proceedings of the IEEE Workshop on Visual Languages, Roma, Italy, 1989, pp. 68-73. [THT90] K.Tsuda, M. Hirakawa, M. Tanaka, and T. Ichikawa, “Iconic Browser: An Iconic Retrieval System for Object-Oriented Databases”, Journal of Visual languages and Computing, vol. 1, no. 1, 1990, pp. 59-76. [YS93] M.Y. Yen and R.W. Scamell, “A Human Factors Experimental Comparison of SQL and QBE”, IEEE Transactions on Software Engineering, vol. 19, no. 4, 1993, pp 390-402. [Zlo77] M.M. Zloof, “Query-by-Example: A Database Language”, IBM Systems Journal, vol. 16, no. 4, 1977, pp. 324-343.