Understanding Team C2 Behaviour Using Chat Logs Dr. Anthony H. Dekker Joint Operations Division Defence Science and Technology Organisation (DSTO) Canberra, Australia
[email protected] Abstract. In many games, simulations, and exercises, participants use chat tools for communication. The resulting chat logs reveal significant information about team behaviour. We have developed a set of tools for analysing chat traffic, involving textual analysis of spell-corrected chat logs. The result is a series of graphs showing participant activity over time, occurrence of keywords over time, and participant/keyword interaction. The tool suite can shed light on team interactions by identifying both differences between people and patterns in keyword usage. We illustrate our analytical process with analyses of an Internet discussion and of a simple game organised around text chat.
1.
INTRODUCTION
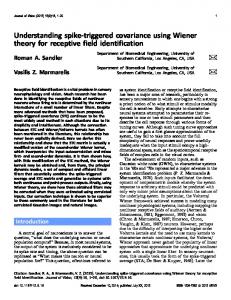
In the study of Command and Control (C2), understanding actual team behaviour is an important step in optimising structures and processes. A large clue to behaviour of a C2 team is provided by textual information, particularly logs of conversations in electronic chat rooms. Such textual information can be provided by military exercises or operations, workshops, or simulation experiments. A challenge of processing such textual chat logs is that they are frequently written in informal English, possibly including spelling errors, ungrammatical constructions, and jargon. Such chat logs are therefore not a candidate for traditional natural-language processing methods, as described by, for example, Firebaugh (1988). While considerable research has been conducted on the network structure of textual conversations within a team – by Jarvis (2005), for example – less work has been conducted on analysis of the actual text content. In this paper, we describe a tool suite for such text analysis. As with Ramachandran et al. (2010), we avoid the problems associated with natural-language processing by considering only the occurrence of keywords. Figure 1 illustrates the use of the tool suite. 2.
(Martins, 2004) modified by two files of “don’t correct x” and “always correct x to y” instructions. The Java-based parsing software produces four tables: A matrix with the number of messages sent by each major participant within time blocks of userspecified duration. This requires specifying a threshold number of messages to characterise “major” participants. This table is processed in R to produce graphs like Figures 2 and 3. A list of all words in the spell-corrected chat log, with their frequencies, as an aid to choosing appropriate keywords. A matrix with the number of uses of each keyword within time blocks. This is processed in R to produce graphs like Figure 4. A matrix with the number of uses of each keyword by each major participant. This is processed in R to produce graphs like Figure 5. Production of these tables relies on a parsing module which handles different chat log formats by dynamically loading appropriate line-parsing classes. The user must specify the file format by selecting an appropriate named class. All remaining processing is completely generic.
TOOL ARCHITECTURE
Rather than develop an integrated tool, such as that of Lo et al. (2010), which was unsuitable for our purposes, our tool suite combines chat log parsing software written in the Java language with statistical analysis and visualisation scripts written in R (Maindonald and Braun, 2007). These scripts produce graphs such as those shown in Figures 2, 3, 4, and 5; as well as performing some statistical tests. This approach permitted relatively sophisticated analysis with minimal coding effort. As with Ramachandran et al. (2010), we interpreted the chat log text by searching for manually chosen keywords. To handle the common problem of misspellings by chat participants, the chat log parsing software includes automatic spelling correction using the JaSpell package
Figure 1: Flowchart for the chat log analytical process. Java programs create the four tables in the centre row, and R scripts create the four graphs in the bottom row, which correspond to Figures 2, 3, 4, and 5.
3.
CASE STUDY
To illustrate the capacities of our tool suite, we used a chat log from a discussion session on science education held in February 2008. This chat log was conveniently available on the Internet.
silenced, enormous differences between the remaining most vocal (58 messages) and least vocal (1 message) would still remain. Methods for improving equality of participation must therefore address the systemic issues which discourage the less vocal participants from contributing.
3.1 Histogram of participation As in Dekker (2011), the histogram of participation in Figure 2 shows both differences in the number of messages produced by different people, and variations in the number of messages over time. Initial discussion, for example, was dominated by participant P5 (purple in Figure 2), while participant P4, (brown in Figure 2), left the discussion after 95 minutes. Since we are considering single-room chat sessions, there is no network structure in the interactions, and hence centrality plots such as those in Dekker (2011) would provide no additional information.
Figure 3: The straight line (R2 = 94%) on this log-log plot indicates that interactions approximately follow a power law (with a truncated tail). The nine most vocal participants are coloured as in Figure 2. 3.3 Keywords In a similar way to the histogram in Figure 2, we can also plot a histogram of keyword usage. The use of spelling correction in chat log parsing reduces the chance of missing misspelled keywords.
Figure 2: Histogram of participation during the science education chat session. The nine most vocal participants are coloured. 3.2 Power-law relationships Our analysis scripts allow the further analysis of contributions by participants using log-log plots of messages against ranking (with the most vocal participant ranked 1, the second most vocal ranked 2, etc.). Figure 3 shows the plot for the science education chat session. As in Dekker (2011), interactions by participants in this chat session approximately followed a power law with a truncated tail, as shown by the log-log plot in Figure 3. Such a power-law relationship indicates that the bulk of participants contribute much less than the most vocal participants. Furthermore, it indicates a systemic problem rather than an individual one – if, say, the four most vocal participants (P1, P2, P4, and P5) were
Figure 4: Histogram of selected keywords used during the science education chat session.
The keyword list may contain manually specified suffixes so that, for example, “chem.istry” matches both “chem” and “chemistry.” Similarly, “teach.er.es.ing” matches “teach,” “teacher,” “teaches,” and “teaching.” Abbreviations like “chem” mean that ordinary wordstemming algorithms are inadequate for finding suffixes. As Figure 4 shows, such a histogram highlights topic changes during the session. For example, most discussion on chemistry and physics occurred between 85 and 95 minutes into the session. 3.4 Person/Word Interactions Further light is shed on word usage by a mosaic plot, such as the one in Figure 5, which shows keyword usage by major participants. For example, participant P5 dominated discussion of physics, while P2, P6, P7, and P8 were not involved at all. Figure 6: Differences in communication by major participants visualised using classical multi-dimensional scaling (MDS). The area of each circle shows the total number of words produced by that person. Participants P3, P8, and P9 stand out because they use the keywords in Figure 5 heavily, but in different ways. 4.
Figure 5: Mosaic plot of keyword usage by major participants. A χ2 test conducted by the R script shows that the variations in person/word interactions in Figure 5 are statistically significant (with p < 0.02). An alternate view of communication is given by the multi-dimensional-scaling (MDS) plot in Figure 6. This plot is produced by taking the counts in Figure 5 as vectors, e.g. (1, 0, 4, 2, 1, 0, 0) for P1. These are then scaled by the total number of words uttered by each person (e.g. 109 for P1) to give frequency vectors, e.g. (0.009, 0, 0.037, 0.018, 0.009, 0, 0) for P1. Euclidean distance between these frequency vectors gives a measure of similarity between people, which the MDS plot illustrates. Participants P1, P2, P6, and P7 cluster together on the left of the diagram because most (at least 85%) of their words are outside the keyword set, while P4 and P5 have a fairly even spread of keyword usage. The outliers are P3, P8, and P9, who have heavy but differing keyword usage, their most frequent keywords being, respectively, “lab.s,” “science,” and “bio.logy.”
EXPERIMENT CASE STUDY
The case study described above was essentially a “proof of concept” study, and a confirmation that the tool suite was capable of identifying important patterns in chat logs. The first practical use of the tool suite involved an experiment in which a hybrid team of five intelligent software agents and one human being collaboratively solve an instance of the assignment problem (Christofides, 1975), finding the best one-to-one match between a set of 6 notional platforms and a set of 6 areas of operation (Dekker, 2012). The problem is implemented as a simple computerised game. Figure 7 shows an example instance of the game and its optimal solution. Each participant is responsible for choosing the entry in one row of the matrix; these entries must not conflict. Orangeland Greenland Whiteland Yellowland Puma Falcon
Not ideal
Avoid if poss.
Operates well
Must be used
Use if possible
Piranha
Not ideal
Stingra Operates y well
Operates well
Avoid if poss.
Scarlet City
Blueland
Use if possible Use if Operates possible well Not ideal
Not ideal
Operates well
Eagle
Operates well
Not ideal Not ideal
Wolf
Use if Do not use Not ideal possible
Operates Operates well well
Figure 7: An instance of the game and an optimal oneto-one matching between platforms (Puma, Falcon, etc.) and areas of operation (Orangeland, Greenland, etc.). The human and agent participants in this game interact via a text chat facility; the agents were programmed to produce and understand a limited range of text messages expressing their preferences for a solution. This
interaction required using specific (correctly spelled) keywords, so that the spell-correction facility in the analysis tool suite was not necessary in this case. However, spell-correction will be essential for future analyses of chat logs produced by teams consisting only of human beings. Figure 8 shows a histogram of messages produced by participants in the course of one instance of this game, in which the human and agent participants were required to relay significant amounts of information to each other. This involved a large amount of traffic initially, decreasing after the first six minutes to about 10 messages per minute.
represents communication of a decision; this occurs mostly in the last three minutes. Figure 8 contrasts visibly with Figure 10, which results from analysing a chat log for a game where the participants were linked by a fully connected network. Here no retransmission was needed, and participants made their decisions far more quickly.
Figure 9: Histogram of keyword usage for the experiment case study, using a chain network.
Figure 8: Histogram of participation for the experiment case study, using a chain network. Participant H is a human, while A1, A2, A3, A4, and A6 are software agents. The “Other” category is empty in this case. For the game in Figure 8, the participants were connected in a chain, with agents A2 and A3 at the ends. These two agents did not need to relay any information, and hence largely fell silent after the first two minutes. During the 2 nd minute, agent A3 made a choice of an entry in its row of the matrix (forced by a “must be used” constraint), and hence had no further need to communicate. Agent A2 did not make a decision until the 11th minute; in the course of negotiating this decision, it sent messages in the 3 rd and 4th minutes which are visible in Figure 8. Overall, Figure 8 highlights several important features of the interactions within the hybrid team. Further light is shed by the keyword plot in Figure 9. The keywords “used,” “suited,” and “operate” (green and cyan) indicate initial constraints which are transmitted and retransmitted across the network. Use of these keywords decreases over time. The keywords “like(s),” and “want(s)” (orange and red) indicate expression of preferences for a solution; these are expressed more or less continuously. The keyword “locked” (pink)
Figure 10: Histogram of participation for the case study, using a fully connected network. Participant H is a human, while A1, A2, A3, A4, and A6 are software agents. The “Other” category is again empty. Far fewer messages were sent here than in Figure 8.
5.
DISCUSSION
In this paper, we have demonstrated the utility of our analysis tool suite in identifying important characteristics of chat logs, and hence shedding light on the interactions within the teams which produced those logs. In future work, we hope to apply the tool suite more broadly to C2 experiments, and we expect it to reveal useful insights into team dynamics in that context. An important aspect of exercises and simulation experiments is integration between the human and technical aspects of the broader system. This requires an understanding of how human beings are interacting with each other and with the technology, and chat log analysis is one tool for developing such an understanding. Histograms like Figures 2, 4, 8, 9, and 10 show the “phases” that occur during exercises and experiments. These phases can be identified by changes in keyword usage. The histograms also show when these phases begin and end, and who is involved in them. In our future work, we also plan to make the text analysis more sophisticated, while still taking account of the fact that that chat logs are not written in formal English. Rather than using keywords, phrases of k words (for suitably chosen k) may be more insightful (Lee et al., 2005; Dekker, 2009). Self-organising maps (Honkela et al., 1996) may also provide a way of automatically characterising messages, using a form of unsupervised neural-net learning. Alternatively, Latent Dirichlet Allocation (Blei, 2012) may provide a way of characterising messages statistically. REFERENCES Alberts, D.S. & Hayes, R.E. (2003) Power to the Edge, CCRP Publication Series, Washington, DC, www.dodccrp.org/files/Alberts_Power.pdf Alberts, D.S. & Hayes, R.E. (2006) Understanding Command and Control, CCRP Publication Series, www.dodccrp.org/files/Alberts_UC2.pdf Blei, D.M (2012) “Probabilistic Topic Models,” Communications of the ACM, 55 (4), April, pp 77– 84. Christofides, N. (1975) Graph Theory: An Algorithmic Approach, Academic Press, London. Dekker, A.H. (2009) “Deriving Agent-Based Simulation Models from Textual Data,” in Anderssen, R.S., Braddock, R.D., & Newham, L.T.H. (eds), 18th International Congress on Modelling and Simulation (MODSIM 2009), Modelling and Simulation Society of Australia and New Zealand (MSSANZ), 13–17 July, Cairns, Queensland, Australia, ISBN: 978-0-9758400-7-8, pp. 2936– 2941, www.mssanz.org.au/modsim09/H4/dekker_H4.pdf Dekker, A.H. (2011) “Temporal Social Network Analysis of Discourse,” in Chan, F., Marinova, D. & Anderssen, R.S. (eds), 19th International Congress on Modelling and Simulation (MODSIM 2011), MSSANZ, 12–16 Dec, Perth, Australia, ISBN: 9780-9872143-1-7, pp. 447–453, www.mssanz.org.au/modsim2011/A6/dekker.pdf
Dekker, A.H. (2012) “Analyzing Team C2 Behaviour using Games and Agents,” Proceedings of the 17 th International Command and Control Research and Technology Symposium, Fairfax, Virginia, USA, June 19–21. Firebaugh, M.W. (1988) Artificial Intelligence: A Knowledge-Based Approach, Boyd & Fraser. Honkela, T., Kaski, S., Lagus, K., & Kohonen, T. (1996) “Exploration of full-text databases with selforganizing maps,” Proc. International Conference on Neural Networks (ICNN-96), Vol. 1, pp. 56–61. Jarvis, D.A. (2005) “A Methodology for Analyzing Complex Military Command and Control (C2) Networks,” Proceedings of the 10 th International Command and Control Research and Technology Symposium, McLean, Virginia, USA, June 13–16: www.dodccrp.org/events/10th_ICCRTS/CD/papers/099.pdf
Lee, M.D., Pincombe, B.M., & Welsh, M.B. (2005) “An empirical evaluation of models of text document similarity,” in Bara, B.G., Barsalou, L.W., and Bucciarelli, M. (eds.), Proceedings of the 27 th Annual Conference of the Cognitive Science Society, pp. 1254–1259. Lo, E., Au, A., Hoek, P., & Eberl, L. (2010) “Combining Contextual Data in the Analysis of Temporal Social Networks,” TTCP Human Sciences Symposium, Sydney, Australia. Maindonald, J. & Braun, W.J. (2007) Data Analysis and Graphics Using R – An Example Based Approach, 2nd ed, Cambridge University Press. Martins, B. (2004) JaSpell package, Department of Informatics, Faculty of Sciences, University of Lisbon, jaspell.sourceforge.net/ (BSD license). Ramachandran, S., Jensen, R., Denning, T., Bascara, O., Carpenter, T., & Sucillon, S. (2010) “Automated Chat Thread Analysis: Untangling the Web,” Interservice/Industry Training, Simulation, and Education Conference (I/ITSEC), Orlando, Florida, www.dtic.mil/cgi-bin/GetTRDoc?AD=ADA532774