UNDERSTANDING TEMPERATURE EFFECTS ON PV SYSTEM PERFORMANCE Thomas Nordmann, Luzi Clavadetscher,
[email protected],
[email protected] TNC Consulting AG, Seestrasse 141, CH-8703 Erlenbach, Switzerland.
ABSTRACT Within the framework of Task 2 of the Photovoltaic Power System Programme (PVPS) of the International Energy Agency (IEA) performance results of grid-connected and stand-alone PV systems in different countries have been compared. In this paper the effect of the elevated cell-temperature on the annual performance of 18 selected grid-connected PV systems of different mounting (freestanding, roofmounted and integrated PV facades) from different geographic location in 5 countries are analysed. Annual datasets of hourly data have been used for this in depth analysis. 1. INTRODUCTION
Freestanding
Flat roof
System Losses
Stadtmühle R
Laus
Marzili Muttenz
Bolzano
Zulehner
0 Portugaller
0 Domat
20
Nagoya City 4
1
Wildkogelbahn
40
Buchinger
2
Hiroshima-City
60
Becker
3
Bologna
80
Aachen
4
Klammt AG Stadtmühle F
100 Temperature [°C], PR [%]
Sloped roof
5
Stadelhofen
kwh / kWp * d
• • • •
Facade (integrated) Sloped roof Freestanding Flat roof
Final Yield
The following figures (2 to 6) show the rise of the module temperature (Tm - Tam) in respect to the irradiation for the different types of mounting. The figures represent hourly data during the operation of the plant over one year. For each type of mounting two samples are shown, usually one with high and one with a low module temperature. A wide spread in cluster of points would indicate influences other than the irradiation, such as wind or airflow. 3.1 Sloped roof, highly integrated The plant Stadelhofen in Switzerland (figure 2) shows a high module temperature. The cells are mounted on the inside of a compound insulation glass of a slightly sloped roof. It seems that there is little air circulation inside the building in the roof area. The maximum measured module temperature was 85°C and the mean rise in temperature from ambient is about 55 K at 1000 W/m2. This plant showed the highest module temperature of the plants compared, this results in an annual loss of 11.3 %. The integrated compound modules are part of the architectural design and provide daylight in corridor of a school building. 60
Delta T, T_m - T_am [K]
2. PLANTS INVESTIGATED
Conversion Losses
The types of mounting are grouped in 4 main types:
3. MODULE TEMPERATURE
The IEA PVPS Database now contains monitored monthly datasets from 370 PV systems of different technologies, located in 15 countries [1] [2]. About 48 % of these are mounted on a sloped roof, 45 % are freestanding, mounted on a flat roof or on a soundbarrier and 6 % are on a facade. The degree of building integration varies from non to highly integrated. Some of the datasets in the IEA PVPS Database contain the measured mean module temperature. By using annual datasets of hourly monitored data it was possible to determine the rise in module temperature with the irradiation and also the quantify the energy losses due to elevated module temperature for specific type of mounting.
Facade
The 18 grid connected PV plants investigated are located in Austria, Germany, Italy, Japan and Switzerland. The monitored annual datasets were supplied by the Task 2 members of each country. All the 18 plants are grid-connected systems and the modules are made from crystalline silicone cells.
50 40 30 20 10 Stadelhofen 0
Performance
Availability
Modultemperature
0
0.2 0.4 0.6 0.8
1
1.2
Irradiation, G_i [kW/m^2]
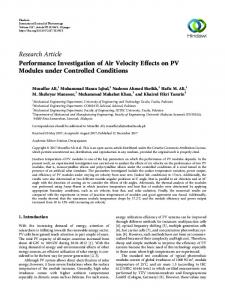
Figure 1, shows the annual values of the normalised losses and yields, the performance, the availability of the plant and the module temperature of the 18 plants analysed.
Figure 2, rise in the module temperature from ambient, plant Stadelhofen Switzerland.
3.2 Facade, integrated
The facade of the plant Klammt AG consists of opaque, insulated PV-cladding elements with an air-gap between the module and the insulation for cooling the air-gap seems to narrow for proper cooling, resulting in a higher cell temperature. The typical rise in module temperature from ambient for the 3 integrated facade system is between 46 and 52 K and the annual temperature losses are between 5 and 7 %.
50
30 20 10 Aachen 0
40 30
30 20 10
0.2 0.4 0.6 0.8
1
20 10 Bolzano
0
0 0
0.2 0.4 0.6 0.8
1
1.2
0
0.2 0.4 0.6 0.8
4. TEMPERATURE LOSSES For the purpose of comparison only the data during the full operation of the plant were used for the calculation of the values represented in figure 6. Any large differences in the conversion losses (LC) are due to shading, partial disconnection of strings or disconnection single inverters in multi inverter systems.
Facade
Klammt AG 0
0.2 0.4 0.6 0.8
1
Sloped roof
Freestanding
Flat roof
100%
50
80%
40
60%
30
40%
20
20%
10
1.2
Irradiation, G_i [kW/m^2]
3.3 Sloped Roof
0%
Delta T, T_m - T_am [K]
20 10
40
Modultemperature
Muttenz
Stadtmühle R
Laus
Marzili
Bolzano
Zulehner
Portugaller
Domat
Nagoya City 4
Wildkogelbahn
Buchinger
Hiroshima-City
Becker
Bologna
Stadtmühle F
Aachen
Klammt AG
Final Yield Ambient Temperature
20
Losses 10
Temperature
16%
60
12%
40
8%
20
4%
0
0%
-20
Becker 0 1.2
Irradiation, G_i [kW/m^2]
0
0.2 0.4 0.6 0.8
1
1.2
Irradiation, G_i [kW/m^2]
Figure 4, rise in the module temperature from ambient, plants Buchinger and Becker in Austria.
Temperature Loss
0 1
System Losses
Conversion Losses
30
Buchinger 0.2 0.4 0.6 0.8
Temperature Losses
Figure 6, yield and losses as percentages, mean daytime ambient temperature and mean module temperature for 18 the plants investigated.
50
30
0
Stadelhofen
Figure 4, is an example of a well cooled and not so well cooled sloped roof system. The range of the rise of temperature from ambient in the systems investigated is between 20 and 34 K and the temperature losses range from 1.7 to 7 %. The cooling of a PV array mounted in a sloped roof depends on the level of integration or on the size of the air-gap between the roof and the modules.
40
1.2
Figure 5, rise in the module temperature from ambient, plants Zulehner in Austria and the plant Bolzano in Italy.
10
1.2
50
1
Irradiation, G_i [kW/m^2]
Irradiation, G_i [kW/m^2]
Figure 3, rise in the module temperature from ambient, plants Achen and Klammt AG in Germany.
Delta T, T_m - T_am [K]
30
20
Irradiation, G_i [kW/m^2]
0
40
Zulehner
0 0
Delta T, T_m - T_am [K]
40
Temperature [°C]
40
50
-40
-4%
3.4 Freestanding and Flat Roof Freestanding and flat roof systems usually allow a free airflow around the modules and have therefore lower temperature losses. Of the freestanding and flat roof systems analysed the temperature rise is between 20 and 28 K and the temperature losses between 1.7 and 5 %
Rise in Temperature [K]
Delta T, T_m - T_am [K]
Delta T, T_m - T_am [K]
50
Delta T, T_m - T_am [K]
50
Figure 3 shows the module temperature of two facade integrated systems in Germany. The facade elements of the plant Aachen are partly transparent compound glass insulation modules like on the plant Stadelhofen. There seems to be a free airflow on the inside of the building, resulting in a lower cell temperature.
Sloped roof, highly integrated
Facade
Sloped roof Freestanding
Flat roof
Figure 7, is an overview of the results of all the 18 PV systems, showing the temperature losses and the rise in module temperature from ambient (K at 1000 W/m2) grouped by the type of mounting.
Annual Mean Temperatures Module Temperature
Plants analysed Tilt Mounting
Name
Power
Country [° ]
Sloped roof highly integrated Stadelhofen
CHE
5
Façade
Irradiation Ambient Ambient Module Maximum Daytime
Rise
Temperature Loss
P0
Hi
T am
T am, d
Tm
T m, max
T m, Hi
L
[kW]
[kWh / m2]
[°C]
[°C]
[°C]
[°C]
[K/kWh/m2]
[%]
[%]
[kWh/kWp]
896
13
17
51
85
55
11.3
80
720
9.4
PR
t
Y
f, a
integrated
Aachen
DEU
90
4.0
785
17
40
67
46
6.4
62
486
integrated
Klammt AG
DEU
90
20.1
852
15
41
64
52
7.2
59
506
integrated
Stadtmühle F
CHE
90
16.4
731
11
16
37
65
46
5.3
82
599
Becker
AUT
30
3.2
1359
10
14
37
64
34
5.2
63
852
Bologna
ITA
24
2.3
1138
22
38
61
23
5.5
83
946
Buchinger
AUT
26
1.8
1250
10
16
29
57
20
1.7
68
849
Sloped roof
Hiroshima City
JPN
19
2.9
1450
19
23
41
70
31
7.0
74
1073
Wildkogelbahn
AUT
26
4.7
1407
1
6
20
48
22
-2.1
74
1047
Soundbarrier
Domat
CHE
45
104.0
1522
10
14
31
54
24
2.8
82
1241
Freestanding
Nagoya City 4
JPN
10
3.6
1338
17
21
36
65
26
5.0
82
1098
Freestanding
Portugaller
AUT
1.3
1300
9
15
33
57
25
3.7
52
670
Other
Zulehner
AUT
50
2.0
1157
9
15
29
59
20
1.7
70
813 1004
Flat roof
Bolzano
ITA
40
1.6
1344
16
34
58
27
4.0
75
Laus
AUT
39
2.4
1151
11
17
35
64
25
4.2
78
893
Marzili
CHE
35
22.7
1290
10
16
34
55
25
3.8
74
956
Muttenz
CHE
45
21.2
1164
8
15
31
58
25
2.8
78
911
Stadtmühle R
CHE
25
15.0
1092
11
15
31
61
28
2.5
79
859
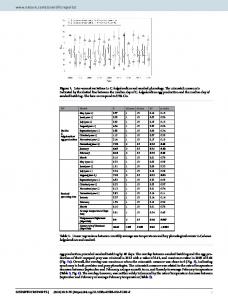
Table 1, key performance and temperature data of the systems analysed. Of some systems only daytime data was available and therefore the annual mean ambient temperature is missing.
Figure 7 shows clearly that the type of mounting and the manner of integration can have a significant influence on the rise in module temperature and the temperature losses. 5. MONTHLY DATA
Temperature Losses
System Losses
Conversion Losses
Final Yield
Modultemperature
December
12%
8%
4%
0%
-4%
Temperature [°C]
0
October
50%
November
10
September
60%
July
20
August
70%
May
30
June
80%
April
40
March
90%
February
50
January
100%
Figure 8 is typical example of the monthly variation of the module temperature and the temperature losses. This plant in Japan is located in an area with high daytime temperatures in the summer months. The temperature losses range from 11 % in July to a gain of 3.6 % in January (figure 9). Figure 10 shows the annual values for the final yield, system losses, conversion losses and the temperature losses.
Temperature Losses
Of the 18 systems analysed 17 showed an annual temperature losses ranging from 1.7 % to 11.3 %. One alpine system, Wildkogelbahn in Austria, due to low ambient temperature, has a temperature gain of 2 %. A well cooled PV array can have a temperature rise of about 20 K and a temperature loss of less than 3 %.
10
20 30 40 50 Modultemperature
60
Figure 9, mean module temperature vs. temperature losses, plant Nagoya City 4 in Japan. Temperature Losses (5%)
Conversion Losses (7%) System Losses (5%)
Ambient Temperature Final Yield (83%)
Figure 8, yield and losses as percentages, mean daytime ambient temperature and mean module temperature, monthly values of a freestanding plant, Nagoya City 4 in Japan.
Figure 10, annual yield and losses, plant Nagoya City 4 in Japan.
6. CONCLUSIONS The analyses of these 18 grid-connected PV systems showed the importance of the optimal mounting and in the case of building integration a well designed layout to achieve an efficient cooling of the PV-modules. Freestanding and flat roof mounted systems show the lowest rise in temperature. Sloped roof systems need a free airflow between the roof and the modules. Integrated facade systems require a high degree of sophistication to get sufficient cooling of the modules. Analysing PV systems data from various sources, it became clear that optimal placement of the temperature sensor for the ambient and module temperature is important. It also seems that the DC-power measurement is the most difficult to get reliable results.
The authors wish to thank their colleagues from IEA PVPS Task 2 for supplying the data for this study.
7. REFERENCES [1] IEA PVPS Task 2 Report, Analysis of Photovoltaic Systems, Report IEA-PVPS T2-01: 2000, April 2000. [2] IEA PVPS Task 2 Report, Operational Performance, Reliability and Promotion of PV Systems, June 2002. [3] IEA PVPS Task 2, Performance Database, May 2003, www.task2.org. [3] Guidelines for the Assessment of Photovoltaic Plants, Document A and Document B, June 1993, JRC, Ispra Italy. [4] International Electrotechnical Commission (IEC): Standard IEC 61724, Photovoltaic System Performance Monitoring - Guidelines for Measurement, Data Exchange and Analysis. [5] H. Häberlin and Ch. Beutler, Normalized Representation of Energy and Power for Analysis of Performance and On-line Error Detection in PV-Systems. Proc. 13th EU PV Conference, Nice, 1995.