UNDERSTANDING THE BEHAVIOUR OF CDMA-BASED CELLULAR NETWORKS WITH A USER-FRIENDLY SIMULATION SOFTWARE Xavier Lagrange, Boulbeba Karoui Institut TELECOM, TELECOM Bretagne, Universite europeenne de Bretagne
2 rue de la Chataigneraie , 35576 Cesson Sevigne Cedex, France
[email protected],
[email protected]
Keywords:
Universal Mobile Telecommunications System (UMTS), Code Division Multiple Access (CDMA), Simulation Software, Virtual Labs,e-learning in network engineering
Abstract:
The Universal Mobile Telecommunications System (UMTS) has been developed in order to create a unified telecommunications system with multimedia capabilities. UMTS uses the Code Division Multiple Access (CDMA) technique. In this type of system, all users share the same frequency at the same time. Interference then plays a major role in the behaviour of a CDMA network and causes the coverage to vary according to the load. Furthermore many parameters have an impact on the coverage (spreading factor, user rate, transmission power etc...). So motivating students to learn CDMA concepts is often difficult because they find it very difficult to understand the physical phenomena. To overcome this problem, students need to practise several laboratory exercises. Then they need a suitable simulation tool. In this paper a simple cellular model is introduced and a CDMA software based on that model is described. Its effectiveness as a teaching method is explained. This simulator can help students to understand the CDMA network behaviour more accurately.
1
INTRODUCTION
The exciting pace of wireless telecommunications system evolution has marked the last few years. This fast evolution is the result of the huge success of digital mobile systems and the increasing demands of mobile users for Internet oriented applications. Second generation systems mainly offered telephony services and data transmission with moderate rates. Third generation networks have multimedia capabilities, such as the support for high bit rates and the introduction of packet data/IP access. Main third generation systems are UMTS (Universal Mobile Telecommunication System) standardized within 3GPP (Third Generation Partnership Project) (Lagrange, 2005) and CDMA2000, which is an evolution of the north-American system IS-95 and which is standardized by 3GPP2. Both air interfaces use the CDMA (Code Division Multiple Access). CDMA is suited for data transfer with bursty behaviour. However, CDMA is much more complex than classical Time Division Multiple Access (TDMA). All users in a cell are transmitting
on the same frequency and thus create interference to each other. Power control has, therefore, a major impact on a network based on CDMA. Each transmitter has to adapt its transmission power to the optimal level that allows both a good quality of service and a high capacity. That transmission power level increases with the number of the users. Hence coverage and capacity are two antagonist notions. The higher the load is the lower the coverage is. In this paper, a user-friendly simulation software that may ease understanding of the behaviour of CDMA-based cellular networks is presented. This paper is divided into seven sections. Section 2 is a reminder of spread spectrum and cellular CDMA systems. Section 3 describes the simulation tool context and objectives. Section 4 introduces the model used in the simulator software and the main functions. Section 5 gives the simulator features. Section 6 presents some laboratory exercises for students that can be achieved through the simulator tool. Section 7 gives some feedbacks on the use of the tool. Finally, section 8 proposes some possible evolutions of the simulator.
2 2.1
CELLULAR AND CDMA FUNDAMENTALS Spread Spectrum Interest
In a transmission system, the correct reception of a transmitted information bit requires a certain relationship between the energy received per information bit Eb and the noise spectral density N0 . The ratio Eb /N0 must be higher than a threshold to guarantee a maximum bit error rate (BER). That threshold can be assumed in the first approximation step to be independent of the transmission and modulation scheme. Consequently that threshold is given by : Eb /N0 ≥ (Eb /N0 )T
(1)
where the threshold (Eb /N0 )T is typically 6 dB for a 10−3 BER (ratio 4 in a linear scale). In direct-sequence spread spectrum systems, devices transmit chips instead of bits at a higher rate than necessary. For a user bit rate R, chips are transmitted at a rate W : each bit is replaced by a sequence of W /R chips. In order to keep good spectrum properties the sequence is pseudo-random and hence the bandwidth of the transmitted signal is W for simple modulation schemes as opposed to the bandwidth of the user bit flow that is R. As a conclusion, the spectrum is spread and ratio W /R is then called the spreading factor or the spreading gain. In the transmitter, each data bit is multiplied with the spreading sequence and then sent on the air. In the receiver, the spread signal is also multiplied by the same sequence and integrated over the bit period (this is the simplest receiver, for an exhaustive presentation see (Proakis, 2001)). This operation is called despreading. The original user flow is then recovered. The signal is generally interfered by thermal noise and interferences. However, de-spreading is neutral for all noise and interferences thanks to the random properties of the spreading sequence. Let C be the received signal power at the receiver. Let Itot be the power of all the interferences. The following formula is admitted: Eb W C = N0 R Itot
(2)
Let β = (Eb /N0 )T WR . Constraint 1 may be combined with equation 2 and be re-written as follows: C >β Itot
(3)
Equation 3 shows that β is the minimum required C/I. In UMTS (Holma and Toskala, 2004), W = 3.84
Mchip/s and R depends on the user service but is typically 15000 bps for voice services. Hence W /R = 256 (spreading gain 24 dB). In all cases W /R is larger than 1 and consequently ICtot may be lower than 1. As a conclusion, spread spectrum systems tolerate a level of noise and interference much higher than the signal. For instance with (Eb /N0 )T = 6 dB and a spreading gain of 24 dB then β = −18 dB. For the system to work well C/Itot must be just higher than −18 dB.
2.2 CDMA principle Code division multiple access (CDMA) is a form of multiplexing that does not divide up the channel by time (as in TDMA:Time Division Multiple Access) or frequency (as in FDMA:Frequency Division Multiple Access) but by codes. CDMA uses direct-sequence spread spectrum but the sequences are based on Walsh codes constructed with Hadamar matrices (Viterbi, 1995). The spreading sequences of the different users are orthogonal. However, the orthogonality is only guaranteed if synchronization is possible between the different spreading sequences. Such synchronization is simple when there is a common transmitter : it can then be used on the downlink of cellular systems as the same base station is transmitting to all mobiles of the cell. However, it is not possible on the uplink as mobiles cannot be synchronized to each other at the chip level because of variable propagation delays. Different users then use different pseudorandom spreading codes on the uplink (Viterbi, 1995). To illustrate the access of the CDMA type, we can make an analogy with a gathering of people from different nationalities where everyone is speaking at the same time but is using different languages. A newcomer who for example understands only French language would be able to extract only the French sentences stated of the ambient hubbub. Conversations of the others seem to him like a noise deprived of mean. However, if the general level of noise coming from the other conversations is too important, it will be more difficult or even impossible for our visitor to understand the speech of his compatriot.
2.3 Interference Analysis in a regular network In a cellular network mobiles do not receive a perfect signal from their serving base station. The signal is affected by noise and interference. The noise is mainly due to thermic agitation of electrons (thermal noise) and to imperfections of the first amplifier stage. It is denoted by Nth .
The general objective of power control is to ensure the same Eb /N0 ratio for all users. In order to minimize the power consumption the Eb /N0 target must be the lowest acceptable value. That is : Eb /N0 = (Eb /N0 )T
Figure 1: Interferences in the UpLink come from mobiles in the other cells and in the same cell.
Interference is mainly due to the reuse of frequencies in several cells and is called co-channel interference. Other types of interference are negligible compared to the co-channel interference. In CDMA networks the same frequency is used for all terminals in all cells. The level of interference is then high compared to TDMA or FDMA networks. Due to the limitation of the text length, we develop the impact of the interference on the uplink (terminal to network). The same phenomenons are observed on the downlink though there is some differences due to the possibility to have orthogonal codes between transmissions to different users of the same cell (Lagrange, 2000). A user terminal T is transmitting on frequency f0 to its serving base station B in one cell. All terminals in the same cell are transmitting on f0 to B and generate internal interference. Furthermore f0 is also used by all terminals connected to other base stations. Such transmissions generate external interference (for T ). Let Iint be the internal interference and Iext be the external interference (see fig 1). The C/I ratio may be written as : C/Itot = C/(Iint + Iext + Nth )
2.4
(4)
Power control
In a CDMA system power control is a very important issue because all the users of the network use the same frequency band at the same time.
(5)
In order to reach the (Eb /N0 )T , each mobile must adapt its transmission power. As N0 is the same for all mobiles in the same cell, reaching an Eb /N0 target is equivalent to reaching a common signal target denoted as Ctg . The more mobile there are, the higher N0 is and hence the higher Ctg is. The maximum capacity is obtained when all mobiles are received at the same power level at the base station. However, that level is not the same in all base stations. Determining the level target for each cell is a complex task in an operational network. Iterative algorithms that try to approach the optimal solutions are used. In a simple regular network it is possible to analytically determine that target (see (Zander, 1992) for more details). Such an approach is used in this contribution but is not detailed for the sake of simplicity.
2.5 Notion of pole capacity If only one cell is considered and if the thermal noise is negligible then with a perfect power control the C/Itot is given by: C/Itot =
Ctg = 1/(M − 1) (M − 1)Ctg
(6)
where M is the number of mobiles in the considered cell. Equation 6 and constraint 3 demonstrate that the maximum number of mobiles able to transmit in one cell is limited. Even if mobiles were able to transmit at very high power it is never possible to have more than β1 + 1 active mobiles in one cell. The pole capacity is then defined as the maximum number of mobiles per cell in a network with infinite power mobiles. An upper bound of the pole capacity is β1 + 1 but determining it is not simple when external interference is taken into account.
2.6 Variation of the coverage according to the load The coverage in a CDMA system is directly related to the load of the network. The load is defined as the number of active users. The more the number of mobiles in the cell increases, the more they must increase their emission power. However, each mobile is characterized by a
maximum transmission power. Consequently, mobiles that are located at the edges of the cell are no longer able to reach the base station (the required power would be above the maximum value). This phenomenon is known as cell breathing : coverage decreases as the load increases. The exact coverage depends on several parameters like the data rate allocated to each user, the level of noise but especially the load on the cell. In a simple regular network with perfect power control, the coverage can be calculated on the uplink and downlink.
3
SIMULATION TOOL OBJECTIVES
At TELECOM Bretagne (Ecole Nationale Superieure des Telecommunications de Bretagne) cellular network fundamentals are given in first year of graduation studies (MSc level). The second year is rather dedicated to more advanced systems like 3G and 4G wireless networks. In this context, spread spectrum concept and CDMA is taught. As it was introduced in part 2 there is a lot of interaction in cellular networks due to the impact of the interference. Understanding how a network ”lives” is not simple. Sometimes students are confused by the technical details and do not understand the basic physical phenomena. It is then necessary to have labs where the student can practice. As network UMTS devices are very expensive, simulation is the only way for laboratories.
3.1
Simulation Tool Overview
Indeed, major simulation tools like OPNET (OPNET, 2008) or COMNET (COMNET, 2008) are more protocol oriented and require a lot of time to be used correctly. Furthermore the multi-cell aspect is generally not included. Other planning tools such as ATOLL (FORSK, ) or PLANET (MARCONI, 2008) are more adapted to predict the coverage in a given environment. They use sophisticated digital elevation models to predict coverage and evaluate the quality of service delivered in a zone. The behaviour of a network for different loads is precisely modelled and may be displayed. However, a huge number of parameters have to be manipulated. When some variations in the coverage are apparent, it is very difficult to identify the reason for them. For example, the coverage level may be deeply impacted by some specificities of the propagation models rather than the basic physical CDMA characteristics. There is then a need for a user-friendly simulation software of a CDMA network that reflects the
behaviour of a CDMA wireless network.
3.2 VICTOR objectives The objective at TELECOM Bretagne was to have a tool that every student could launch and use within 5 minutes. Simplicity was the first objective. The simulation is thus not event-oriented but is closer to a Monte-Carlo approach. The developed software is based on a model which will be described in the following and the simulator is called VICTOR (Visualisation Interactive du ConTrOle de puissance dans un Reseau regulier) : Interactive Visualization of power control in a regular network.
4 MODEL PRESENTATION 4.1 The network model A regular hexagonal network with omnidirectional base stations is considered in VICTOR. The number of cells is set to 7 : one central cell is surrounded by six neighboring cells. Terminals are randomly spread over the 7 hexagonal cells. They are assumed to be fixed. However, they are called mobiles, as it is usually done in cellular networks. The radius of the cells may be changed by the user but the default value is 1 km. A regular propagation is considered also in VICTOR. The effect of obstacles is not simulated in details. Irregularities in the propagation are modelled by a random variable. Such an approach is very classical in much research work (see (Gilhousen et al., 1991) for instance). The user has access to a large number of parameters (propagation law, spread spectrum factor, noise figure,... ). However, predefined values that correspond to a typical coherent system are set by default.
4.2 Main functions of the software VICTOR propose two possibilities to fix its configuration parameters: i) at the beginning of the simulation, ii) at any time in the simulation. Once the parameters are fixed, the user can very easily change the number of mobiles in the network through the slider. For a given number of mobiles, VICTOR calculates the target level of the reception power in the downlink and in the uplink. It derives the required power level for each mobile on the uplink and for each base station on the downlink. In some cases, it is not possible to serve all mobiles. Mobiles that cannot be served are called inactive mobiles : on the uplink the transmission power
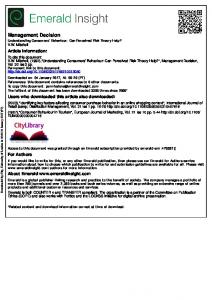
Choose uplink or downlink
Parameters of the clicked base Change the number of mobiles Figure 2: All mobiles are covered in the network: 10 mobiles in the central cell and 70 mobiles in the whole network.
of inactive mobiles is set to 0. On the downlink, no power is dedicated to inactive mobiles. The communication of such mobiles would be cut or not established in an operational network. Once the transmission powers of the mobiles and the base stations are defined, VICTOR computes the internal and external interferences for each mobile and for each base station, the path loss and many other fields. All the computation is done both on the uplink and the downlink. The user chooses either the downlink display or the uplink display. He or she can very easily switch from one view to another one thanks to a radio button .
5
OVERVIEW OF THE SIMULATOR
VICTOR is programmed in Java language and can run on any operating system. There is also an applet version of VICTOR which can be used from any browser (http://formations.telecombretagne.eu/ressources/rsm). The software is approximately 10 000 lines. The main principle window of VICTOR is divided in 4 parts (see fig. 2). The network is represented by the cells, the different base stations and mobiles. In
the right of the window, some gauge indicators are disposed : i) in the uplink case, the two gauges represent the target power and the total interference (internal, external and thermal noise) of the base station of the central cell; ii) in the downlink case, the two gauges indicate the target power and the total interference for a test mobile. In addition to the two gauges, there are two indicators of the number of mobiles and the number of satisfied mobiles (well served mobiles) on both the central cell and the network. VICTOR offers the possibility to select the visualization of the network either on the uplink or on the downlink by a radio operator button. The position of the mobiles in the different cells can be changed by carrying out a new random choice (while pressing on the new Snapshot button). Finally, the user may see the information such as the received power, the internal interference,... by clicking on a mobile or a base station. Let us consider the case of 10 mobiles in each cell of the network (see fig. 2). In the central cell, the interference level is weak (-103 dBm) and the target power level (-116 dBm) is low enough to serve all the mobiles. Consequently, all the mobiles are covered in the central cell (10 mobiles) and in the whole network (70 mobiles). Fig. 2 shows all the information of the base station on the uplink such as the internal
interference, the external interference and so on. Let us now consider 30 mobiles in each cell (see fig. 3). Mobiles that do not have enough power to reach the base station are barred with a cross. As it is depicted in the latter figure, the number of covered mobiles (110 mobiles) is lower than the number of mobiles in the network (210 mobiles). For example, if the user looks at the central cell there are only 16 active mobiles among the 30 mobiles because of the high interference level (-87 dBm). Consequently, the user deduces that the cell has attained its pole capacity (16 mobiles). Fig. 3. shows all the information of the mobile station on the uplink such as the transmission power, the path loss... All these examples are given for uplink. However, VICTOR can also be used to visualize the pole capacity notion on the downlink.
Figure 3: Pole capacity on the uplink: 16 mobiles in the central cell and 110 in the network.
6
LABORATORY EXERCISES
In lectures, the basic concept of a CDMA network and related issues and challenges are introduced. These concepts are reinforced when the students set up the laboratory exercises. In the following we present several labs. Laboratory 1: The cell breathing phenomenon on uplink In this introductory lab, students are first asked to analytically determine the maximum radius of a cell on the uplink without any load. By considering only thermal noise, they calculate the minimum level received power Cmin by combining equations 3 and 4.
Using propagation equations with Cmin and the mobile transmission power they then find the range of mobile terminals. The obtained value is much higher than the radius of a hexagonal cell. This shows the coverage for a non loaded network is very good. Students then use VICTOR and look at the number of mobiles that can reach the base station for different loads. They realize the total interference level increases with the number of mobiles in the network. They are asked to determine the maximum number of mobiles served. They are then asked to increase the transmission power of mobiles by typically 3 dB to check that the capacity increases slightly. They repeat the same process (power increase). Above a certain power they note the capacity does not increase anymore : the pole capacity has been reached. They note this maximum is the same for different snapshots. In completing this practical, students develop a sound knowledge of the impact of interference in a CDMA system and an understanding of the pole capacity. Laboratory 2: The cell breathing phenomenon on downlink As in lab 1, students are asked initially to calculate the pole capacity on the downlink case and to check it with VICTOR. They notice that beyond a certain power of the base station the number of covered mobiles does not exceed the already theoretically calculated value. The pole capacity has been reached. In completing this practical, students develop a better understanding about the pole capacity on the downlink case. Laboratory 3: Impact of the user rate CDMA is interesting in multimedia cellular networks because it provides flexibility. A network is able to accommodate different user rates R. As the bandwidth W remains the same, increasing the user rate decreases the spreading factor. Hence, higher rates require higher power. In this lab, students are asked to increase the user rate and to determine the impact on the capacity both on the uplink and the downlink. Let us note that VICTOR is not able to mix different user rates in the same simulation like a UMTS network. However, it is possible to change that parameter and to see the impact of a new value with exactly the same position of mobiles. Students can then really understand the impact of high rates and the corresponding cost in term of power budget. Laboratory 4: TDMA vs CDMA Due to multipath, the different transmissions of a base station are not perfectly orthogonal. This is generally modeled by integrating in the interference calculation a non orthogonality factor α. This factor may vary from one mobile to another and depends on its position in the network. However, for the sake of
7 7.1
ASSESSMENT Evaluation by students
VICTOR was used during autumn semester in 20062007 and 2007-2008. In 2006-2007, there were 32 students who were registered for the course unit. As it was a trial, they did only labs 1 and 2 after the theoretical courses. VICTOR software was evaluated anonymously by students. The aim of the evaluation is to check VICTOR is really easy to use and to analyze the perception of students on VICTOR’s benefits. Students were asked 5 questions as shown in figure 4. One additional open question asks them to give their opinion on VICTOR. More than 95% find the software is easy
80
How long to become familiar with Victor
Ease of use of Victor 80 70 % of responses
% of responses
70 60 50 40 30 20
60 50 40 30 20 10
10
0
0
very easy to difficult very to use difficult easy to use to use use
less then 5 between 5 more than 10 minutes minutes and 10 minutes
% of responses
70 60 50 40 30 20 10 0 Victor is a good Victor is Victor is tool to understand unncessary unncessary the behavior of a because the because the CDMA network concepts studied concepts studied are very simple are too complicated
90
80
80
70
70
% of responses
90
60 50 40 30 20 10
Victor is a good tool but it is necessary to work on the lessons before
I think I have a better understanding of CDMA networks thanks to Victor
Benefits of Victor (score 0 to 3)
% of responses
simplicity the same value is considered for all mobiles in VICTOR. Students fix the number of mobiles per cell to the pole capacity of the uplink and they notice that all mobiles are covered on the downlink for α = 0.5. Indeed, the internal interference value on the downlink is much lower than on the uplink thanks to orthogonal codes on the downlink. Students are shown that for α equals to 0, the internal interference is eliminated. Consequently, the maximum capacity increases because mobiles receive less internal interference and need less power. For α = 1, the capacity is lower due to the rising internal interference in the cell. In this case, the base station must redistribute equitably its power between the mobiles. In the following, a complementary lab describing the behaviour of a CDMA system compared to a TDMA system is presented. Let us consider the case of a strong non-orthogonality on the downlink. Two strategies are proposed: i) the base station transmits simultaneously two user flows on two different codes; ii) the base station transmits one flow, then the other, by reducing the spreading factor and by increasing the instantaneous rate (case of the TDMA). Students are asked then to consider the two strategies. Students show that in the first strategy there is internal interference but in the second strategy internal interference is eliminated. Consequently, the network performance becomes much better. Students may then conclude that TDMA is better on the downlink of a given base station when there are no strict delay constraints. In completing this practical, students gain experience in modelling orthogonality on the downlink and received a good introduction to the basis of 3.5 systems like HSDPA (High Speed Data Packet Access) that rely on a time shared downlink channel.
60 50 40 30 20 10
0
0 0
1
2
3
No
Yes
Figure 4: Subjective evaluation of VICTOR by students.
or very easy to use. They do not spend much time to become familiar with VICTOR as more than 65% needed less than 5 minutes to that. Some students who have an above average ability to follow theoretical courses found VICTOR unnecessary since the concepts covered were simple. However, more than 95% found it useful. Note that 61% consider VICTOR is useful but does not exempt them from working on the theoretical lessons. Students were asked to write one sentence for their evaluation of VICTOR. Here are a few answers: • VICTOR is a good way to have practical applications of the theoretical courses, • VICTOR facilitates understanding of the course, • VICTOR is a simple software that really helps to fix the basic concepts of CDMA networks, • I won’t say that I learnt new things. However, I have understood why some elements of the course are useful and thanks to VICTOR I asked myself good questions. It is then a very useful help to understand the course.
Score before the labs
Sore after the labs
10 9 8 7 6 5 4 3 2 1 0
Figure 5: Scores of all students before and after the labs (sorted in ascending order for the first test.)
7.2
Objective evaluation with a quiz
Before the labs, students were asked to make a technical multiple-choice test comprising 12 questions. The same test was used after the labs to analyze the benefits of the labs. The individual score of each student is given in figure 5. Most students (78%) got a better or an equal score after the labs. The average score was 6/10 before the labs and 7.3 after the labs. Strangely, 6 students got a lower score after the labs. This is due to two different factors : firstly, some students answered randomly to some questions. Secondly, the questions were short. Hence, a few questions were partly ambiguous. Several students thought they include traps. Instead of giving the simple direct answer, they misinterpreted the question and gave a wrong answer though they had well understood the concept. One can notice that the students who had a low score at the first test improved their score greatly in the second test. This should suggest that these students have the ability to understand the concepts but have difficulties in classical lessons. For such students lab work is very important.
8
CONCLUSION
VICTOR can be used either for class demonstrations, in enhancement of the traditional lecture environment, or in the computer laboratory for hands-on practical work in a UMTS networking course. It is easy to use and provides a suitable interface that helps users to gain better understanding of UMTS network. The possibility of VICTOR enhancement are numerous. However, the challenge is to keep a very simple man-machine interface to have software which is very easy to use. Students may focus their attention on the radio and network aspects and not on how to use the software.
ACKNOWLEDGEMENTS The authors want to thank students of TELECOM Bretagne who also contributed to the development of VICTOR software : Raymond Coulibaly, Souleymane Faye, Youness Oulbacha, Jihad Sarsi.
REFERENCES COMNET (2008). Comnet description. Technical report, http://www.comnet.at/website/output.php. FORSK. Atoll description. Technical report, http://www.forsk.com/htm/products/atoll overview.htm. Gilhousen, K., Jacobs, I., Padovani, R., Viterbi, A., Weaver, L., and Wheatley, C. (1991). On the capacity of a cellular cdma system. IEEE Transactions on Vehicular Technology, 40(2):303–311. Holma, H. and Toskala, A. (2004). WCDMA for UMTS, third Edition. Wiley and sons Ltd. Lagrange, X., editor (2000). Les reseaux Radiomobiles. Edition Hermes Science. Lagrange, X., editor (2005). Principes et Evolutions de l’UMTS. Edition Hermes Science. MARCONI (2008). Planet description. Technical report, http://www.marconi.com. OPNET (2008). Opnet description. Technical report, http://www.opnet.com/products/modeler/home1.html. Proakis, J. (2001). Digital Communications. Mc Graw Hill. Viterbi, A. (1995). CDMA, Principles of Spread Spectrum Communication. Addison-Wesley. Zander, J. (1992). Performance of optimum transmitter power control in cellular radio systems. IEEE Transactions on Vehicular Technology, 41:57–62.