Understanding the Continued Usage of Business e-learning Courses in HK Corporations Paul Yeung Ernest Jordan Macquarie Graduate School of Management, Macquarie University, Australia e-mail:
[email protected]
Abstract. Other research has investigated different aspects of e-leaming, e.g. comparing the effectiveness of e-learning with traditional classroom training and on the success of IT or computer skills training. This study focused on how to ensure that individuals continue their usage of business and management e-learning courses for self-development in Hong Kong Corporations. A theoretical framework was developed based on Venkatesh's model of System Usage, Bhattacherjee's Expectation-Confirmation Model and Seddon's re-specification of DeLone and McLean's Information System Success Model. The proposed model was calibrated with 212 valid samples from five corporations in Hong Kong and was validated with 15 questionnaires from a small e-commerce company of 50 staff at a different time. The data supported the model and the model had a moderate explanatory power (R2=37%) for continued usage. The structural model was not affected by different collection periods (first collection batch vs last collection batch), sample (calibration vs validation), gender (male vs female), position (manager vs non-manager), and computer usage experience (10 years or more vs less than 10 years). However, the model was different for groups of different ages (age 36 and above vs below 36) and educational levels (university graduates vs non-university graduates). Further research and the business implications for improving the continued usage of business e-leaming courses are discussed. Key words : e-leaming, user satisfaction, continued IT usage, technology acceptance, survey research, consumer behavior
Please use the following formatwhen citing this chapter: Yeung, P., Jordan, E., 2006, in International Federation for Information Processing, Volume 210, Education for the 2P' Centiuy-Impactof ICT and Digital Resources, eds. D. Kumar, andTumer,!., (Boston: Springer), pp. 245-254.
246
1
Paul Yeung and Ernest Jordan
Introduction
Corporations in Hong Kong have increased their emphasis on e-learning in the past five years. Because of its distinctive competitive advantages, such as cost-saving for arranging staff to learn as a group from various locations, and participants can learn at their own pace at anytime anywhere, e-leaming is a growing trend in the learning field. However, some corporations in Hong Kong face a problem of poor utilization of the e-leaming solution which is also a concern in US (e.g. [4] and [5]). Over the past two decades, a significant body of research has focused on identifying various factors that influence user acceptance behaviors. According to Bhattacherjee [2], the eventual success of a new technology depends not just on the initial adoption of the system but more on the users' continued usage of the IS. There has been research on the success of using IT or computer skills training (e.g. [6] and [7]). The objective of this study is to identify the factors affecting continued usage of business and management e-leaming courses at an individual level and to provide empirical validation of the proposed model. This study can provide practitioners with deeper insights on the factors that influence user satisfaction and how to encourage continued usage behaviors.
2 Key definition The evolving definition of e-leaming used in this paper is defined as the instructional content or learning experiences delivered or enabled by internet technology to enhance an individual's knowledge and performance. This definition is derived from the Commission on Technology and Adult Learning by the American Society for Training and Development and National Governors Association, US [8, p.7].
3 The context Most corporations in Hong Kong prescribed business e-learning courses for staff development activity. The employees are all adult. The usage of the e-leaming courses is voluntary, i.e. staff are not forced to complete any courses. The usage is also volitional, i.e. there is no barrier that would prevent the individual from leaming if he or she chooses to do so. The business and management e-learning course is different from the commonly researched IT/computer training e-learning courses as the participants have to learn through interaction in different scenarios. All users in this study have had experience on using e-learning courses for at least one month.
4 Theoretical background A significant body of research has focused on identifying various factors that influence user acceptance behaviors. In particular, the technology acceptance model
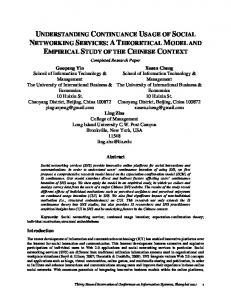
Understanding the continued usage of business e-leaming courses in HK corporations 247 (TAM), introduced by Davis and his colleagues [9] [10]. TAM has received considerable attention and has been established as a parsimonious and powerful model for explaining and predicting usage intentions and acceptance behaviors. TAM theorizes that an individual's actual system usage is determined by behavioral intention, which is jointly determined by perceived usefulness and perceived ease of use. Perceived usefulness is the extent to which a person believes that using the technology will enhance his or her job performance. Perceived ease of use is the extent to which a person believes that using the technology will be free of effort [9]. Behavioral intention is defined as the extent to which an individual intends to perform a specific behavior [10]. Bhattacherjee [2] argued that the eventual success of a new technology is more dependent on users' continued usage of the system rather than on their initial adoption. Bhattacherjee then developed a model based on an expectation-confirmed model and empirically tested it with acceptable results. The model is rooted in the expectancy-confirmation paradigm, which regards a user's continued usage decisions similar to a consumer's repeat purchase decisions. The model predicts users' intentions to continue usage of an IT system with three antecedent constructs: (1) user satisfaction; (2) extent of user confirmation; and (3) post-adoption expectations, represented as perceived usefulness. Recent findings on intrinsic motivation and self-efficacy in social psychology indicate that enjoyment plays important roles in determining a person's behavior. Davis et al [11] put enjoyment followed the construct of perceived ease to use. As staff has to sacrifice their personal time to learn at home, the user will look for more pleasure on using the e-leaming course based on the opportunity cost concept. Hence, it is proposed that enjoyment should be the precedent construct to perceived usefulness and perceived ease of use of the model and should have more coverage than the construct of confirmation as suggested by Bhattacherjee [2] in this case. According to DeLone and Mclean [12] and Seddon [3] on IS Success Model, the construct of system quality, information quality and service quality would affect user satisfaction. In combining the recent theoretical developments, the following framework is proposed to understand how individuals will continue to use the business and management e-leaming courses: System Quality
Information Quality
(+)
Service Quality
(+)
(+)
Enjoyment
/ \
(+)
(+) 1
(+)
Perce ivea
*/
Satisfaction
Perceived Usefulness
(+)
\ ^ '
(+)
1
, (+)
Continued Usage
i I
(+)
Moder rtors: Gend ;r. age, computer a and education levels
Fisure 1 - The proposed theoretical model
248
Paul Yeung and Ernest Jordan
It is proposed that enjoyment, like confirmation as defined by Bhattacherjee [2], will increase the perceived usefulness and ease of use of the system. Perceived ease of use will increase the perceived usefulness of the e-leaming course. The perceived usefulness will increase the user satisfaction and that will encourage the learner to use the e-leaming course again. The perceived usefulness, combining with system quality, information quality and service quality will increase the user satisfaction. The user satisfaction will lead to the continued usage of the e-leaming course.
5 Research method This research was a cross-sectional study that obtained information on variables in different contexts but at the same time. The data was collected over a short period (from Oct 2004 to Dec 2004). As it was a field experiment, there may be confounding and extraneous variables that obscured the effects of another. Hence, Stractural Equation Modeling (SEM) was adopted. The goal of the SEM analysis was to determine to what extent the theoretical model was supported by sample data.
6 Data collection method and pilot test of the questionnaire Questioimaire-based data-gathering technique was used. The items of the questionnaire were drawn from the literature. The questionnaire was also translated into Chinese to suit the needs of respondents who were not fluent in English. A pilot study of a group of 10 people was undertaken to ensure the items were adapted appropriately to the study context. The purpose was to find out potential problems and misunderstandings of instmctions and question items. After the pilot test, some adjustments were necessarily made to represent the ideas clearly. To control the variation of different types of e-leaming courseware, such as from various vendors on different subjects such as language, computer skills and business, the research intended to narrow down the variation by choosing one vendor and one type of business courseware so that on instructional design, navigation and the look and feel, the courseware were standardized for comparison. The target population was a group of Hong Kong people using the business and management e-learaing courses provided by a market leader in Hong Kong. The population was employees from 19 corporations. Stratified sampling was used to identify the number of sampling corporations (see Table 2). The largest corporations in each sector were invited to participate in this research. The Human Resources Department of that invited corporation distributed the questiotmaires to all the users. The participant was required to complete the questionnaire and send it directly to the researcher using a pre-stamped envelope. The six participating organizations include one multinational bank in Hong Kong, one public utility corporation, one local bank, one container service company and one local technology firm. The questionnaires collected from the sixth company, a small local e-commerce organization, were used to validate the calibrated model.
Understanding the continued usage of business e-learning courses in HK corporations 249
Type of Organization No. in Population No. of Sample Multinational corporations 1 3 Public utility companies 1 3 Large private organization 2 6 Small local enterprises 2 7 Total 6 19 Table 2 - The selection of the stratified samples A total of 700 questiormaires were sent to the five corporations' human resources department for onward delivery to their staff. After collecting only 176 questionnaires as at 30 November 2004, the key coordinators of the five respective organizations were asked to remind their staff to return the questiormaire. An extra 41 questiormaires were later collected as at 31 December 2004. The response rate was 31.0%. As the response rate was higher than the 20% response rate as identified by Yu and Cooper [13], non-response bias was not a serious problem in this research. Of the collected 217 completed questiormaires, five questiormaires were found to be incomplete in some items and were discarded. Only 212 questionnaires were used for data analysis. The response rate became 30.3% that was still acceptable. According to the sample size requirement stated by Levine et al [14, p.443], it was safe to conclude that there were sufficient number of respondents to support the findings at 95% confidence level and at 7% sampling error. The results from the first collected batch were compared to the second collected batch. It was found that there was no statistically significant difference.To overcome the potential bias and sterility of a single-method approach, this research conducted a data triangulation investigation in which a different set of data was collected at different times and strata of the study. The separate data was collected in Jan 2005 from an e-commerce company (the sixth company). 15 completed questionnaires were collected from the sixth company that had only 50 users for validation purposes. The response rate was 30% and was acceptable. It was found that there was no statistically significant difference between the calibration and validation sample.
7 Examination of tlie data According to Joreskog [15], observations on a 7-category Likert scale represent responses to a set of ordered categories. This study followed the recommendation of Joreskog [15] to examine the data by LISREL.
8 Instrument validation A confirmatory factor analyses was performed on the measurement model. The fit of the measurement model was estimated with different indices. The goodness-
250
Paul Yeung and Ernest Jordan
of-fit (GFI) and the adjusted goodness-of-fit (AGFI) were both 1.00. The values of the normalized fit index (NFI) was 0.97. The values of the non-normalized fit index (NNFI) and comparative fit index (CFI) were respectively 0.98 and 0.99 which indicated good model fit (Chau, [16]). The observed values for root mean square residual (RMSR) and root mean square error of approximation (RMSEA) were respectively 0.074 and 0.057, which were within the recommended cutoff values of 0.10 for RMSR and 0.08 for RMSEA for goodness-of-fit (Chau, [16]). The psychometric properties of the constracts and items were summarised in Tables 3 and 4. The convergent validity of the instrument was assessed by the composite reliability and average variance extracted. The composite reliability estimate for each construct ranged from 0.83 to 1.00, suggesting an acceptable level of reliability (Hair, et al., [17]). The average variance extracted (AVE), ranging from 0.66 to 1.00, were all above the recommended 0.50 level (Hair et al., [17]). According to Fomell [18], factor loadings in excess of 0.70 could be considered excellent for convergent validity. All the factor loadings were greater than 0.70. Following Hair et al's [17] guideline, all squared multiple correlations should be above the 0.40 threshold for convergent validity. In Table 3, the squared multiple correlations of individual items were high, ranging from 0.52 to 1.00. In Table 4, the average variance extracted for each construct was greater than the squared correlations between it and all other constructs. It indicated good discriminant validity (Fomell and Larcker, [19]). USE
SATIS
USE
0.85
SATIS
0.31
1.00
PU
PEU
ENJ
SYSQ
IQ
PU
0.81
0.10
0.97
PEU
0.44
0.75
0.28
0.88
ENJ
0.36
0.56
0.24
0.48
0.95
SYSQ
0.12
0.24
0.06
0.11
0.23
0.83
IQ
0.23
0.42
0.12
0.23
0.48
0.24
0.86
SQ
0.10
0.11
0.06
0.13
0,27
0.13
0.36
Table 4 - Construct correlation and discriminant validity
SQ
0.95
Understanding the continued usage of business e-Iearning courses in HK corporations 251
Factor Loading
Construct
USEl USE2 USE3 SATIS 1 SATIS2 SATIS3 PUl PU2 PU3 PU4 PEUl PEU2 PEU3
ENJl ENJ2 ENJ3 SysQl SysQ2 IQl IQ3 IQ4 SQ7 SQ9 SQIO AVE
R^ = 0.37 Reliability = 0.85 Continued Usage I frequently use my company's e-leaming solution I have completely integrated the e-learning solution in my personal development activity I fully use the capabilities of the e-leaming solution Satisfaction R^ = 0.S3 Reliability = 1.00 The e-learning solution is efficient. The e-learning solution is effective. I am satisfied with the e-leaming solution. Perceived Usefulness R^ = 0.24 Reliability = 0.97 Using e-leaming improves my job performance Using e-learning in my job increases my productivity Using e-learning enhances my effectiveness in my job I find e-learning to be useful in my job Perceived Ease of Use R^ = 0.47 Reliability = 0.88 I find e-learning to be easy to use I find it easy to get e-leaming to do what I want it to do. My intention to use e-leaming is clear and understandable Enjoyment Reliability = 0.95 I have fun using the e-leaming courses Using the e-leaming courses is pleasant I find using the e-learning courses to be enjoyable System Quality Reliability = 0.83 The network connection to internet has been satisfactory while accessing The rate at which the information displayed is enough Information Quality Reliability = 0.86 I understand the terms used. The content relates well to my learning needs. The content is accurate Service Quality Reliability = 0.95 I found my IT/HR department to provide consistently good solutions My IT/HR department provides service as I require it. My IT/HR department delivers support in a timely manner. = Average Variance Extracted
Squared Multiple Correlations AVE* = 0.66 0.72 0.52 0.78 0.61 0.92 AVE = 1.00 0.99 1.00 1.00 AVE = 0.88 0.95 0.97 0.94 0.88 AVE = 0.70 0.77 0.82 0.92 AVE = 0.87 0.91 1.00 0.88 AVE = 0.72 0.92
0.84 0.99 1.00 1.00 0.90 0.94 0.88 0.78 0.59 0.67 0.85
0.83 1.00 0.77 0.84
0.75 AVE = 0.67 0.76 0.84 0.85 AVE = 0.85 0,85
0.72
0.96 0.95
0.92 0.91
Table 3 -Summary of Psychometric Properties of Construct and Items
0.57 0.58 0.70 0.72
Paul Yeung and Ernest Jordan
252
9 Empirical results According to Joreskog [6], robust diagonal weighted least squares (DWLS) estimation method was recommended to estimate the coefficients of the associations among the variables. All the hypothesized paths were significant. In summary, the proposed model accounted for 37% of the variance in users' continuance usage, 54% of the variance in user satisfaction, 24% of the variance in perceived usefulness and 47% of the variance in perceived ease of use. System Quality
Information Quality
\ o . 17* (t^l.97)
0.42***(t=4,51)
Service Quality •^-0,17*(t=-2.02)
0.80***(t=13.85)
Enjoyment \ v 0.24*(t=2.44) Perceived Usefulness i2^ = 0.24
X " jr Satisfaction -0.17**(t^-2.95) ^ = 0.54
0 3V***(f=6.22)
"r Continued Usage K^ = 0.37
(t=9.29) 0 37***(t= 3.49)
0.65 "** (1^7.33)
Perceived Ease of Use if = 0 47 * ** ***
for p