Understanding the Dynamics of Complex Lisp Programs Martin Loetzsch (AI-Lab, Vrije Universiteit Brussel, Belgium
[email protected]) Joris Bleys (AI-Lab, Vrije Universiteit Brussel, Belgium
[email protected]) Pieter Wellens (AI-Lab, Vrije Universiteit Brussel, Belgium
[email protected])
Abstract: Recent advances in web technologies and the availability of robust Lisp libraries supporting them have made it possible to think of new ways of understanding and debugging large applications. In this paper, we will discuss two basic ideas for assessing and verifying the behaviour of Lisp programs. First, we propose to use a web browser for graphically displaying debug output in a similar but more versatile way as the Lisp listener is normally used to print output traces. And second, we propose a method for creating HTML visualisations of complex data and control structures that don’t trade in level of detail for readability. We will introduce GTFL (a Graphical Terminal For Lisp), which we have implemented based on these two ideas, and discuss its applications.
1
Introduction
When the behaviour of a system is driven by unpredictable external data or when it emerges from the interplay of many different processes and representations, it is very hard to keep track of the underlying complex dynamics exhibited by the system. Even when the behaviour is as expected it might be far from trivial to understand or show why this is the case, or for example how it could be further refined. Evidently, when the behaviour is not the desired one, it is usually very hard to track down the parts of the systems that require modification to yield more desired dynamics. Adding to the challenge is the fact that often some subsystems can’t be tested in isolation because they are embedded in a recurrent network of other processes and consequently the functioning of the system can only be investigated as a whole. These sorts of difficulties in understanding the underlying dynamics of complex code are a common problem in many areas of computer science such as robotics, artificial intelligence and distributed systems. Although everybody has their own favourite style of debugging we have observed that most Lisp hackers use a combination of four major techniques for
analysing the behaviour of their programs. The first one, which we call the tracing approach, consists of printing traces to the Lisp listener either by directly adding print statements to the code or by using built-in trace facilities or other custom mechanisms. The advantages of this technique are that (1) it is very easy to do (and in fact this is what almost everybody who learns to program starts with, for a review see [McCauley et al. 2008]) and (2) it allows to monitor program execution at almost any level of detail (from very high-level dynamics only to near-complete information). When the level of detail is high however, the output rapidly becomes unmanageable. Furthermore, plain text in a Lisp listener is not easy to read and can only be presented linearly which makes it impractical for getting an overview of, or a ‘feeling’ for, the dynamics of the system. And finally, changing the level of detail requires to comment out print statements in the code (bad style) or to switch on and off tracing facilities. A second method is to retrospectively analyse the state of a system by inspecting Lisp objects – either using inspector tools of Lisp environments or by directly calling chains of accessor functions on an object. Inspection has the advantage that it does not require to change or write any code and the complete state of the object can be analysed. But inspection is only applicable to the final results of a particular algorithm or program (except when using breakpoints). In general, changes of data structures can’t be easily observed using inspection. Additionally, it requires to have access to the problematic instance in question and often it is unclear which one of the thousands of objects to inspect. Finally, in order to query details of deeply hierarchical data structures, a programmer needs to perform a high number of manual steps, which prevents inspection to be useful in many cases. Third, many Lisp implementations and development environments provide mechanisms for manually stepping through code either by using the built in step facilities or by invoking the stepper directly from the code. Control structures can be traversed and function parameters, return values and local variables can usually be further investigated with inspectors. This certainly is very helpful for finding logical mistakes in small pieces of code such as sign errors, wrong loop exit conditions and so forth, but in order to make use of stepping one has to know which part of the code to look at. Stepping through a complete application just for exploring its dynamics would take hours and is thus impracticable. A last technique is to create visualisations, either within a custom GUI or by using specialised graphics libraries (e.g. gnuplot). Visualisations are great to get an intuition of an algorithm’s dynamics because our mind understands graphical representations much better than text output, especially for numerical data [Kosslyn 2006]. That’s why in areas such as robotics it is exceptional to even write programs without having graphical means to verify that the system behaves as expected (ideally even for each intermediate step). Visualisations are
costly, because it takes time to implement them, but they often pay off in the long run when they can become an invaluable eye into the system’s internals. A clear disadvantage is that visual representations only allow for a low to medium level of detail: complex data structures have to be transformed into two-dimensional (or sometimes 3D) representations, involving constraints such as available window size and a required visual clarity so that the representation remains readable. Furthermore, despite many recent developments in cross-platform GUI APIs, there is none that really looks good and that easily works in all major CLs. And unless the Lisp program in question already has a graphical user interface, there is a lot of overhead in dealing with windows, menus and other UI elements, event handling and the interaction with the actual code to monitor. This is usually too much overhead when the goal is to ‘just draw something’. Additionally, Lisp is often used for symbolic programming, which involves textual and hierarchical data structures, which in turn are hard to visualise. Although virtually every graphic library has means to display text on the screen, the responsibility for arranging text blocks (estimating widths an heights of text areas depending on available space, avoiding overlap, reflowing multi-line text) is usually in the hand of the programmer. We propose a novel technique for analysing and debugging code on the system level, which combines many of the main advantages of the previously introduced techniques, while at the same time removing some of their respective disadvantages.
2
GTFL - A Graphical Terminal for Lisp
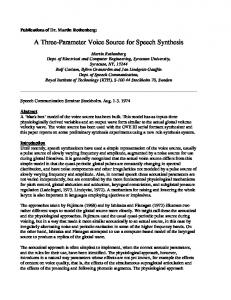
We propose the GTFL (a Graphical Terminal for Lisp) library as a tool aimed at Lisp programmers that want to understand the dynamics of their code, especially when the program is too complex to debug by printing text traces to the listener or by using inspection and stepping tools. GTFL runs on all major CL implementations, is free (BSD-Style license) and its documentation together with the source code can be found at [Loetzsch 2009]. GTFL is a terminal in the sense that content is pushed by a Lisp program to a client and appears there in the same order as it was sent. What might be surprising – but as will be shown has great consequences – the client is a HTML page running in a web browser (see Figure 1). GTFL uses the Hunchentoot web server [Weitz 2006] to deliver the client page and HT-AJAX [Marshak 2007] to exchange requests and content between the client and the Lisp environment. After installing GTFL (either by downloading it from [Loetzsch 2009] or via asdf-install) and loading the library with asdf, the internal web server needs to be started with: (start-gtfl)
Figure 1: GTFL in action. A Lisp environment (left) has GTFL loaded and sends output to the client. The client HTML page (right) shows the output as it is sent.
The client HTML page is now accessible at http://localhost:8000 (a different address and port can be specified as well). Since GTFL uses quite advanced web technologies, we recommend to use a recent version of Safari, Firefox or Chrome. The page is initially empty except for a small “reset” button. Sending output to the client is quite simple (see also examples in Figure 1): (gtfl-out (:p "hello " (:span :style "color:red;" "world!")) (:p "a " (:b "second") " paragraph")) The output immediately appears on the client page and looks like this: hello world! a second paragraph The macro gtfl-out takes numbers of s-expressions as arguments and renders them into actual HTML code using CL-WHO [Weitz 2003]. There are many other Lisp libraries providing this functionality and in general web related Lisp tools give users the freedom to use any of them, but we had to select one because GTFL also provides tools for creating complex HTML constructs. CL-WHO was our first choice because it seems to be one of the wider known ones and because it doesn’t create intermediate structures at run-time, making it very efficient. Behind the scenes, GTFL pushes the rendered HTML code sent by gtfl-out on an internal ‘requests’ list. In the client page, a Javascript based event loop uses Ajax calls to query that list on the Lisp side every 200 ms. Whenever there is something new to display, it is sent to the client page as a response to such an Ajax call.
With this basic ‘terminal’ functionality, GTFL can already be used for debugging with the tracing technique described above. The user is only required to change the relevant print statements in the code to gtfl-out calls. The major advantage is that text can be displayed in different colors, a multitude of font styles and sizes and with backgrounds or borders, which all help in making the output much more readable than plain text. Furthermore, GTFL is graphical because HTML is. In addition to the possibilities of basic font formatting mentioned above, HTML tables and other block elements can be used to structure data and to layout representations. Contemporary HTML rendering engines are extremely good in distributing the available browser window width among recursively nested child elements (and in reflowing the layout when the window size changes or when more data is added to the page). A trivial example for this is: (defparameter *text* "content that automatically adapts its width according to the available space") (gtfl-out (:table :cellspacing "5" :cellpadding "5" (:tr (:td :style "background-color:yellow" (princ *text*)) (:td :style "border:1px solid black" (princ *text*))))) HTML style attributes are used to display *text* in different graphical styles two times next to each other. More importantly, the HTML renderer removes the burden of deciding how wide to draw the text blocks from the programmer:
Exploiting this versatility, GTFL contains functionality for drawing trees in HTML. This is again a trivial example (for examples of ‘real’ trees see Figures 1 and 2): (gtfl-out (draw-node-with-children (who-lambda (:div :style "border:1px solid #000" (:b (princ *text*)))) (list (who-lambda (:div :style "border:1px dotted blue"
(:i (princ *text*)))) (who-lambda (:div :style "margin-top:10px;" (princ *text*)))))) The result is this:
The function draw-node-with-children requires an anonymous function for creating the content of a node and a list of such functions for drawing the children. It creates a table that contains the node, horizontal and vertical lines to the children, and the children themselves. In order to draw a complete tree, the anonymous functions that draw the children use draw-node-with-children again to draw their respective children, and so on. Consequently, using this functionality requires writing a function that recursively creates the tree visualisation while traversing the structure to be displayed. The web browser then takes care of fitting the tree in the available space and of adjusting the width of the nodes accordingly. When the basic graphical capabilities of HTML are not sufficient for certain visualisation purposes, SVG graphics or Flash animations can of course be also sent to the GTFL client page. These features combined make GTFL a powerful tool for visualising internals of a program. The main advantage over using a real GUI is that programmers neither have to deal with windows, menus, event handling etc. nor do they have to worry about the size and position of elements on the screen. But we believe the key feature of GTFL to be the way in which complex data and control structures can be displayed: the level of detail of what is visualised is not restricted by the size of the web browser window. The trick is to create simplified visual representations of data that expand into a detailed version when the user clicks on them and that collapse to their original state when clicked a second time. A (minimal) example: (gtfl-out (:div :style "border:1px solid black;display:inline-block" (make-expandable/collapsable-element "id-1" "all-id-1"
(who2s (:div (make-expand/collapse-link "id-1" t nil "expand") (:br) "overview version")) (who2s (:div (make-expand/collapse-link "id-1" nil nil "collapse") (:br) (:h3 "much more detailed version")))))) A box such as on the left below appears. When the ’expand’ button is clicked, a mode detailed version of the representation is shown instead:
→ The function make-expandable/collapsable-element that GTFL provides for this kind of interactivity takes both the collapsed and expanded version as arguments and stores them in a hash-table (in order to avoid computing HTML for elements that never get expanded, closures can be used as well). The collapsed version is initially sent to the client, and when the user clicks on the element the expanded version is requested from the Lisp side using Ajax. This principle can be applied recursively: a first visualisation shows the global dynamics of an algorithm, and by further and further expanding parts of that representation, more and more details are revealed. Using such expandable representations is in a sense an advanced variant of the above-mentioned inspection approach: already meaningful visual traces are sent to the terminal and help getting an overview of what is going on in the system. When something interesting or unexpected happens, the user can inspect more details of the inner workings by progressively clicking through the created representations. Since the initial representations of objects already contain some information about it, it becomes much easier to decide which object to inspect and there are no issues of accessing instances of intermediate processing results. This technique of course requires some additional effort by the programmer. For all relevant data and control structures, functions need to be written that turn them into expandable HTML representations. But once such a set of visualisations exists, debugging an application becomes less demanding.
Finally, GTFL provides functionality for defining client side Javascript and CSS code fragments, for replacing and appending the content of existing HTML elements, for resetting the client and for creating dynamically resizing visualisations of s-expressions in HTML. These mechanisms are explained in detail at [Loetzsch 2009]. In the next section we show how we applied GTFL in real-life applications.
3
Applications
GTFL won’t be of great help for finding out why a program crashes – it is instead useful for tracking down conceptual errors or for verifying the behaviour of a system. For that purpose, the system is extensively applied in the VUB AILab and the Sony Computer Science Lab in Paris for doing research in linguistics, robotics and emergent systems. Part of this work involves programming fairly complex multi-agent simulations in Lisp, including mechanism for engaging in social interactions, perception and conceptualisation of the world, production and interpretation of utterances, diagnosis and repair of problems in cognitive processing, and much more. One aspect of this research is the Fluid Construction Grammar (FCG) framework [Steels and de Beule 2006, de Beule and Steels 2006]. FCG is a unificationbased grammar formalism which uses feature structures for representing linguistic knowledge, and it can apply the same linguistic rules in both parsing and production. Constructing or interpreting utterances requires a successful chain of applicable rules, which involves a large search process. The rules themselves can become exceedingly complex and even seasoned FCG users are bound to make mistakes in writing them. Combined with the fact that a unification-based formalism is not very forgiving when encountering small errors in the linguistic rules, one typo in a rule can cause the complete search to divert and explode. Consequently, when the FCG engine fails to produce a desired result, there are a multitude of potential reasons for that. In earlier versions of FCG we tackled the problem by printing out verbose debug traces of the rule application process, resulting often in hundreds of pages of output that had to be skimmed through in order to find the source of the problem. The use of GTFL in FCG changed the way users and programmers interact with it, not only making the experience richer, but also more trouble-free. Some dynamics that were previously mystifying and impenetrable have cleared up. As a welcome side-effect newcomers to the team grasp the material at a considerably faster speed because of the way they can interact with and gradually investigate the dynamics. We display the crucial data structures such as the search tree, the remaining search queue, the applied rules, the resulting structure. These
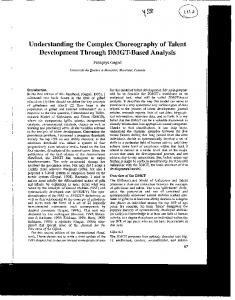
Figure 2: An example of GTFL in use. This debug trace was created by the Fluid Construction Grammar framework while parsing the utterance “I swept the dust”. The trace shows the set of rules that was tried, the rules that were eventually applied, the search tree that was built for finding out which rules to apply in which order, the resulting linguistic structure and more. Each of these elements is recursively expandable so that FCG developers have access to every little detail of the parsing process when they need to.
elements already give a clarifying overview of what happened in general. But if required, each of these elements can be recursively expanded to reveal essentially all internals of the process. Such traces allow FCG developers to debug and make sense of the formalism itself and they help FCG users to see the effects of their linguistic rules by having access to all details of the parsing process without losing a general overview. As can be seen in Figure 2, the complete trace fits into one browser window. This experience of interacting with data and the flow of the dynamics of a program is best captured with some hands-on experience. For this purpose, two examples of FCG debug traces can be found at:
http://martin-loetzsch.de/gtfl/application-example-1.html http://martin-loetzsch.de/gtfl/application-example-2.html We strongly encourage readers to take a look and play around with them since they convey the power of this approach better than words can.
4
Conclusion
Only a few years ago it would not have been feasible to implement a system such as described in this paper. Although our present-day web standards are much older, they were only poorly supported making it strenuous for web developers to ensure the interoperability of their web sites in different browsers. Fortunately, things have improved. Today valid XHTML+CSS code is properly interpreted by a variety of browsers and AJAX has become an ubiquitous technology that just works. Particularly impressive is the way contemporary HTML rendering engines are able to layout (and reflow) heavily nested HTML constructs with incredible speed and perfectly looking in almost all cases. Finally, with Hunchentoot there is now a reliable web server that runs on a big enough number of Lisps. All these advances in technology have made it possible to rethink the way we want to debug Lisp programs and two very simple yet very powerful ideas have come out (and have been implemented in the GTFL system). The first idea is to use the web browser instead of the Lisp listener as a terminal for tracing internals of a program. In GTFL, adding some content to the client page is as simple as printing some information to the listener. The advantage is that one can use different colors, text styles, backgrounds and many other graphical means to make representations more readable than if there were printed as plain text. And the second idea is to not abandon parts of debug information just for the sake of making the size of trace outputs manageable but to create visual representations that reveal all details in (recursively) expandable HTML elements. This makes it possible to fit tracing output within a single browser page while still allowing to access all internals of the program when needed. GTFL can by no means replace any of the debugging techniques mentioned in the introduction. When used in combination with these techniques we strongly believe it will speed up the process of unraveling the behaviour of a complex program. Acknowledgements: GTFL was initially developed as part of the Babel2 framework [Loetzsch et al. 2008], to which many members of the VUB AI-Lab and of the Sony CSL Paris have made contributions. We thank Pascal Costanza for very valuable comments on earlier versions of our paper. This research was funded by the EU FP7 Alear project.
References [de Beule and Steels 2006] De Beule, J., Steels, L.: “Hierarchy in fluid construction grammar”. In KI 2005: Advances In Artificial Intelligence. Proceedings of the 28th German Conference on AI, vol. 3698 of LNCS, Springer, 1–15. [Kosslyn 2006] Kosslyn, S.M.: “Graph Design for the Eye and Mind”. Oxford University Press, 2006. [Loetzsch 2009] Loetzsch, M.: “GTFL - A graphical terminal for Lisp”. http:// martin-loetzsch.de/gtfl/ [Loetzsch et al. 2008] Loetzsch, M., Wellens, P., De Beule, J., Bleys, J., van Trijp, R.: “The Babel2 Manual”. AI-Memo 01-08, AI-Lab VUB, Brussels, Belgium. [Marshak 2007] Marshak, U.: “HT-AJAX - AJAX framework for Hunchentoot”. http: //common-lisp.net/project/ht-ajax/ht-ajax.html [McCauley et al. 2008] McCauley, R., Fitzgerald, S., Lewandowski, G., Murphy, L., Simon, B., Thomas, L., Zander, C.: “Debugging: a review of the literature from an educational perspective”. Computer Science Education 18, 2 (2008), 67–92. [Steels and de Beule 2006] Steels, L., de Beule, J.: “Unify and Merge in Fluid Construction Grammar”. In Symbol Grounding and Beyond: Proceedings of the Third International Workshop on the Emergence and Evolution of Linguistic Communication, EELC 2006, vol. 4211 of LNCS, Springer, 197–223 [Weitz 2003] Weitz, E.: “CL-WHO - Yet another Lisp markup language”. http://www. weitz.de/cl-who/ [Weitz 2006] Weitz, E.: “HUNCHENTOOT - The Common Lisp web server formerly known as TBNL”. http://www.weitz.de/hunchentoot/