scope, timeline, budget, and so on. Metrics and Their Misuse. Most metrics reveal only partial truths. And, like the blind men exploring the elephant in the ancient ...
Copyright Rational Software 2002
http://www.therationaledge.com/content/mar_02/m_understandingElephant_bm.html
Understanding the Elephant: A Small Set of Metrics and How to Interpret Them by Bruce MacIsaac Senior Software Engineer Rational Software Metrics, according to the Rational Unified Process® (RUP®), should be "simple, objective, easy to collect, easy to interpret, and hard to misinterpret." Unfortunately, in reality most metrics are prone to misinterpretation. This article begins with a few real-life examples of how poorly considered metrics can lead software organizations astray, and then goes on to propose a minimal set of metrics that can help determine project progress without great risk of misinterpretation. Based on these, you can make adjustments as necessary to the scope, timeline, budget, and so on.
Metrics and Their Misuse Most metrics reveal only partial truths. And, like the blind men exploring the elephant in the ancient Sufi fable,1 we can easily be misled by metrics into mistaking the part for the whole. The following examples, drawn from personal experience, show how damaging this tendency can be in the context of a software organization. At one company where I worked, Bob supervised three teams, and Carl was the technical lead for one of them. When it was time for our annual performance reviews, Bob came into my office and exclaimed, "Did you know that Carl hasn't done any work for the last three months?!" I replied that I found this assertion very surprising, given the long hours that Carl was spending at the office huddled over his computer. Nevertheless, Carl received a scathing performance review. Some time later, I heard an explanation for the discrepancy between my observations and Bob's report. Bob was measuring productivity by the number of units checked into our Configuration Management tool, and Carl had delegated all his check-ins to
the integrator. The resulting metric indicated that there was one amazingly productive guy on the team, two poor performers (who occasionally integrated), and poor Carl, who looked like deadwood. At this same company, I once refactored some badly written code and reduced it to one-fifth of its original size. On our team, however, productivity was measured by delivered source lines of code per week, so instead of being rewarded for my efforts, I was greeted by a negative productivity report. Another time, a quality engineer dropped by my office to express concern about the high cyclomatic complexity of one of my units, which had a large case statement with lots of alternatives. He was going by the numbers and didn't bother to look at my code, which was straightforward and well written. It took some time to convince him that the metric, considered in isolation, was misleading. Still another time, I was working on a large project with several teams that adopted different approaches to defect tracking. One team decided to log in only serious defects that would take several days to fix. They either fixed smaller defects immediately or grouped them together into a few change requests. Another team took a different approach and logged in every tiny problem. What did the managers conclude by looking at the two sets of logs? Obviously, the first team had higher-quality code, because they had so many fewer defects! Perhaps because of bad experiences such as these, or perhaps because they lack experience with metrics, many smaller teams choose not to generate them at all. This is unfortunate, because despite their weaknesses, metrics can provide useful insights into budget, schedule, scope, and effort that would otherwise be unavailable. For those new to metrics, or wondering where to start, the following is a sound approach.
A Minimal Metrics Set Managers of even the smallest projects should track progress to determine whether they are on schedule and within budget, and, if they are not, to help them re-estimate and determine whether scope changes are needed. This minimal metrics set, therefore, focuses on progress metrics, including: ●
●
●
Earned Value. Used to re-estimate the schedule and budget for the remainder of the project, and/or to identify need for scope changes. Defect Trends. Used to help project the effort required to close defects; this metric may also provide an indication of software quality and the effectiveness of the testing effort. Test Progress Trend. Used to determine how much functionality is actually completed.
These metrics are described in more detail below.
Earned Value The most commonly used method to measure progress is an Earned Value Analysis.2 Earned Value is measured in terms of original estimated costs, rather than actual expenditure. A simple example shows why earned value is a more objective measure of progress than actual costs. Suppose you have a project made up of two similar, eight-day tasks. The first task ends up taking ten days because of unanticipated problems (an elephant stepped on your laptop). You've burned additional budget on those two days, but you've still only earned eight days worth of work -- and you have another eight-day task to complete. The reason to compute earned value is to get an objective measure of how complete the project is, and to help revise your budget and schedule estimates. Here are some definitions for simple Earned Value measures: ●
●
●
Earned Value = the sum of the original estimated effort for all completed tasks. Percent Complete = Earned Value divided by the total original estimated effort for the project. Productivity (or performance index) = Earned Value divided by the actual effort spent on the completed tasks.
In our example: ●
●
●
Earned Value = 8 days (original estimated effort for the completed task). Percent Complete = 50 percent (8 days earned ÷ 16 days original estimated effort). Productivity = 80 percent (8 days earned ÷ 10 days effort).
You may want to use this data to revise budget and schedule estimates. For this example, you can assume that your budget and schedule have slipped by only two days (provided that the elephant is back in the zoo). If you invented the elephant story to hide ongoing poor productivity, however, then it's time to face up and adjust time estimates for similar, future tasks. Do this by dividing the original estimate for the remaining tasks by the Productivity metric. In our example, you would calculate the revised estimate for the remaining task, originally estimated at eight days, as follows: 8 days ÷ 80% = 10 days Since Productivity may change over time, a trend of Earned Value is often useful to visualize Percent Complete and Productivity. It can be especially
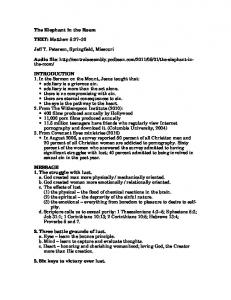
useful when there are multiple tasks, such as the example shown in Figure 1.
Figure 1: Earned Value Progress
Schedule is often just as important as cost, and it can be more important. By extrapolating the Earned Value trend, you can determine how much value is "earnable" by a given date and prioritize tasks accordingly. Or alternatively, you can extrapolate to the budgeted effort to estimate a project completion date. In practice, this analysis can get quite sophisticated, especially when applied to larger teams with staff turnover, varying skill levels, and so on. You may want to consult a good reference to learn more about Earned Value Analysis.3 Some Cautions This metric is not foolproof. To avoid misinterpretations, keep the following in mind. ●
●
Use the Productivity metric only to adjust estimates for similar tasks. Early completion of requirements-gathering tasks does not suggest that coding will be completed more quickly. Compute Productivity only for similar kinds of tasks, and adjust estimates only for similar tasks. Consider other factors. Will future tasks be performed by similarly skilled staff under similar conditions? Has the data been
contaminated by "outliers" -- tasks that were severely overestimated or underestimated? Is time being reported consistently (for example, is unpaid overtime included)? Do you need to factor in dollar costs in addition to effort? ●
Are estimates for newer tasks already accounting for calculated Productivity? If so, then estimates for new tasks will tend to be closer to the target, pushing the productivity closer to 100 percent. This will erroneously suggest that productivity is improving. You can resolve this problem by always estimating tasks with "ideal" effort days and then applying productivity to adjust predictions.4
If tasks are large (more than five days), or if you have a lot of tasks that are partially complete, then you may wish to factor them into your analysis: ●
●
Apply a subjective "percent completion," multiply this by the task's effort estimate, and include this in the Earned Value. To obtain more objective results, use an intermediate milestone. For example, assign no more than 80 percent complete to a coding task until the code has passed a review.
Defect Trend It is often useful to track the trend of open and closed defects. This provides a rough indication as to whether there is a significant backlog of defect fixing work to be completed and how quickly the defects are being closed.
Figure 2: Defect Trend
Some Cautions Note that this metric can be misleading because each change request is assigned the same weight, whether it affects one line of code or causes a major redesign. The following techniques help to address this: ●
●
●
Be aware of outliers. Change requests that require substantial work should be identified as such and be tracked as separate tasks, not bundled into a bucket of general bug fixes. If lots of tiny fixes are dominating the trend, then consider grouping them so that each change request represents a more consistent unit of work. Record more information, perhaps estimating the time required for changes and then grouping them into effort categories that you devise: ❍
less than one day
❍
one day
❍
less than five days
❍
more than five days
Record estimated Source Lines of Code (SLOCs) and actual SLOCs for each change request. This is recommended in Walker Royce's book5 because of the wealth of additional metrics that can then be gathered, such as scrap ratio, rework ratio, maintainability, and so on.
Also keep in mind that a lack of recorded defects may imply a lack of testing. When examining defect trends, be aware of the level of test effort as well.
Test Progress Trend The ultimate measure of completeness is how much functionality has been integrated into the system. If each of your development tasks represents a set of integrated functionality, then an Earned Value Trend chart may be sufficient. If, however, your tasks are organized differently, then a Test Progress Trend may be useful. For example, if you have substantial infrastructure tasks, then you will be passing few functional tests in the early stages of the project. The trend of passing functional tests should accelerate toward the end of the project as effort moves from infrastructure to deliverable functionality. Comparing the number of actual tests passing with the number you plan to complete will help you assess whether the project is on track. On some projects, you may want to count passing use cases or requirements instead.
Figure 3: Acceptance Test Progress
A Caution Some test cases may represent significantly more value or effort than others. One solution is to divide or group test cases to make them more balanced. Define multiple test cases for complex use cases to weight them appropriately, and to allow partial credit for partially completed use cases.
Additional Metrics The practical metrics set outlined above will help you monitor project progress and see how things are going so that you can make any necessary adjustments. They should be sufficient to measure progress for most projects, but you may also want to use additional metrics, such as: Source lines of code (SLOCs) counts, which are commonly used to measure size and progress.6 Cost and schedule trends, which can be analyzed using additional Earned Value Analysis techniques.7 Stability of requirements, which can help determine the risk of further requirements changes. Stability of implementation, which can indicate that the team may be thrashing with a poor software architecture. Many other metrics that may be useful for your particular projects. For a complete set of recommendations, refer to the Rational Unified Process
Guidelines: Metrics.8 When selecting metrics for your particular project, consider using Basili's Goal/Question/Metric paradigm.9 In brief, define clear goals, know the questions you want to answer, and understand the strengths and weaknesses of the selected metrics in answering those questions. Above all, keep in mind that metrics are simply guides to understanding and measuring your progress; they provide only partial insights into the overall story. As a manager, you must consider it your job to avoid the mistakes of those blind men who drew conclusions by touching just a small part of the elephant -- to understand what is behind the metrics and be able to use them to grasp the bigger picture.
References Anita D. Carleton, et al. "Software Measurement for DoD Systems: Recommendations for Initial Core Measures." Technical Report CMU/SEI-92TR-19 ESC-TR-92-019. Software Engineering Institute, Carnegie Mellon University, 1992. .pdf version available at: http://www.sei.cmu.edu/pub/documents/92.reports/pdf/tr19.92.pdf Robert B. Grady, Practical Software Metrics for Project Management and Process Improvement. Prentice-Hall, 1992. Ron Jeffries, Ann Anderson, and Chet Hendrickson, Extreme Programming Installed. Addison-Wesley, 2001. A Guide to the Project Management Body of Knowledge. The Project Management Institute: Newton Square, PA, 19073-3299, USA. 1996. Walker Royce, Software Project Management: A Unified Framework. Addison-Wesley, 1998.
Notes 1
For a brief version of that fable in poetic form, see the Appendix.
2
See A Guide to the Project Management Body of Knowledge. The Project Management Institute: Newton Square, PA, 19073-3299, USA. 1996.
3
These include Robert B. Grady, Practical Software Metrics for Project Management and Process Improvement (Prentice-Hall, 1992), and Walker Royce, Software Project Management: A Unified Framework (Addison-Wesley, 1998).
4
See the material on project velocity in Ron Jeffries, Ann Anderson, and Chet Hendrickson, Extreme Programming Installed. Addison-Wesley, 2001.
5 6
Walker Royce, op.cit.
Anita D. Carleton, et al. "Software Measurement for DoD Systems: Recommendations for Initial Core Measures." Technical Report CMU/SEI-92-TR-19 ESC-TR-92-019. Software
Engineering Institute, Carnegie Mellon University, 1992. .pdf version available at: http://www.sei.cmu.edu/pub/documents/92.reports/pdf/tr19.92.pdf. 7
Robert B. Grady, Practical Software Metrics for Project Management and Process Improvement. Prentice-Hall, 1992.
8
Ships with the Rational Unified Process product.
9
Robert B. Grady, op.cit.
Appendix: A Poem About the Blind Men and the Elephant The original version of this fable is attributed to Jalal-ud Din Rumi, a 13thcentury Sufi writer who lived in Anatolia at a time when its population was almost equally divided among Muslims, Christians, and Jews. It was his way of explaining how each of these religions, wedded to its own vision and set of partial truths, was blinded to the true nature of the Divine. The Blind Men and the Elephant by John Godfrey Saxe (1816-1887) It was six men of Indostan To learning much inclined, Who went to see the Elephant (Though all of them were blind), That each by observation Might satisfy his mind. The First approached the Elephant, And happening to fall Against his broad and sturdy side, At once began to bawl: "God bless me! but the Elephant Is very like a wall!" The Second, feeling of the tusk Cried, "Ho! what have we here, So very round and smooth and sharp? To me 'tis mighty clear This wonder of an Elephant Is very like a spear!" The Third approached the animal, And happening to take The squirming trunk within his hands, Thus boldly up he spake: "I see," quoth he, "the Elephant Is very like a snake!" The Fourth reached out an eager hand, And felt about the knee: "What most this wondrous beast is like Is mighty plain," quoth he; "'Tis clear enough the Elephant Is very like a tree!" The Fifth, who chanced to touch the ear, Said: "E'en the blindest man Can tell what this resembles most;
Deny the fact who can, This marvel of an Elephant Is very like a fan!" The Sixth no sooner had begun About the beast to grope, Than, seizing on the swinging tail That fell within his scope. "I see," quoth he, "the Elephant Is very like a rope!" And so these men of Indostan Disputed loud and long, Each in his own opinion Exceeding stiff and strong, Though each was partly in the right, And all were in the wrong!
For more information on the products or services discussed in this article, please click here and follow the instructions provided. Thank you!
Copyright Rational Software 2002 | Privacy/Legal Information