Understanding the Process of Learning Touch-screen Mobile Applications Lucia Tokárová
Melius Weideman
Faculty of Informatics Masaryk University Brno, Czech Republic
Website Attributes Research Centre Cape Peninsula University of Technology Cape Town, South Africa
[email protected]
[email protected]
ABSTRACT
skills was only marginally important. However, with the emergence of smartphones and tablets, the complexity of these devices has increased dramatically. Furthermore, modifications of infrastructure and distribution of software for mobile devices have expanded the base of application developers. As a result, mobile applications have become more mature, empowering people to perform more advanced tasks. On the other hand, modern mobile user interfaces introduce several challenges, which affected the learnability of mobile applications. These challenges include:
Mobile devices, together with touch-screen interfaces, have become part of the everyday usage items of many information consumers across the globe. However, it is clear that the learning curve for touch-screen interfaces is steeper than what was expected. This presents some problems especially along with the current trend towards designing more complex mobile applications. The objective of this research was to determine how users interact with applications on touch-screen mobile devices, and how they progress through the various learning phases. A literature study, two pilot studies and a full survey questionnaire were used to gather data and perceptions about the status quo of learning within mobile touch-screen interfaces. Results indicated the presence of recurring patterns in users' preferences. In particular, associations with personal characteristics, namely age, gender and the length of experience, were observed. These patterns might provide fundamental value as a theoretical ground for designing intuitive mobile applications.
•
•
Categories and Subject Descriptors
•
H.5.2 [Information Interfaces and Presentation]: User Interfaces – user-centered design, training, help, and documentation.
General Terms
•
Measurement, Design, Human Factors.
Keywords Learning, learnability, mobile applications, mobile user interfaces, touch-screen devices.
1. INTRODUCTION
Gestural interactions: Gestural interactions are engaging and intuitive for simple tasks. However, they are less practical for more complex operations, since the range of possible interactions and the precise dynamics of execution is often difficult to discover [14]. Small screen size: Mobile screens provide significantly less real estate for displaying information compared to desktop computers. Therefore, prioritization of content and features is essential. This approach leads to a reduced discoverability of advanced features [14]. Predominance of visual feedback: Touch screen mobile user interfaces rely heavily on visual feedback. The lack of other forms of responses prevents activation of cognitive mechanisms, such as muscle memory, which would aid in the skill acquisition process. Context of use: Sessions with mobile applications are short [2, 15] and variable in the context of use [15]. User's attentional resources are hardly ever reserved exclusively for a mobile device. It results in the breakdown of fluent interactions with mobile applications and affects the process of learning.
All these factors affect learnability – not only during the first interaction with mobile application, but also during the whole lifecycle of application usage.
Until recently, the primary purpose of most mobile phones was communication in the form of voice calls and text messages. Mobile devices were fairly simple compared to personal computers and the problem of diversity of user knowledge and
The objective of this research was to investigate the process users go through when they are learning how to use applications on touch-screen mobile devices. This study was focused on users' subjective preferences and attitudes towards skill acquisition. It covered the process of application usage, from the first contact, to the reasons for leaving the application.
Permission to make digital or hard copies of all or part of this work for personal or classroom use is granted without fee provided that copies are not made or distributed for profit or commercial advantage and that copies bear this notice and the full citation on the first page. Copyrights for components of this work owned by others than ACM must be honored. Abstracting with credit is permitted. To copy otherwise, or republish, to post on servers or to redistribute to lists, requires prior specific permission and/or a fee. Request permissions from
[email protected]. SIGDOC’13, September 30–October 1, 2013, Greenville, NC, USA. Copyright © 2013 ACM 978-1-4503-2131-0/13/09…$15.00. http://dx.doi.org/10.1145/2507065.2507066
The primary research question was “How do people perceive the process of learning in the context of touch-screen mobile application usage?" Patterns in responses were analyzed to examine the associations between personal characteristics (age, gender, the amount of experience with touch-screen devices) and users' preferences in various aspects of application usage.
157
2. RELATED RESEARCH
2.3 Diversity in human-computer interaction A range of studies examined patterns in individual differences towards software usage. For instance, Burnet [4] investigated gender pluralism in problem-solving software, and their results showed significant differences between males and females in terms of feature usage, feature-related confidence, and ad-hoc exploration. The authors associated these differences to the selfefficacy (individual's confidence in his or her ability to perform a specific task), the selectivity hypothesis (differences between males and females with respect to information processing), and the attention investment model (perceived costs, benefits and risks that users consider in deciding how to complete a task in a software environment). However, it can be argued that these differences are not based solely on individual's gender, but other personal characteristics as well.
2.1 Everyday skill acquisition Traditional theories on skill acquisition [1, 8] identify three stages of learning (via [16]). In the initial phase, beginners focus on understanding the activity and achieving immediate goals. They make perceptually salient mistakes with immediate consequences and they often have someone, such as a parent, friend or teacher, helping them to overcome initial difficulties. The middle phase of learning is characterized by practice and gaining experience. Mistakes become less frequent and serious and the activity can be performed with reduced concentration. In this phase, individuals achieve an acceptable level of performance. In the last phase of learning, performance becomes autonomous. Since the performance does not need to be actively controlled, most people do not perceive an urge for further improvements. With the minimum amount of regular practice, they are able to maintain the same level of accuracy for months, or even years.
To illustrate this idea, McGrenere [12] has suggested that the differences might be associated with individual's attitudes. Based on these studies, the author created a scale, which identifies individual differences with respect to the perception of complex software. On one end of the scale, there are feature-shy users, who prefer simple user interface without any unnecessary features. On the other end, there are feature-keen users, who believe that all interface elements have some inherent value and want them to be visible so that they can gradually explore them.
These classic theories explain the process of natural learning, focused on attaining an acceptable level of performance. In contrast, research on the expert-performance approach [7] studies strategies that lead to the highest possible level of expertise. The main difference between these two concepts is engagement in socalled deliberate practice. Future experts do not stop learning when they achieve an acceptable level of performance. Instead, they keep practicing; they apply problem solving to overcome challenges to achieve ever-higher levels of performance. The most important qualities of deliberate practice include motivation, concentration, regularity, feedback, and design of practice [7].
2.4 Universal usability The topic has become even more relevant with the adaptation of information technologies outside the work environment. According to Shneiderman and Hochheiser [18], the tendency to make information technologies available to broader populations introduces three major challenges: technology variety, user diversity and gaps in user's knowledge. Universally usable systems have to accommodate users with different backgrounds (age, gender, culture, literacy, skills, knowledge, etc.). Diversity of knowledge and skills is particularly salient, because the level of knowledge and previous experience with interactive systems is generally difficult to estimate. Furthermore, the knowledge changes with practice and exposure to the system. As such, the same user interface should satisfy very different sets of needs of novice and frequent users [18]. Although there has been a persistent interest in this topic, diversity of user knowledge and skills still presents one of the central recurring problems in HCI.
2.2 Skills in human-computer interaction Research on skill acquisition in human-computer interaction became important in the 1980s. With the emergence of the personal computer, interactive software was no longer a tool used only by technically oriented users. Yet, operating most programs required formal training and reading paper manuals. During the 1980s, a number of studies investigated learning and routine use of office systems such as text editors and word processors [5, 11, 17]. This research demonstrated that learning interactive systems has several distinctive qualities. Firstly, exploratory learning seems to be an effective and popular strategy among users. Compared to working through sequenced training materials, individuals are more successful in guided task-oriented investigation [5]. Secondly, users' motivations for learning were focused on attaining practical goals. Software is perceived as a tool. Learners were not interested in understanding system as a whole but rather in how the system can help them accomplish their pursuits [6]. Thirdly, users often generalized their prior knowledge and construct ad-hoc interpretations about how a system works [11]. The problem was that they use their knowledge even when it does not apply, and, as long as they reach their goals, they are reluctant to change their strategies in favor of more efficient procedures. They often persisted in using inefficient strategies and their level of performance stabilized on relative mediocrity [17]. In traditional HCI research, the combination of user's focus on practical goals and persistence in using well-practiced and generally applicable procedures is referred to as the paradox of the active user [6]. These findings have initiated further research on learnability of interactive systems and training materials in HCI.
2.5 Learning and mobile touch-screen UIs Concerning mobile user interfaces, the issue of learning is currently often examined in conjunction with new interaction techniques [3, 9]. However, these experiments are usually conducted in laboratories, with controlled settings, fixed training periods, and homogeneous group of participants. Longitudinal studies are less common, and generally focused on user's performance and subjective preferences towards interactions [10]. A more holistic approach to investigate the process of learning in the context of the mobile environment can be attributed to Oulasvirta [16]. This empirical study is a fraction of the broader research on the self-taught intermediate level of skill and examines learning strategies of three groups of users – novice, casual and expert users of modern smartphones. The authors concluded that superior performance of experienced users (casual users and experts) could be attributed to faster navigation and better knowledge of terminology, not to deeper understanding of the system. Improvement is the result of routine use and three
158
2006
2007
2011
2012
2013
2012
2010
2008
Nokia N95
Apple iPhone
Nokia Lumia 800
Apple iPhone 5
Samsung Galaxy S4
Apple iPad Mini
Apple iPad
Dell Inspiron Mini
7,9"
9,7"
12"
? 2,6"
3,5"
3,7"
4"
5"
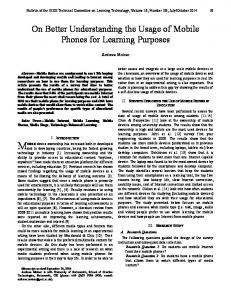
Figure 1. The evolution of screen sizes over the last years learning events: familiarization, following media and ad-hoc problem solving. Authors also suggested that the self-taught intermediate level of skill is device-specific. However, the experiment was conducted on a Symbian based dual slider phone with many physical controls, and the conclusion may not be fully applicable on current fully customizable touch-screen mobile devices.
encouraged and space provided. It allowed users to either comment on questions or expand their answers.
3.1 Questionnaire design The questionnaire consisted of three parts. The first part (classification, questions 1–6) contained demographic questions. In the second part (screening, questions 7–13), questions on personal experience with mobile devices were included. This part was also used for screening purposes. Only the respondents who reported using touch-screen devices and downloading mobile applications were asked to continue to the last part of the questionnaire. The order of these parts (classification before screening) was intentionally chosen to monitor the diversity of respondents. As a result, a sample of respondents who do not use applications on touch-screen mobile devices was included in the first part of the questionnaire, but did not answer irrelevant questions in the last part. Although it falls outside the scope of this paper, these individuals are likely to be characterized as conservatives or skeptics according to the Moore's theory of technology adoption [13, 18] and as such are relevant for investigation of links between personal characteristics and usage patterns. The last part of the questionnaire (questions 14–24) covered the process of applications usage, focused mainly on the initial and middle phase of learning and the reasons for leaving the applications.
2.6 Convergence of screen sizes Over the past decade, there seems to have been a convergence of miniature, old-fashioned mobile devices (Figure 1, left) and large, bulky personal computers (Figure 1, right). On one hand, mobile devices, such as cell phones, personal digital assistants and feature phones are lightweight and easy to carry. However, small screen sizes and full hardware keyboards made them uncomfortable to use, which has been one of the main reasons for the proliferation of the new generation of mobile devices with multi-touch screens and limited number of hardware controls. To improve the ergonomics and usability, the displays of mobile touch-screen devices have been growing in size. On the other hand, the size of larger personal computer screens restricts portability and flexibility of use – hence the emergence of new categories of devices, such as netbooks and tablets. To increase the mobility of these devices, displays are gradually becoming smaller. Although the process of learning has been investigated in the related disciplines and HCI as well, the mobile environment and specific features of modern touch-screen user interfaces have introduced several new challenges. In order to design intuitive applications for mobile devices, it has become essential to study the specifics of the new context of use and focus on the user perspective, rather than technical aspects. This paper presents the initial steps towards understanding the process of learning in the context of touch-screen mobile application usage.
3.2 Analysis At first, the basic frequencies of responses were processed and examined. To investigate the patterns, contingency tables were created. One dimension of categorical variables included gender, age, the length of experience with mobile devices, and the frequency of application downloads. These variables were selected based on the literature review. The other dimension covered the responses on personal preferences towards application usage, obtained in the last part of the questionnaire.
3. METHODS The process of learning was investigated using two methods: a quantitative and qualitative survey. Quantitative data was collected in a questionnaire driven study. The questionnaire design and content was based on a literature review and verified in a pilot study using informal semi-structured interviews with five participants (2 females, 3 males). These interviews helped refine questions and wording and the range of options in closeended questions. Afterwards, the questionnaire was tested and refined in a second pilot study involving five other participants. Qualitative data was collected in the initial interviews. Also, throughout the questionnaire, open-ended answers were
To investigate the associations between categorical variables, chisquare tests were used. The associations were marked as significant if the Pearson's chi-square test returned a p-value less than or equal to 0,05. Since a high number of issues seemed to be related to age, these associations were investigated in detail. Answers on multiple-choice questions were recoded as "Yes" if the option was checked and "No", if the answer was missing (only the answers from respondents who finished the questionnaire were included). Again, chi-square tests were used to calculate the associations and examine the links between age and individual responses.
159
Afterwards, all significant associations were investigated in detail by studying contingency tables and the patterns in distribution of responses. Finally, the qualitative data from open-ended responses and pilot studies were used to interpret the results.
individuals, who use mobile applications longer, seem to be more likely to read the descriptions. Yes, usually
4. RESULTS AND DISCUSSION
Yes, briefly No
4.1 Participants
0%
Data collection was conducted using an online survey service. The main reason was the intention to address a wide diversity of respondents in terms of gender, age, culture, level of education, field of employment and personal experience with mobile devices. The target group of participants was not explicitly restricted. In summary, 138 respondents participated in the survey, out of which 127 participants (92%) completed it.
10%
20%
30%
40%
50%
60%
70%
80%
Figure 2. Reading application descriptions. Additionally, a few respondents commented on the importance of the content and number of user reviews. Interviews also suggested that the decision depends on the motivation for downloading and the source of the first contact with the application (e.g. one individual pointed out that he is more likely to read the description if he is searching for an application on a mobile application market compared to any other source).
The sample of participants consisted of 40 females (29%) and 98 males (71%). The largest group of participants (39,1%) reported the age between 20 and 29, and 1 participant was younger than 20 years old. The other groups were fairly evenly distributed, with 23,2% participant between the age 30 and 39, 18,1% between 40 and 49 and 18,8% participants 50 years old and above. In an openended question, a variety of native languages was indicated. Among 13 languages listed, the most prevalent were Czech (26,8%) and English (26,8%), followed by Afrikaans (20,3%). Other languages included Dutch, French, German, IsiXhosa, Portuguese, Sepedi, Shona, Slovak, and Swahili. The highest level of completed education was distributed among high school graduates (15,4%), bachelor’s degree (31,5%), master degree (37,7%) and doctoral degree (15,4%). Eight participants reported other levels of qualification, mainly professional degrees. Respondents also indicated various categories of backgrounds, including Administration, Art and design, Business, Education, Engineering, Information technology, Marketing and sales, Media and culture, and Science.
4.2.2 Reading introductory instructions In contrast, after downloading the application, the interest in reading introductory instructions drops recognizably (Figure 3). If introductory instructions are available, 44,4% of respondents usually skip these instructions, while only 21,2% usually read and 34,3% read the instructions briefly. Yes, usually Yes, briefly No 0%
10%
20%
30%
40%
50%
60%
70%
80%
Figure 3. Reading introductory instructions. Qualitative analysis also pointed to a significant association between willingness to read and age (p = 0,016). In this case, the association is linear, and suggests that the older the respondent, the more likely he or she is to read the introductory instructions.
Concerning the personal experience with touch screen mobile devices, 82,5% of the respondents reported using a smartphone, 48,9% a tablet and 16,1% a dedicated e-book reader. The majority of the respondents (63,2%) have been using touch screen devices for more than two years. The most widely used operating system was Android (55,6%) and iOS (48,7%). The highest number of respondents (39,3%) reported downloading mobile applications at least a few times a month and the most common reason for downloading was utility (81,8%), followed by work-related purposes and entertainment.
This association was also observed in the pilot study, where two older respondents (above 50 years old) complained about proclaimed intuitiveness of mobile interfaces and the lack of instructions.
4.2.3 Familiarization preferences Furthermore, the majority of respondents (65,7%) prefer trying applications on their own (Figure 4). A less popular strategy is presentation of available features (36,4%) and initial walkthrough (33,3%). With mobile applications, video is the least popular strategy (18,2%), presumably because it does not reflect individual pace of familiarization. Also, as interviews suggested, videos might sometimes be confused with an advertisement, and as such, ignored or skipped.
Two groups of respondents were eliminated in the screening part of the questionnaire: respondents who do not use touch-screen mobile devices (19 subjects) and respondents who do not download mobile applications (9 subjects). Subsequently, a total number of 99 participants (25 females and 74 males) provided results, which were investigated and summarized further.
4.2 The initial phase of learning 4.2.1 Reading application descriptions
Video
A surprisingly high number of respondents reported reading application descriptions on mobile application markets (Figure 2). 42,4% individuals usually read a description, and 43,4% read it at least briefly. The chi-square test revealed a significant association between the willingness to read application description and two attributes, age (p = 0,003) and the length of experience with mobile applications (p = 0,027). Older respondents and
Presenta?on Walkthrough Try on their own 0%
10% 20% 30% 40% 50% 60% 70% 80%
Figure 4. Familiarization preferences.
160
The familiarization preferences seem to be significantly associated with age. In particular, younger respondents were much more likely to prefer trying applications on their own compared to older respondents (p = 0,037).
mobile devices (p = 0,001). Females seem to be more willing to read help or ask for advice, while males prefer random exploration. Similar with age, older participants (40 or above) are more likely to read help, compared to younger categories, which are more prone to try ad-hoc strategies. The data set also suggested that novices, who own touch-screen mobile devices for less than six months are most likely to ask for advice.
4.2.4 Familiarization strategies Concerning the familiarization (Figure 5), the most common approach is looking for the quickest way to perform the task, for which the application was downloaded (58,6%). Several respondents indicated that in this initial phase, they are likely to spend some time exploring different options (45,5%). Some respondents also admitted that they usually skip all messages and instructions and try the application on their own (38,4%). Only 26,3% indicated that they are most likely to read instructions to find out how the application works. Interviews suggested that motivation and the purpose of the application play an important role as well.
4.3.2 Exploration of advanced features When it comes to exploration of advanced features (Figure 7) in mobile applications, the majority of respondents reported that they do not use any special strategies, and they are most likely to notice new features as they appear in applications (55,6%), or stumble onto them by accident, while trying to do something else (45,5%). Other strategies included: following recommendations, reading about the applications, or trying strategies known from other applications. The popularity of these strategies was lower and evenly distributed.
Read instruc?on Try various op?ons
Find on their own
Quickest way
Read tool?ps
Skip messages 0%
Read other sources
10% 20% 30% 40% 50% 60% 70% 80%
Recommenda?on Familiar strategies
Figure 5. Familiarization strategies.
By accident
Again, familiarization strategies seem to be associated with age (p = 0,012). Younger respondents were more likely to spend some time trying various options in the applications, whereas older respondents were more likely to report reading instructions to find out how the application works.
0%
10% 20% 30% 40% 50% 60% 70% 80%
Figure 7. Exploration of advanced features. Furthermore, learning advanced features seems to be significantly associated with gender (p = 0,011). Females seem to be more likely to follow recommendations, while males reported reading about applications. Age seems to play important role as well (p = 0,023). For instance, older participants were more likely to report following recommendations, while younger respondents were more likely to indicate that they stumble onto new features by accident.
4.3 The middle phase of learning 4.3.1 Problem-solving strategies The questionnaire indicated that the most common problemsolving strategy (Figure 6) is an ad-hoc exploration. The largest group of respondents (61,6%) reported trying a random course of actions as their usual strategy. A particularly high number of individuals (55,6%) also indicated reading online help. This number might be even higher, because Google search and online instructions were also often mentioned in open-ended answers. Furthermore, 23,2% of respondents reported asking for help (either personally or online), e.g. on social networks.
4.3.3 Exploration of gestures The most common strategy for gesture exploration (Figure 8) seems to be trying gestures known from other applications (60,6%). A relatively high number of respondents also reported that they stumble onto gestures by accident, while they try to do something else (45,5%). Other strategies, such as reading tips in applications, reading about applications, and following recommendations were less popular.
However, interviews implied that this strategy depends heavily on the individual's motivation and purpose of downloading the application. In 23,2% of cases, it was reported that the problem might be a reason to uninstall the application.
Read tool?ps
Random ac?ons Ask for advice
Read other sources
Read help
Recommenda?on
Quit or uninstall
Familiar gestures 0%
By accident
10% 20% 30% 40% 50% 60% 70% 80%
0%
10% 20% 30% 40% 50% 60% 70% 80%
Figure 6. Problem-solving strategies. Figure 8. Exploration of gestures.
Qualitative analysis showed that the problem-solving strategy is associated with several personal characteristics, namely gender (p = 0,043), age (p = 0,008), and the length of experience with
161
The analysis showed a significant association with age (p = 0,011). Younger respondents seem to be more willing to try familiar gestures from other applications.
Additionally, a wide variety of open-ended answers were provided to this question. Several participants mentioned that they perceive errors, poor design and usability issues as typical problems. Five participants provided more specific examples. For instance, two important issues included the necessity of registration, and long initial setup, especially before trying the application. Paying for advanced features and inappropriate advertising were also indicated as common problems.
4.3.4 Customization When asked about customization (Figure 9) of mobile applications, the majority of respondents reported that they usually actively look for application settings (70,7%). A large number of respondents also admitted that they prefer using default options (29,3%). All the other strategies, such as reading about applications, tips, or recommendations, were less common.
4.4.2 Reasons to quit Finally, the survey suggested that there are two main reasons for individuals to stop using or uninstall the applications (Figure 11). Firstly, the application is not useful (77,8%) and secondly, the application is not needed anymore (65,7%). Many respondents also indicated poor design (43,4%) and missing features (43,4%) as the typical reasons to quit.
Looking for seRngs Default op?ons Read tool?ps Read other sources
Not needed anymore
Recommenda?ons
Difficult to use
By accident 0%
Not useful in general
10% 20% 30% 40% 50% 60% 70% 80%
Missing features Forget about it
Figure 9. Customization.
Poor design
Similar to the previous questions, the analysis revealed a significant association with age (p = 0,015), but also with the length of experience (p = 0,043). For instance, novice users are more likely to discover customization options by accident.
0% 10% 20% 30% 40% 50% 60% 70% 80%
Figure 11. Reasons to quit.
However, this result raises an important issue about motivations for finding customization options. As previous studies have suggested [5], for many users, advanced features such as customization, might be either overlooked or perceived to be too demanding for many users.
Following the previous question, the typical reasons to stop using or uninstall the applications seem to be associated with age (p = 0,018). For younger respondents it was more common to be discouraged by missing features. Again, a high number of open-ended answers were provided. Respondents commented on errors, usability issues, advertising and payments as the common reasons to stop using the applications. Data load was also mentioned several times. Either the application uses too much memory, or requires online connection and streams a lot of data. Other issues include the necessity of registration before trying the application and excessive complexity of the user interface.
4.4 The reasons for leaving the applications 4.4.1 Typical problems For the majority of respondents (71,7%), the most common problem they experience with mobile applications is that the applications do not fulfill their expectations (Figure 10). A large number of respondents also reported that they perceive it as a common problem when a task completion takes too long (38,4%) and when they miss some important features (34,3%).
5. CONCLUSION AND FURTHER WORK The objective of this research was to investigate how users interact with applications on touch screen mobile devices, and how they progress through the various learning phases. This study was primarily focused on personal preferences and attitudes towards skill acquisition. It covered the whole process of application usage, from the first contact, to the reasons for leaving the application.
Unfulfilled expecta?ons Uncertain how to proceed Repe??ve choices Tedious task flows
To examine this issue, quantitative and qualitative methods were used. Quantitative data was collected in a questionnaire driven study. It allowed the authors to gather a relatively large amount of data compared to interviews and to address a wide diversity of respondents in terms of gender, age, culture, level of education, field of employment and experience with mobile devices. Qualitative data was obtained by open-ended questions and initial interviews and was used to aid in the interpretation of results.
Too many op?ons Too many messages Missing features 0% 10% 20% 30% 40% 50% 60% 70% 80%
Figure 10. Typical problems. Quantitative analysis confirmed a significant association with age. Younger participants were more likely to report missing important features and complain about tedious task completion.
The data showed considerable differences among individuals' learning strategies. However, closer examination revealed some recurring patterns, suggesting associations between personal
162
characteristics and users' preferences. For instance, responses were often significantly associated with age. Older participants were more likely to prefer safer options, such as reading instructions or following recommendations. In contrast, younger participants were more prone to try ad-hoc strategies, whether towards familiarization or problem solving. Some responses were also associated with gender. Females seemed to be significantly more likely to ask for advice or help, or follow recommendations, whereas males preferred random exploration and reading about applications from various sources. The length of experience seemed to play an important role as well. Novice users often preferred safer strategies, like reading instructions, or asking for advice and reported discovering new options by accident. More experienced users were more prone to choose proactive problemsolving strategies. On the other hand, the frequency of application downloads was not a significant indicator. Although the literature review suggested that the frequency of exposure is important, statistical analysis did not show any significant association with this categorical variable.
[3] Bragdon, A., Nelson, E., Li, Y., and Hinckley, K. 2011. Experimental analysis of touch-screen gesture designs in mobile environments. In Proceedings of the SIGCHI Conference on Human Factors in Computing Systems (Vancouver, Canada, May 07–12, 2011). CHI'11. ACM, New York, NY, 403–412. DOI= http://dx.doi.org/10.1145/1978942.1979000. [4] Burnett, M.M., Beckwith, L., Wiedenbeck, S., Fleming, S.D., Cao, J., Park, T.H., Grigoreanu, V., Rector, K. 2011. Gender pluralism in problem-solving software. Interact. Comput. 23, 5 (Sep. 2011), 450–460. DOI= http://dx.doi.org/10.1016/j.intcom.2011.06.004 [5] Carroll, J.M. and Carrithers, C. 1984. Training wheels in a user interface. Commun. ACM 27, 8 (Aug. 1984), 800–806. DOI= http://dx.doi.org/10.1145/358198.358218. [6] Carroll, J.M. and Rosson, M.B. 1987. Paradox of the Active User. In Interfacing Thought: Cognitive Aspects of HumanComputer Interaction, J.M. Carroll, Ed. MIT Press, Cambridge, MA, 80–111.
These results suggest that even though the users' preferences are highly diverse, some patterns in their learning strategies can be observed. In order to design intuitive mobile applications, these patterns might provide fundamental value. It is anticipated that the closer investigation of these patterns might lead to the construction of learning profiles of representative users groups, and subsequently to the design of support mechanisms that will encourage various types of application learners in the process of mobile application usage.
[7] Ericsson, K.A. 2006. The influence of experience and deliberate practice on the development of superior expert performance. In The Cambridge handbook of expertise and expert performance, K.A. Ericsson, N. Charness, R.R. Hoffman and P.J. Feltovich, Eds. Cambridge Handbooks in Psychology. Cambridge University Press, Cambridge, UK, 685–705.
Finally, it should be noted that any questionnaire driven study has several limitations. Participants’ understanding of questions and options might bias their responses. Also, the results rely heavily on the subjective views of respondents and the recollection of their behavior. To eliminate these deficiencies, two pilot studies were conducted and the interpretation of quantitative results was supported by the literature review and qualitative data. Yet, the results reflect mainly subjective preferences and might differ from actual users' behavior. Further empirical studies are necessary to extend the understanding of the learning within mobile applications user interfaces – especially user studies with direct access to higher number of participants are essential. Still, the present study provides important initial steps towards this direction, and the results will be used in further research.
[8] Fitts, P.M. and Posner, M.I. 1967. Human Performance. Brooks/Cole, Belmont, CA.
6. ACKNOWLEDGMENTS
[11] Mack, R.L., Lewis, C.H., and Carroll, J.M. 1983. Learning to use word processors: Problems and prospects. ACM T. Off. Inf. Syst. 1, 3 (Jul. 1983), 254–271. DOI= http://dx.doi.org/10.1145/357436.357440.
[9] Jain, M. and Balakrishnan, R. 2012. User learning and performance with bezel menus. In Proceedings of the SIGCHI Conference on Human Factors in Computing Systems (Austin, TX, USA, May 05–10, 2012). CHI'12. ACM, New York, NY, 2221–2230. DOI= http://dx.doi.org/10.1145/2207676.2208376. [10] Li, Y. 2010. Gesture Search: A tool for fast mobile data access. In Proceedings of the 23nd annual ACM symposium on User interface software and technology (New York, NY, USA, October 03–06, 2010). UIST'10. ACM, New York, NY, 87–96. DOI= http://dx.doi.org/10.1145/1866029.1866044.
The authors would like to acknowledge Mrs. Corrie Uys from the CPUT Centre for Postgraduate Studies, for her assistance with statistical analysis.
[12] McGrenere, J. 2004. Iterative Design and Evaluation of Multiple Interfaces for a Complex Commercial Word Processor. In Multiple User Interfaces: Cross-Platform Applications and Context-Aware Interfaces, A. Seffah and H. Javahery, Eds. John Wiley & Sons, Ltd, Chichester, UK, 351–372.
7. REFERENCES [1] Anderson, J.R. 1982. Acquisition of cognitive skill. Psychol. Rev. 89, 4 (Jul. 1982), 369–406. DOI= http://dx.doi.org/10.1037//0033-295X.89.4.369. [2] Böhmer, M., Hecht, B., Schöning, J., Krüger, A., and Bauer, G. 2011. Falling asleep with Angry Birds, Facebook and Kindle: A large scale study on mobile application usage. In Proceedings of the 13th international conference on Human computer interaction with mobile devices and services (Stockholm, Sweden, August 30 – September 02, 2011). MobileHCI'11. ACM, New York, NY, 47–56. DOI= http://dx.doi.org/10.1145/2037373.2037383.
[13] Moore, G. 1991. Crossing the chasm. HarperBusiness Book, New York, NY. [14] Norman, D. 2010. Natural user interfaces are not natural. ACM interactions 17, 3 (May–Jun. 2010), 6–10. DOI= http://dx.doi.org/10.1145/1744161.1744163. [15] Oulasvirta, A., Tamminen, S., Roto, V., and Kuorelahti, J. 2005. Interaction in 4-second bursts : The fragmented nature
163
of attentional resources in mobile HCI. In Proceedings of the SIGCHI Conference on Human Factors in Computing Systems (Portland, OR, USA, April 02–07, 2005). CHI'05. ACM, New York, NY, 919–928. DOI= http://dx.doi.org/10.1145/1054972.1055101.
[17] Rosson, M.B. 1983. Patterns of experience in text editing. In Proceedings of the SIGCHI Conference on Human Factors in Computing Systems (Boston, MA, USA, December 12–15, 1983). CHI'83. New York, NY, 171–175. DOI= http://dx.doi.org/10.1145/800045.801604.
[16] Oulasvirta, A., Wahlström, M., and Ericsson, K.A. 2011. What does it mean to be good at using a mobile device? An investigation of three levels of experience and skill. Int. J. Hum-Comput. St. 69, 3 (Mar. 2011), 155–169. DOI= dx.doi.org/10.1016/j.ijhcs.2010.11.003.
[18] Shneiderman, B. and Hochheiser, H. 2001. Universal usability as a stimulus to advanced interface design. Behav. Inform. Technol. 20, 5 (Sep–Oct. 2001), 367–376. DOI= http://dx.doi.org/10.1080/01449290110083602.
164