Indian Journal of Science and Technology, Vol 9(47), DOI: 10.17485/ijst/2016/v9i47/108692, December 2016
ISSN (Print) : 0974-6846 ISSN (Online) : 0974-5645
Understanding the Semantics of a Mixed Reality Environment Georgios Tsaramirsis*, Hassanin M. Al-Barhamtoshy and Anas Fattouh Faculty of Computing and Information Technology, Jeddah, Saudi Arabia King Abdulaziz University (KAU), Saudi Arabia;
[email protected],
[email protected],
[email protected]
Abstract Objectives: The objective of this paper is to explore how mixed reality can be enhanced with actual understanding of the recognized objects. Methods: This paper will conceptually utilize a method called MEASUR semantic analysis and explain how it can improve the semantic understanding of the environment. The paper explains how a MEASUR Ontology Chart, that captures the semantics of a mixed reality environment can be generated and how it can increase the user interaction with the mixed environment. Findings: Mixed reality is a new field of research that aims to enhance our reality with computer generated 3D graphics, also known as holograms. Additionally, it allows the user to interact with virtual and real objects. Even though we are still at the beginning of exploring its potentials, mixed reality is expected to be a game changer in most aspects of our everyday life. A major problem with the current state of art mixed reality applications is that they have very limited understanding about the real-world environment. They are utilizing computer vision approaches for identifying objects from the real world but yet again there is no real association between the various objects and limited or no understanding of their semantics. This limits the supported interaction between the users and mixed reality environment. Application/Improvements: This paper will conceptually utilize a method called MEASUR semantic analysis and explain how it can improve the semantic understanding of the environment. The paper explains how a MEASUR Ontology Chart, that captures the semantics of a mixed reality environment can be generated and how it can increase the user interaction with the mixed environment.
Keywords: Mixed Reality, MEASUR Semantic Analysis, Ontology Charts, Real Objects Identification, Virtual Objects
1. Introduction During the past few years, Virtual Reality (VR) reappeared with new head mounted devices that utilize the power of modern computer graphics and localization sensors. An example of such device is the Oculus Rift head mounted display that is capable of displaying high quality graphics at a high frame rate. The device supports IMU localization sensor that can identify head movements allowing the system to track the head movement. This way, the system knows where the user is looking so it can display the corresponding content. The device comes with a camera that can detect infrared lights at the front of the head mounted display so it can provide additional localization information. The head mounted display can *Author for correspondence
be accompanied by devices such as leap motion that can detect the hands of the user. Virtual reality can offer the users a very realistic experience in a virtual environment1. However, like most VR technologies the user is blind from the real world. Insolation of the users from the real world is one of the aims of VR. However, recently a new technology appeared, aiming to enhance the real world with computer generated graphics instead of replacing it. This is the approach of Mixed Reality (MR). MR allows the users to view the real world, “understand” the various objects in the environment and allow the user to enhance it, by using computer generated graphics. Mixed Reality (MR) applications have been realized with visual odometry system that allow the users to interact with virtual objects2. Additionally, other technologies have also been
Understanding the Semantics of a Mixed Reality Environment
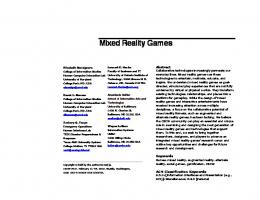
utilized to aid MR. In3 players are driving powered chairs. Recently, mobile phones and tablets have also been used in mixed reality applications3,4. Recent advances in the Graphic Accelerator Units (GPUs) are used to accelerate MR processes, and features descriptors and extraction5 with focus on mobile MR applications. Accordingly, “MR simulation is the process of simulating all aspects of MR system to carefully control the pertinent variables in user interaction”4. Also, VR and AR are also used in education as a new paradigm of learning tool with 3D in AR concepts6. Such system improves the training effect and their immersion and interest7. Figure 1, shows a conceptual example of MR, where a desk with a PC monitor has been identified.
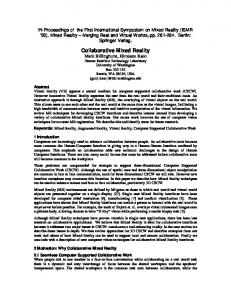
1.1 MEASUR Semantic Analysis and Ontology Charts MEASUR Semantic Analysis is a method used by software engineers and business analysts for understanding, analyzing and eliciting organizational structures and norms8. The method claims to have a number of benefits for information system that used semantic analysis during the analysis and design phases. These benefits include high maintainability and extensibility as they are immune to malignant changes and they support non-destructive updates9. The output of the method is a diagram called MESUR Ontology Chart. This diagram illustrates the various conceptual entities, their interaction with each other and their properties via their ontological dependencies. Ontology charts can play an important role in the generation of software development artefacts such as UML diagrams9-13 and prototypes14. Figure 2, shows an example of an ontology chart.
Figure 1. Conceptual example of MR.
MR is heavily based on objects identification; however, most MR technologies offer very limited semantic information about the identified objects. This limits the interaction between the users and the identified objects from the real world. For example, the system can identify that the user is looking at a monitor but it does not know what properties and actions and functionality are associated with the monitor. For example using the current technologies, it is possible to recognize the objects in Figure 1, but not possible to associate actions with them. This research proposes a conceptual solution to this problem via the utilization of a requirements analysis method called MEASUR Semantic Analysis. The output of semantic analysis is a model called “Ontology Chart”. This model is capable of capturing the semantics of a system. In this paper, we will show how MEASUR Semantic Analysis can be conducted and how an ontology chart model can be generated from the identified object in order to aid the system to gain an understanding about the real world.
2
Vol 9 (47) | December 2016 | www.indjst.org
Figure 2. An example of ontology chart.
Each conceptual entity in the ontology chart, may refer to a universal, similar to database table or a particular, similar to a database record. In Figure 2, the particulars have a hash symbol in front of their label. The minimum information that a particular (record) can hold is its name, value, start time and finish time. If the particular is still valid then the finish time value will be null or in the future. A conceptual entity known as dependent is ontologically dependent on another, known as antecedent, if and only if, cease of the existence of the antecedent will lead to cease of the existence of the depended. For example a room is ontologically dependent on a building. If the specific building ceases to exist, all its rooms will cease to exist. In the diagram in Figure 2, this is illustrated by the position of the various nodes in the chart. The nodes at the right are ontologically depended on the nodes at the
Indian Journal of Science and Technology
Georgios Tsaramirsis, Hassanin M. Al-Barhamtoshy and Anas Fattouh
left. Semantic analysis demands that all changes of values are stored with start and finish times. Cease of existence in terms of semantic analysis compliant information systems means that the particular will receive a finish time value. This way the method maintains history of data and supports non-destructive updates. Each antecedent can have zero to many dependents and its dependents can have zero to two antecedents. All dependents are ontologically dependent on their antecedents. Conducting semantic analysis as presented in15 is a five steps process. Step one, also known as problem definition is the stage where the requirements are formed in the form of a natural language text. In the second step, all the candidate nodes are identified. In the third step, the identified candidate nodes are grouped and categorized. During this process any duplicates will be merged. Semantic Analysis supports five categories and each node can belong to maximum one category. These categories are, agents, entities, relationships, communication acts and determiners. Agents are physical or legal persons that can be associated with actions. Entities are various objects or concepts that cannot act on their own. Rather they can be used by an agent. Relationships are associations between other nodes. Communication acts are some more complex relationships. Determiners are properties of other nodes that can change their value over time. These categories are important as semantic analysis is using connectivity rules that govern the possible associations between the various nodes based on their category. These rules are: Agents can have up to one antecedent and this can only be another agent. Entities have one antecedent and this can be another entity or an agent. A relationship has two antecedents. Each of these can be another relationship, entity, agent or communication act. The determiner has one antecedent and this can be an agent, entity, relationship or communication act. Step four, utilizes the connectivity rules and associate the various nodes with their dependents, creating a formation known as semantic units. Finally, in step five there is an attempt to connect all the units together to form the ontology chart. While applying MEASUR semantic analysis tends to be a manual process, there have been some attempts to auto-generate ontology charts from text documents with the help of dictionaries16. Our work adopts this research and attempt to conceptually investigate its
Vol 9 (47) | December 2016 | www.indjst.org
applicability in the semantic understanding of the various virtual and computer vision identified objects in a mixed reality environment.
1.2 Related Works This section gives an overview for existing application and related works. A number of computer vision applications have been applied by a number of devices17 such as Google glass and Microsoft Hololens for identifying objects18 from the real world and provide some information about these objects. Such information includes their name or identifier, shape, color, approximate position as well as related information from the web. Glassware technologies are available with a variety of AR and MR and have been used in a number of applications such as educational applications for enhancing the communication efficiency between teachers and students in the classrooms19. This technology can identify objects from the real world via image recognition and identify its name. That information can then be used for conducting Google search and retrieving more information about this object. However, only limited publicly available relevant information is provided as the system has no real understanding of the specific object. Most technologies are using a similar approach and have a limited semantic understanding of the various objects in the mixed reality environment. Instead of relying solid on computer vision approaches and web searches, we will gather the identified and virtual objects and apply an approach similar to16. The research presented in16 demonstrated how an ontology chart can be auto generated from a natural language text in a four steps approach with the help of a dictionary and a table of semantic units. In the first step the system reads the text sentence by sentence in an attempt to detect words that exist in a predefined dictionary. The dictionary is structured as a three columns table. The first column is a list of words with similar semantic meaning, as they may appear in the text. The second column stores the generic term for these words and the third column contain the corresponding category such as agent, entity, relationship, communication act and determiner. Identified words were copied in a list as potential nodes, substituted with generic words and assigned to a category based on the dictionary. In the second step the system will attempt to produce semantic units by checking if the nodes match the nodes participating in semantic units in the database. For example if we have nodes, per-
Indian Journal of Science and Technology
3
Understanding the Semantics of a Mixed Reality Environment
son, “works for”, “organization” and in the database there is a semantic unit that has “works for” as dependent and “person” as an antecedent the system will link them in the same way. If not found in the database, then the system will attempt to connect them based on their position in the sentence of the source text and the connectivity rules. The same approach will be repeated for connecting the semantic units together and forming the ontology chart. The main drawback of this approach is that it requires a huge dictionary in order to work. In our approach we will consider as candidate nodes, the virtual objects and the objects identified by the computer vision approach, and attempt to auto generate the ontology chart similar to16. Additionally, each category will have some predefined actions. For example, an agent can communicate and so on. Some particulars will also have some actions associated with them. For example, the particular wooden desk, can accept virtual objects on its top.
1.3 Solution Design 1.3.1 Scenario Human user is looking via a mixed reality compatible screen (head mounted display, mobile phone, tablet) to various real world objects. The system recognizes these objects and allocates unique identifiers to them, a unique name such as desk. The user can also add virtual objects in the environment. The list with all the objects is then passed to our system. The questions that remain to be answered are: • How the ontology chart can be auto generated? • How the system can make use of the ontology chart and allow the user to interact with the environment? The proposed solution will try to answer the above questions.
1.3.2 The Proposed Solution In the first part of our proposal we will try to answer the first question. Our approach requires a dictionary and a database of ontology charts similar to16. A difference however is that our dictionary has two columns instead of three. This is because in our approach there is no need for similar words as the existing computer vision approaches can provide the identification of the various objects and the virtual objects are automatically added. Usually mixed 4
Vol 9 (47) | December 2016 | www.indjst.org
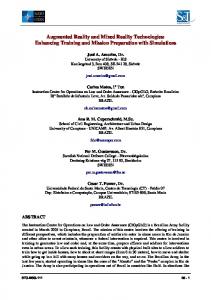
reality is used within a close environment such as a room. The system can be trained so that it can recognize all the objects in that room. Also, this solves the problem of requiring huge dictionaries with similar words, increasing the applicability of our approach. Figure 3 provides an overview of our approach.
Figure 3. The proposed solution.
At the beginning the user has to look around the room. With the help of computer vision technologies, various objects will be identified. Additionally, the user can chose to add virtual objects. These virtual objects will also be considered as objects. Once all the objects have been identified, the system will check for each object, if it exists in the database. If it exists, it will be associated to a category such as agent, entity, relationships or determiner. If it does not exist, then the system will request input from the user. Our primary focus will be on identifying agents, entities and their determiners (similar to properties such as color, dimensions, etc.). Relationships are useful but hard to identify. Once all objects have been assigned to categories, the system will try to form semantic units by looking at the database of semantic units for similar formations. If similar formation not found, the system will attempt to auto-connect the nodes to semantic users taking into account the connectivity rules, but it will again depend on the feedback of the user to validate the auto generation. Once the correct user validated semantic units are generated, the system will store them in the semantic unit’s database and then attempt to autogenerate the ontology chart. The auto-generation will be based on the information stored in the semantic units’ database, identical to the process defined in16. The system will look for identical nodes in different semantic units. If two or more semantic units contain identical nodes, then these nodes will be merged and serve as connection points between the semantic units. This process contin-
Indian Journal of Science and Technology
Georgios Tsaramirsis, Hassanin M. Al-Barhamtoshy and Anas Fattouh
ues recursively until there are no more semantic units that can be connected. In case those semantic units are left without connection, the system will request assistance from the user. Once again the correct semantic units will be stored in the semantic database making the system more and more intelligence. The output of the system will be an ontology chart that has both the real and the virtual objects connected together, capturing this way the semantics of the new reality. In regard to the second question, ontology charts give us some information about the objects and their association via the ontological dependencies and associations between the nodes. However, we propose a new matrix that will associate each object with a set of actions that can be performed by the system. These associations can be at the universal or particular level. At the universal level, we can add a number of activities that all particulars of that universal will inherit. For example, we can say that agents can communicate. So if the system identifies a particular agent, e.g. Mr. George, it will enable the option of communication. For example, in case of an entity desk, we can associate the action “place virtual object” that will place a virtual object on the top of the desk. That will allow the system to be able to place virtual objects on the top of any particular desk. Additionally the system should allow the association of actions with particulars. For example, a specific desk called “wooden desk” can perform a specific action (e.g. change color). This way the system will allow the user to have even more interaction, something that can potentially increase the usability of mixed reality technologies.
2. Discussion Using MEASUR Ontology Chart to link together objects from the real and virtual worlds is one of the main novelties of this work. Even if the system will require input at the beginning, the more it is used the more intelligent it will be, up to a point where it can auto-generate the ontology charts with minimum or no human input. This is possible because mixed reality is mainly applied to a small real world environment e.g. a room. Associating actions to universals and particulars will also add the very much desired degree of interaction between the user and the mixed reality environment. The system will require some training at the beginning but after some time it will be more intelligent. One of the limitations is that it is not clear how the system will behave with large num-
Vol 9 (47) | December 2016 | www.indjst.org
ber of similar data as it can cause potential confusion to the system. This cannot be tested as currently there is no implementation of this proposal. This is also another limitation of this work.
3. Conclusion and Future Work This paper proposed the use of MEASUR Semantic Analysis method for capturing the semantics of a mixed reality environment. In more detail, the paper provided answers to two key questions: How can an ontology chart that represents the mixed reality environment, generated and how the system can take advantage of it and increase the user interactions with various objects of the mixed environment. The first question was answered by adopting an approach similar to16 for auto-generating ontology charts. The main difference was that the candidate nodes were actual nodes identified from the real world or virtual objects added by the user. These nodes were processed with the help of a dictionary, a database of semantic units and in some cases some input from the user. The output was an ontology chart that linked together nodes from both the real and the virtual world. The second question was answered by the association of actions to different types of universals and particulars. This way the system had an understanding of how to interact with the various objects. This paper presented the theoretical background of how semantic analysis can be applied in mixed reality environment. However, the main limitation of this work is that currently there is no implementation of this proposal hence it cannot be properly evaluated. In the future, we will try to implement this work, train the system with a large number of data and test it with different scenarios. Even if this paper is not a complete solution, due to lack of implementation, it is the believe of the authors that it is pointing to a direction that is worth to be investigated.
4. Acknowledgements We would like to thank Dr. Seyed M Buhari and the Faculty of Computing and IT of King Abdulaziz University, PO Box 80200, Jeddah 21589, Saudi Arabia for their continuous support to our mixed reality research.
5. References 1. Hupont I, Gracia J, Sanagustin L, Gracia MA. How do new visual immersive systems influence gaming QoE? A use
Indian Journal of Science and Technology
5
Understanding the Semantics of a Mixed Reality Environment
2.
3.
4.
5.
6.
7.
8. 9.
6
case of serious gaming with Oculus Rift. 7th International Workshop on Quality of Multimedia Experience (QoMEX); Pylos-Nestoras. 2015. p. 1-6. Schops T, Engel J, Cremers D. Semi-dense visual odometry for AR on a Smartphone. IEEE Science and Technology Proceedings of International Symposium on Mixed and Augmented Reality; Munich, Germany. 2014 Sept 10-12. p. 145-50. Edey JK, Seaborn K, Branje C, Fels DI. Powered to play: A mixed reality game for people driving powered chairs. IEEE Science and Technology Proceedings of International Symposium on Mixed and Augmented Reality; Munich, Germany. 2014 Sept 10-12. Rodrigue M, Waranis A, Wood T, Hollerer T. Mixed reality simulation with physical mobile display devices. IEEE Virtual Reality Conference; Arles, France. 2015 Mar 23-27. p. 105-10. Hofmann R, Seichter H, Reitmayr G. A GPGPU accelerated descriptor for mobile devices. IEEE Science and Technology Proceedings of International Symposium on Mixed and Augmented Reality. Atlanta, Georgia. 2012 Nov 5-8. p. 289-90. Chang K, Chen C. Design of the augmented reality based training system to promote spatial visualization ability for older adults. VAMR, LNCS 9179; In: Shumaker R, Lackey S, editors. Switzerland: Springer International Publishing; 2015. p. 3–12. Jung S, Hughes CE. Pilot study for telepresence with 3d-model in mixed reality. VAMR, LNCS 9179. In: Shumaker R, Lackey S, editors. Switzerland: Springer International Publishing; 2015. p. 22–9. Stamper R. Social norms in requirements analysis: An outline of MEASUR. 1994. p. 107-39. Ades Y, Umar FB, Poernomo I, Tsaramirsis G. Mapping ontology charts to UML: An SNF preserving transformation. ICOS; 2007.
Vol 9 (47) | December 2016 | www.indjst.org
10. Bonacin R, Calani Baranauskas MC, Liu K. From ontology charts to class diagrams: Semantic analysis aiding systems design. ICEIS (3); 2004. p. 389-95. 11. Poernomo I, Tsaramirsis G, Zhang N. Coarse-grain architectures from business requirements: An organisational semiotics approach. Proceedings of ICISO; 2009. p. 124. 12. Poernomo I, Tsaramirsis G, Yamin M. Ontology based uml2 component architecture generation. ICISO; India. 2010. 13. Yamin M, Zhang N, Nistazakis M, Tsaramirsis G. Transformation of semantic analysis to com+ business requirements using MDA approach. Journal of Service Science and Management. 2010; 3(1):67-71. 14. Tsaramirsis G, Poernomo I. Prototype generation from ontology charts. 3rd International Conference on Information Technology: New Generations; 2008. p. 11778. 15. AlBar AM, Mohsen A, Tsaramirsis G. Business process modeling notation for MEASUR’s. 2nd International Conference on Semantic Analysis: Computing for Sustainable Global Development (INDIACom); 2015. 16. Barnawi A, Tsaramirsis G, Buhari SM, Aserey NAS. Natural language to ontology chart: Business process modeling notation for MEASUR’s. 3rd International Conference on Semantic Analysis: Computing for Sustainable Global Development (INDIACom); 2016. 17. Avila L, Bailey M. Augment your reality. IEEE Computer Graphics and Applications. 2016 Jan-Feb; 36(1):6-7. 18. Taraghi B, Babaei M. Object detection using Google Glass. IEEE Conference on Open Systems (ICOS); Melaka. 2015. p. 97-102. 19. Berque DA, Newman JT. Glass Class: Exploring the design, implementation and acceptance of Google glass in the classroom. VAMR, LNCS 9179. Shumaker R, Lackey S, editors. Switzerland: Springer International Publishing; 2015. p. 243–50.
Indian Journal of Science and Technology