Understanding Video Quality and its use in Feedback Control Xiaoxiang Lu, Ramon Orlando Morando and Magda El Zarki The VIP Lab, Dept. of ICS, UC Irvine Irvine, CA 92697 {lxiaoxia,rmorando}@ics.uci.edu,
[email protected] ABSTRACT There has been an increased interest in adaptive video quality control and dynamically adjusting the output video bit rate based on the status of the network. However, network-level performance parameters cannot accurately reflect the video quality perceived by the end users. Our goal is to investigate an adaptive perceptual video quality control mechanism based on an application-level perceptual video quality scheme. In this paper we investigate perceptual objective quality assessment technologies and use them to exploit the relationships between perceptual video quality, output bit rate, and quantization scales of video encoders. We also implemented a real time Video over IP (VIP) network application that uses a feedback channel to relay measurements, taken at the end user, to the source side, to enable the calculation of the perceptual video quality degradation caused by IP packet loss. Using this experimental setup, we were able to investigate appropriate rules for adaptive perceptual video quality control based on an application-level perceptual video quality scheme.
1. Introduction The current Internet can only provide best-effort services that do not guarantee network resources (e.g. bandwidth) and performance (e.g. quality). Real-time video applications, such as video teleconferencing and long distance learning, are becoming popular in IP based networks. Real-time video applications have specific characteristics that are different from traditional streaming video applications. Traditional streaming video applications allow users to download the compressed video and then play it back. The compressed video can be transmitted via a reliable channel such as a TCP/IP channel because the local play back takes place only after the whole compressed video is downloaded and saved on a local disk. However, TCP/IP channels are not suitable for real time video applications because they cannot guarantee end-to-end delay due to the error control, flow control and congestion avoidance mechanisms, and the delays are very variable. Real Time Protocol (RTP) is a protocol specifically designed for real time applications and it operates over a UDP channel. The video source agent delivers the video data continuously to the network regardless of the network state. Congested network conditions will result in lost video packets and which will produce poor quality video. Therefore, near to real time video quality control is a necessity for real time streaming video applications if quality of the contracted service is to be maintained for a majority (90%) of the time. Packet losses can result in a picture quality that can be a lot more irritating then a slightly degraded quality encoded video stream. Rapidly fluctuating quality is also to be avoided, the eye adapts to a specific quality after a few seconds and it becomes very annoying if the viewer has to adjust to a varying quality over short time scales. One possible approach to the problem of network congestion and resulting packet loss is to use feedback mechanisms to adapt the output bit rate of the source encoders (in other words, adapt the video quality) based on obtained (implicit or explicit) information of the network state. Several bit rate control mechanisms based on feedback have been presented in the last few years [1][3][4][5][6][7][8]. Since Real Time Control Protocol (RTCP) provides network-level QoS monitoring and congestion control (packet loss, round trip delay, and jitter), many applications use RTCP to provide control mechanisms for transmission of video over IP networks. However, the network-level QoS parameters provided by RTCP protocol are not video content-based. For example, assume that two video packets are lost during the transmission. One contains important information related to the video synchronization code, whereas the other only contains bits for rebuilding certain video blocks. Obviously, the impact of the first packet on
1
the reconstructed video quality is much worse than that of the second packet. But RTCP cannot distinguish the difference since it does not indicate the content of the packets. That is to say, the networklevel QoS parameters provided by RTCP don’t reflect explicitly the perceptual video quality. Over the past few years, video quality evaluation and measurement schemes have been developed [2][9][10][11][12]. Some objective quality assessment techniques have been devised to provide perceptual video quality measures. The goal of our work is to investigate the proposed video quality measurement schemes and their use in providing video quality degradation performance measures caused by the network state to the source encoder. Based on this feedback information, the application can control the source video encoders, i.e., control is based on the perceptual video quality instead of on only network-level QoS parameters. Our study involved two steps. The first step was to understand the relationship between video quality, compressed video bit rate, and encoder parameters (e.g. quantization scales Q) by using perceptual objective video quality assessment schemes. Once we understand the relationship we can exploit this information for our proposed adaptive perceptual video quality control scheme. For this step, we conducted off-line experiments, i.e., we stored the original video and the reconstructed video, and then computed the video quality degradation by comparing the original and reconstructed videos. We also computed the output bit rate of the compressed video as the rate affects the network status (high bit rate could cause network congestion) and we also looked at the variance in the quality of the compressed stream. The second step is to exploit the applicability of using objective video quality assessment schemes to provide the feedback information for our proposed adaptive perceptual video quality control scheme. We have implemented an end-to-end real-time application involving a TCP based feedback channel that transmits the perceptual video quality parameters from receiver to sender. We have done some live real time experiments, i.e., the application, based on the feedback information of perceptual quality degradation, can dynamically adjust the output bit rate of the video encoder that is delivered to the network. We compared the perceptual quality degradation caused by the network in the following three cases. (1) Simple VBR without feedback control: We fixed quantization scale as 4 and disabled the feedback control. (2) VBR with feedback control: We set the quantization variation range between 4 and 8 and adaptively changed its value according to feedback control. (3) Constrained VBR with feedback control: In addition to VBR with feedback control, we also delimited a maximum output bit rate of the encoder. A study at Stanford University [19] looked at some similar problems. Their goal was to maintain the quality of encoded video at a constant level and their feedback loop is internal to the local encoder buffer. Our feedback loop is extended to the video receiver that is remotely located across an IP network, thus our feedback information reflects the effect of network congestion. Our goal is to minimize the perceptual video quality degradation caused by losses due to network congestion. This paper is structured as follows: in Section 2, we introduce the ANSI objective video quality measuring standards T1.801.03-1996 [16] and our implementation thereof. In Section 3, we present results related to the relationship between video qualities, compressed video bit rate, and quantization scales for MPEG-2 encoders1 . In Section 4, we present the integration of an ANSI objective quality measurement scheme into a real-time streaming video application, which is being used to test the adaptive video quality control scheme based on perceptual video quality. In Section 5, we discuss the need for improving the ANSI objective quality measurement scheme to accurately assess the quality degradation caused by packet loss, the current tools are designed primarily to test coder quality. In Section 6 we present our conclusions and future work.
1
We used the software based encoder of Ligos Inc. 2
2. Video quality assessment schemes and the ANSI standards T1.801.03-1996 Video quality assessment technologies can be classified into two categories: subjective video quality assessment schemes and objective ones. Subjective video quality assessment is the most reliable video quality measurement method. A group of viewers is selected and gathered in a room, the environment of which is specified by the ITU-T Recommendation P.910 [13]. The source video and the processed video are presented in pairs to the viewers who are expected to grade the video quality. Subjective video quality measurement has several disadvantages. It requires a special viewing room and equipment; it needs a large group of people to view the video; it requires a large amount of post processing on the video data. In conclusion, subjective video quality measurement cannot provide real-time in-service quality monitoring for real-time video applications. Objective video quality measurements, although not as accurate, can be conducted in the background without intruding on the end user. Objective video quality estimation software processes the video signals and produces the quality evaluation results. One traditional objective video quality measurement, Peak Signal to Noise Ratio (PSNR), has been widely used in many applications to assess video quality. The advantage of PSNR is that it is very easy to compute. However, PSNR does not match well to the characteristics of human visual system [9]. Perceptual objective video quality assessment technologies try to achieve a high correlation with subjective video quality assessment without losing the advantages of that objective quality assessment has to offer. Stefan Winkler presented his Vision Model in [9]. This model simulates the human visual system and achieves a high correlation with subjective video quality assessment, but it is not capable of inservice measurements and requires offline processing. The ANSI objective video quality standards T1.801.03-1996 [16] as well as the metrics developed by Institute for Telecommunication Sciences (ITS) [12] capture the relationship between the measurable video quality parameters and perceptual quality distortion (blurring, tiling, noise, etc.). We chose to adopt the ITS model for our implementation of an objective quality assessment tool for the following important reasons: (1) This model accurately emulates subjective quality assessment (high correlation). (2) This model works well for a wide range of bit rates, from very low bit rate applications to very high bit rate applications. (3) This model is computationally efficient, compared to the other models. (4) The quality parameters consume very small bandwidth, thereby making the model well suited for in-service quality evaluation in end-to-end real-time applications. We briefly describe our implementation of the perceptual objective video quality assessment tool here. Our perceptual objective video quality measurement tool is based on the ANSI objective video quality standards T1.081.03-1996 and the Video Quality Metrics (VQM) proposed by ITS. First, we extract the quality features that represent the perceptual quality from sequences of the original video and the reconstructed video. Second, we compare the quality features from the original and the reconstructed video sequences to produce perceptual video quality measures. Finally, we compute the final perceptual quality scores (denoted as “Join”) by combining the video quality parameters with appropriate weights. “Join” values represent the video quality degradation (reconstructed video qualit y vs. original video quality). We have crosschecked our implementation and test results with the VQM tool developed by ITS. The crosscheck ensures that our perceptual objective assessment tool accurately emulates subjective video quality assessment.
3. Relationship between video quality, compressed video bit rates, and quantization scales The first step of our work is to understand the relationship between video quality, compressed video bit rate, and quantization scales by using the perceptual objective video quality assessment tool. Although it is well known that the quantization scale has a great impact on the output compressed video bit rate and
3
video quality, the quantitative relationship between video qualities, output bit rate and quantization scales has not been studied in detail. Therefore, we use the perceptual objective video quality measurement tool, to obtain quantitative relationships that will help us design the appropriate mechanism for adjusting the video quality and output bit rate given feedback information regarding video quality. 3.1 Experimental Results The experiments begin with a simple Variable Bit Rate (VBR) encoding mode. That is, we fix the quantization scales for all the frames of the video sequence. With the same quantization scales, the “complicated” frames (for example, frames with high motion) produce more VLC (Variable Length Coding) bits than the “simple” ones (for example, frames with low motion). Therefore, the output bit rate of the encoder is variable whereas the video quality is fairly constant. (See the values given in Table 1 below). We fix the quantization scale (Q) to be 4, 8, and 12 for a particular video sequence. We calculate the output bit rates and perceptual video quality (represented by “Join”). The sample video we present in this paper is 40sec long video clip captured from a movie 2 . The results are shown in Figure 1. The number on the horizontal axis represents time with 200ms per tick. The plot VBR_Bitrate shows the output bit rates, and plot VBR_Join shows the perceptual quality 3 . The results confirm that when the quantization scale is constant, compressing with a smaller quantization scale produces a very high output bit rate and better video quality. From these charts, we also find that the video quality does not vary much for any fixed quantization scale (4,8, or 12), but the output bit rates vary dramatically (see Table 1). For example, for Q=4, the output bit rate fluctuates 7.212Mbps (from 7.228Mbps to 14.440Mbps) with an average bit rate of 10.053 Mbps. We then repeat the experiments using Constant Bit Rate (CBR) encoding for the same video sequence. To compare the results fairly, we fixed the output bit rates of the CBR encoder to the corresponding average bit rates of the VBR encoding mode. For example, the average bit rate of the video sequence is 10.053Mbps in VBR mode with Q = 4. Thus, we encode the video sequence in CBR mode and fix the output bit rate to 10.053Mbps. Similarly, we encode the video sequence in CBR mode and fix the output bit rate to 3.813Mbps which is the average bit rate of the video sequence in VBR mode with Q=8, and similarly for Q=12 we encode it at a rate of 2.302Mbps. We show the results of the CBR encoding mode in Figure 2. Plot CBR_Bitrate shows the output bit rates and plot CBR_Join shows the perceptual quality (Q4, Q8, and Q12 indicates which VBR video the CBR video corresponds to). Again from the results, we justify that a higher output bit rate means better video quality. We also find, that in CBR mode, the output bit rates are almost constant but the video quality varies quite a bit more (see Table 1). For instance, for Q12, the worst quality is 0.535747 with an average quality of 0.458771. Both the VBR and CBR encoding modes have their disadvantages. The network community does not like VBR video sources [14] because a highly varying bit rate is not easy to deal with. CBR video is easily managed by networks, but the perceptual video quality fluctuates quite a bit more. We therefore investigate a compromise between pure VBR and CBR, namely, constrained VBR encoding mode. In constrained VBR mode, we limit the maximum of the output bit rate. For instance, we set the maximum bit rate to 11.598Mbps for VBR video sequence with Q=4 (the average bit rate plus one std_dev, see table 1). From the results shown in Figure 3, constrained VBR mode is able to produce a less varying output bit rate with a video quality that is close to that of the pure VBR mode. In Table 1 we calculate the average and standard deviation of the perceptual quality for the different encoding modes. The average perceptual video quality is fairly similar for VBR and constrained VBR and 2
The video sequence consists of a group of people talking and gesturing with the camera switching from one speaker to another for the last 6 secs. 3 The range of “Join” is (0,1) - “1” represents the worst quality and “0” represents excellent quality 4
slightly worse for CBR. The perceptual quality fluctuation of CBR is the largest and the perceptual quality fluctuation of VBR is the smallest as expected. Smallest perceptual quality fluctuation and low varying output bit rate is a goal for streaming video over packet networks. Given this, the constrained VBR encoding mode is the best choice since its bit rate is fairly well behaved and the fluctuations in perceptual quality are fairly low. VBR_Bitrate Q=4
Q=8
VBR_Join Q=4
Q=12
16000
Q=8
Q=12
0.6
14000
0.5
12000 0.4 Join
10000 8000 6000
0.3 0.2
4000
0.1
2000 0
0 1
23 45
1
67 89 111 133 155 177 199
23
45
67
89 111 133 155 177 199
Time(200 msecs)
Time(200 msecs)
Figure 1. Output bit rate and perceptual quality for VBR
CBR_Bitrate Q4
Q8
CBR_Join Q12
Q4
16000
Q12
0.6
14000
0.5
12000 0.4
10000 Join
Bitrate(kbps)
Q8
8000 6000
0.3 0.2
4000 0.1
2000 0
0 1
23 45 67 89 111 133 155 177 199
1
23
Time(200 msecs)
45
67
89 111 133 155 177 199
Time(200 msecs)
Figure 2. Output bit rate and perceptual quality for CBR
5
Constrained_VBR_Bitrate Q4
Q8
Constrained_VBR_Join Q12
Q4
16000
Q12
0.6
14000
0.5
12000 0.4
10000 Join
Bitrate(kbps)
Q8
8000 6000
0.3 0.2
4000 0.1
2000 0
0 1
23 45 67 89 111 133 155 177 199 Time(200 msecs)
1
23 45 67 89 111 133 155 177 199 Time(200 msecs)
Figure 3. Output bit rate and perceptual quality for constrained VBR Join PSNR Bit Rate Average Std_dev Average Std_dev Average VBR_Q4 0.202004 0.002655 35.91496 0.44465 10053 VBR_Q8 0.317597 0.004489 32.96177 0.52643 3813 VBR_Q12 0.409873 0.004677 31.42474 0.67014 2302 CBR_Q4 0.204929 0.003747 35.72485 0.98738 10054 CBR_Q8 0.329049 0.024604 32.80154 1.15316 3815 CBR_Q12 0.458771 0.058536 31.36981 1.56755 2307 Constrained_VBR_Q4 0.206998 0.003203 35.78648 0.83835 10066 Constrained_VBR_Q8 0.320873 0.010033 32.87081 0.87554 3829 Constrained_VBR_Q12 0.412427 0.016802 31.38822 0.92129 2326 Table 1. Quality and Bit rate: average and standard deviation comparison
Std_dev 1545 1127 889 483 408 374 947 736 647
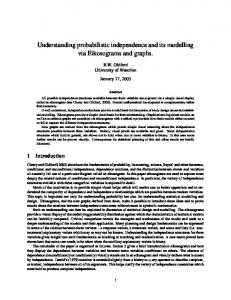
4. Using ANSI objective quality measurements for a feedback control mechanism for realtime video applications Figure 4 shows the architecture of an end-to-end real time video application that we have implemented to study adaptive quality control. Our application runs under the Linux operating system. On the sender side, the encoder consists of a hardware PCI plug-in video board produced by Streammachine. This video board captures video from a variety of sources (camera, DVD player, live TV feed, etc.) and compresses it using the MPEG-2 standard. The encoded video stream is passed through the PCI bus to the main memory of the computer. We then encapsulate the video streams into RTP packets based on the RTP payload of MPEG-2 elementary video streams [17]. Then the RTP packets are delivered to the transport layer via a UDP socket as shown in Figure 4. At the same time, the compressed video stream is decoded by a local decoder and the decompressed stream is processed to extract the video quality features of the transmitted stream. The local decoder is based on a software MPEG-2 decoder developed by LiViD [18]. On the receiver side, the decoder is based on the same software as the local decoder on the sender side. It unwraps the RTP/UDP video packets and plays back the video. The decompressed video is processed to extract the video quality features of the received stream. These quality features are sent back to the sender
6
side through a feedback channel as shown in Figure 4. The use of TCP for the feedback channel guarantees the reliable transmission of the perceptual quality features. However it remains to be seen whether the latency of TCP could hamper the performance of the control mechanism and in that case a UDP channel will be tested with forward error correction (FEC) applied to the data for reliability. On the sender side, we now have the local quality features and the remote quality features that can be used to calculate the quality degradation. Using the results of the quality measurements, we can adjust the output bit rate of the encoder by changing the quantization scales. For example, if the video quality is severely impaired due to network congestion, we lower the output bit rate, by increasing the quantization scale, this in turn will relieve the network congestion. This should result in a better quality video as the degradation is controlled as opposed to it being subjected to the losses imposed by the network.
RTP/UDP/IP video data channel
Video input Enc
oder
Decoder
Video output
local d ecoder
Network local quality fe ature extractor TCP/IP
link 3
link 2
video quality degradation calculator
feedback channel
link 1 video quality feature extractor
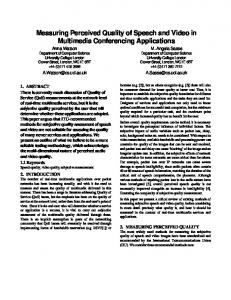
Figure 4. An end-to-end real time video application with a feedback control channel 4.1 Some implementation issues 1. We focus on the video quality degradation caused by the network not by the encoding algorithms. The local decoder as well as the local quality features extractor captures the video quality before transmission over the network and not before encoding. One of the advantages of our feedback control mechanism is that it is based on perceptual video quality degradation caused by the network. The impact on the perceptual video quality caused by packet loss is much more irritating to the human visual system than that caused by the encoding algorithm. Figure 5 shows two pictures, the first of which is degraded by packet loss (without error concealment processing) and the second is degraded by the encoding algorithm. In Picture-1, the packet lost contains the data of one slice [15]. In Picture-2, the encoding noise is produced by setting the quantization scale to 31 (the maximum allowed by our software encoder). Without error concealment, it is obvious that Picture-1 is not going to be well received by a viewer. Therefore, if packet losses occur that result in such picture degradation, increasing the quantization scale to reduce the bit rate and thereby network congestion and packet losses, is a much more effective method to enhance the viewing quality.
7
Picture-1 Picture-2 Figure 5. Quality degradation caused by 1) packet loss and 2) compression algorithm 2. We extended the objective quality measurement tool to a distributed version because we extract the quality features separately in the sender side and the receiver side. A problem that arises when doing this is the synchronization (alignment spatial and temporal) of the sender and receiver sides. For the spatial alignment, the sender and receiver sides should use the same regions of the pictures to extract the quality features. Spatial alignment can be easily achieved by agreeing on the same sub-region of the pictures. For temporal alignment, the quality features to be compared from the sender and receiver side should have the same temporal history. Particularly, if the temporal history is indicated by a sequence number, we should compare the quality features of those frames with the same sequence number on both the sender side and the receiver side. That is, the first frame on the sender side is compared to the first frame on the receiver side, the second frame on the sender side is compared to the second frame on the receiver side, and so on. Temporal alignment is more difficult to achieve because a lost packet may contain the “picture header code” [15] that tells the receiver that a new frame is starting. Our solution to detect the “picture header code” loss to assume that each video frame is composed of 16 slices. When encapsulating the compressed video streams to RTP packets, we follow the rules: “the picture header code” together with the first slice (slice1) is encapsulated in one RTP packet. The next 15 slices are encapsulated separately into the next 15 RTP packets in consecutive order. Since there is a sequence number for each RTP packet in RTP header we can tell is an RTP packet is lost and by use of a counter we can detect exactly which slices the lost packets correspond to. 3. Another important point in our application is that we broke the rate -control loop in the MPEG-2 encoder. In general, MPEG-2 encoders use a local buffer to control the output bit rate. We replace this local feedback loop with another feedback loop that is indicated via link 1, link 2, and link 3 in Figure 4. The new loop back reflects the impact of the network status on the perceptual video quality. Therefore, the quantization scales of the encoder can be adjusted based on the network status and perceptual video quality degradation. If packets are lost and thereby the perceptual video quality is damaged, we change the quantization scales to larger values to lower the output bit rate (the Streammachine video board that we have allows us to change the quantization scales dynamically in real-time). The feedback control is based on the following algorithm: we use a sliding window to evaluate the quality degradation. The window size is W that means that we calculate the quality degradation W times (in terms of frame numbers, one window contains W × 6 frames because we do one quality comparison for every 6 frames). q i denotes the first comparison point in the sliding window and q i +W denotes the last comparison point in the sliding
8
window. q s denotes the threshold for the quality degradation, i.e., the quality is not seriously degraded if q i is smaller than q s and the quality is seriously degraded if q i is greater than q s . low _ q denotes the number of occurrences of “poor” quality in the sliding window. Q is the value of the quantization scale we expect to set for the encoder. Qmin and Qmax delimit the variation range of the quantization scales. Below we formally describe the algorithm:
if (q i +W ≥ q s & & q i < qs ) low _ q + +; elseif (q i +W < q s & & q i ≥ qs ) low _ q − −; if (Constrained _ VBR & & Bitrate ≥ Bitratemax ) Q = (+ + Q > Qmax ) ? Qmax : Q; if (low _ q ≤ N 1 ) Q = (− − Q < Qmin ) ? Qmin : Q; if (low _ q ≥ N 2 ) Q = (+ + Q > Qmax ) ? Qmax : Q; 4.2 Experimental results We have conducted some experiments in our local test bed, in which several local routers and switches connect the video sender and receiver. We also have tested on the Internet remotely from the University of California, Irvine to the University of Pennsylvania in Philadelphia. One interesting thing we discovered was that traversing the Internet, the packet loss ratio was extremely low (sometimes no packet loss at all for a long period of time). We were therefore forced to use a traffic generator to load the paths between the sender and the receiver to force some latency and jitter in the packet arrival stream. For now, we manually produce packet loss on the receiver side to observe the perceptual quality degradation at different packet loss ratios. To generate randomly different packet loss percentages, we used a CBR video streaming source to load the path between the sender and the receiver and applied a traffic generator with particular parameters to the same path forcing losses. We calculated the loss rate and stored that information together with the traffic generator parameters for further use. For instance, we configure a set of parameters of the traffic generator to produce a particular traffic stream and then deliver a CBR video stream form a sender to a receiver. We keep track of the dropped packets and calculate the packet loss ratio. In our experiments, we chose three different sets of traffic generator parameters that respectively resulted in packet loss ratios of 1.62%, 0.52%, and 0.23%. We then applied this to our video feedback scenario. Table 2 shows the experimental results by comparing simple VBR without feedback control, VBR with feedback control, and constrained VBR with feedback control. In constrained VBR, we set the maximum bit rate equal to the average bit rate plus the standard deviation of the bit rate of the VBR with feedback control stream. For instance, we set the maximum bit rate for the constrained VBR to 2260 = 1498 + 762 Kbps for a packet loss ratio=1.62%. In our experiments, we used W = 5, q s = 0.2, Qmin = 4,
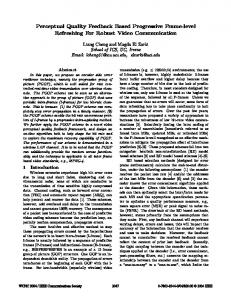
Qmax = 8. The reason we chose the sliding window size to be 5 (30 frames) is because 30 frames contain at least one complete GOP (group of pictures) and the error propagation remains within the GOP. In Figure 6, we also present the quantization scale distribution for VBR with feedback control and constrained VBR with feedback control. From Table 2, we can see that VBR with feedback control shows better results than for the simple VBR without feedback control case while it produces a lover bitrate. Along with the packet loss ratio increasing, more advantages are obtained from feedback control. We can
9
also observe that constrained VBR with feedback improves the received video quality over VBR with feedback.
Loss ratios 1.62% 0.52% 0.23%
Loss ratios 1.62% 0.52% 0.23%
VBR with feedback control Quality Bit rate Ave. Ave./stdv. 0.040592 1498/762 Kbps 0.033159 1526/766 Kbps 0.010090 1673/774 Kbps VBR with feedback control Quality Bit rate Ave. Ave./stdv. 0.040592 1498/762 Kbps 0.033159 1526/766 Kbps 0.010090 1673/774 Kbps
Quant. Ave. 4.69646 4.58389 4.14262
Quant. Ave. 4.69646 4.58389 4.14262
Simple VBR without feedback control Quality Bit rate Ave. Ave./stdv. 0.054330 1736/787 Kbps 0.039951 1730/783 Kbps 0.010449 1723/781 Kbps
Quant. 4 4 4
Constrained VBR with feedback control Quality Bit rate Quant. Ave. Ave./stdv. Ave. 0.038906 1370/585 4.87654 Kbps 0.031993 1397/590 4.77088 Kbps 0.009087 1502/565 4.37371 Kbps
Table 2. VBR without feedback vs. VBR with feedback vs. constrained VBR with feedback
Figure 6. Quantization scale distribution in VBR vs. Constrained VBR 5. Future Work The ANSI objective video quality standards T1.801.03-1996 and the metrics published in the SPIE paper [12] by ITS have been primarily developed for video quality measurement of encoders. With our experiments we have found that we need to improve the ANSI objective video quality standards T1.801.03-1996 and the metrics to make them more suitable for computing the perceptual video quality degradation caused by packet loss. The reason is that the type of degradation caused by packet loss is very transient in nature and covers only part of the picture (for example one slice). While the human visual
10
system is very sensitive to this type of error, the current objective quality parameters, which were not designed to measure this type of error, are not. The solution is to find the optimal thresholds [12] for the objective quality parameters to detect this type of error. For that we have to conduct extensive subjective quality tests using various thresholds to find the optimal values. We will collaborate with researchers at ITS to conduct such a study using long video clips 4 with transient quality degradation caused by packet loss. The current perceptual objective quality assessment tool will be improved to more accurately calculate transient quality degradation caused by packet loss. For our current real-time video application, we used error detection functions and some simple error concealment and recovery functions. It has been shown that error concealment and recovery technologies can improve video quality substantially (depending on the complexity of the algorithms used). Therefore, one part of our future work will be to investigate more complex error concealment and recovery technologies that are suitable for real-time video applications over IP networks that are subjected to particular types of data losses (e.g., losses of a complete slice in either an I, P or B frame). We will also investigate other types of bit rate reduction techniques such as dropping of frames and compare those results to our proposed approach of changing the quantization scale at the soruce. We already have some results that show the bit rate of a stream without a certain percentage of “B” frames and its corresponding perceptual quality.
6. Conclusions In this paper we presented a perceptual objective assessment technique that can be deployed in real time video applications to provide in-service quality monitoring. We exploit the relationship between perceptual video quality, output bit rate, and the quantization scales of the encoder. These relationships provide us with the thresholds for the adaptive control of video quality. We implemented a real time video application that uses perceptual objective measurements to control a source encoder. Our experimental results show that feedback control based on perceptual video quality is a viable solution for adaptive video streaming and quality control over best-effort IP networks. We find that it is necessary to improve current perceptual objective quality assessment technologies to more accurately capture the perceptual quality degradation caused by packet loss. The focus of our future work is to further investigate the feedback control mechanism, especially using different rules for adaptive perceptual video quality control in different network environment such as ADSL, Cable Modem and wireless network.
7. Acknowledgments We would like to thank Stephen Wolf and Margaret Ponsin of ITS, who helped us with the crosscheck of our perceptual video quality assessment tool and will work with us on the enhancement of the tool.
References 1. Jean-Chrysostome Bolot and Thierry Turletti, “A rate control mechanism for packet video in the Internet”, Proceedings of IEEE INFOCOM '94, Toronto, Canada, June 1994. 2. Si Jun Huang, “Principle, benefits and applications of variable bit rate coding for digital video broadcasting, with statistical multiplexing extension”, Proceedings of Broadcast Engineering Conference, Las Vegas, NV, April 1999. 3. Brett J. Vickers, Meejeong Lee, and Tatsuya Suda, “Feedback control mechanisms for real-time multipoint video services”, IEEE Journal on Selected Areas of Communication, vol. 15, no. 3, pp. 512-530, April 1997.
4
Currently the standard for all video quality measurements are conducted on 10sec clips. 11
4. B. J. Vickers, C. Albuquerque, and T. Suda, “Source adaptive multi-layered multicast algorithms for real-time video distribution”, submitted to the IEEE/ACM Transactions on Networking, 1999. 5. Ingo Busse, Bernd Deffner, Henning Schulzrinne, “Dynamic QoS control multimedia applications based on RTP”, Proc. of First International Workshop on High Speed Networks and Open Distributed Platforms, St. Petersburg, Russia, June 1995. 6. Jean-Chrysostome Bolot, Thierry Turletti and Ian Wakema, “Scalable feedback control for multicast video distribution in the Internet”, Proc. of ACM SIGCOMM, London, UK, September 1994. 7. Bernd Girod, and Niko Farber, “Feedback-based error control for mobile video transmission”, Proc. of the IEEE, special issue on Video for Mobile Multimedia, Vol. 97, No. 10, pp. 1707-1723, Oct. 1999. 8. Pao-Chi Chang, Jong-Tzy Wang, and Yu-Cheng Lin, “Adaptive video quality control based on connection status over ATM networks”, IEICE Trans. on Comm., Vol. E82-B, No.9, September 1999. 9. Stefan Winkler, “A perceptual distortion metric for digital color images”, Proc. of the 5th IEEE International Conference on Image Processing (ICIP'98), Chicago, IL, October 4-7, 1998. 10. W. Ashmawi, R. Guerin, S. Wolf, and M. Pinson, “ On the impact of policing and rate guarantees in Diff-Serv networks: A video streaming application perspective”, Proc. of ACM SIGCOMM, San Diego, CA,, 2001. 11. Roger Crooks, “An analysis of MPEG encoding techniques on picture quality”, Tektronix, Inc., June 1998. 12. Stephen Wolf, and Margaret H. Pinson, “Spatial-temporal distortion metrics for in-service quality monitoring of any digital video system”, Proc. of SPIE International Symposium on Voice, Video, and Data Communications, Boston, MA, September 11-22, 1999. 13. ITU-T Recommendation P.910, “Subjective video quality assessment methods for multimedia applications,” Recommendations of the ITU, Telecommunication Standardization Sector. 14. Naoki Wakamiya, and Masayuki Murata, “TCP-friendly video transfer”, Proc. of IEEE International Conference on Multimedia and Expo (II), New York, NY, 2000. 15. ISO/IEC-13818- MPEG2 standards. 16. ANSI T1.801.03-1996, “American National Standard for telecommunications- digital transport of one-way video signals-parameters for objective performance assessment”, American National Standards Institute. 17. Hoffman, D., Fernando, G., Goyal, V., and M. Civanlar, "RTP Payload Format for MPEG1/MPEG2 Video", RFC 2250, January 1998. 18. You can obtain the source code from the web site http://www.linuxvideo.org. 19. Ismail Dalgic, Fouad A. Tobagi, “Constant Quality Video Encoding”, Proc. of IEEE ICC’95, Seattle, Washington, June 1995.
12