Mar 15, 2007 - compactor bypass techniques and indirect diagnosis methods. For this ... Each line being associated with a list of possible fault models. Fig.
Author manuscript, published in "VLSI-SOC'06: 14th IFIP WG 10.5 International Conference on Very Large Scale Integration and System-on-Chip, Nice : (2006)"
Unified Diagnostic Method Targeting Several Fault Models A. Rousset, P. Girard, S. Pravossoudovitch, C. Landrault, A. Virazel
Abstract Fault diagnosis is important in improving the design process and the manufacturing yield of nanometer circuits. It is however a challenging problem as today’s complex defects lead to an explosion of the diagnosis solution space with the increasing number of possible fault locations and fault models. Our goal in this study consists in developing a new diagnosis method targeting almost all the nanometer defects in an unified manner (stuck-at, delay, open, stuck-on/open, short, resistive opens or shorts). The context of this study can be either external scan testing or scan-based BIST where time or space compaction is normally applied to test responses. Only logic cores are assumed as circuit under test/diagnosis in this study. 1.
Introduction
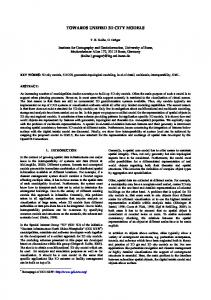
The problem of diagnosis in scan-based architectures can be divided into two sub-problems (Figure 1). The first one consists in identifying faulty scan cells from the external outputs of the core on which one or several errors have been observed during test. Only logic error propagation has to be considered in this sub-problem, irrespective of the nature of the suspected defects. Many techniques assuming different types of test compactors have been proposed so far to deal with this sub-problem [1][2].
second sub-problem. This sub-problem consists in identifying suspect nodes in the combinational part of the core starting from the known faulty scan cells and clock cycles. Dealing with this sub-problem requires the use of combinational diagnosis algorithms. The main difficulty here is to identify and localize suspected nodes with a good confidence level (near 100%), having in mind that several types of defects with different behaviors (logic, dynamic, parametric) can lead to the same errors. The existing combinational diagnosis algorithms can be divided into two categories. The first one applies the cause-effect principle. Methods in this category build the simulation response database for the modeled faults and compare this database with the observed failure responses to determine the possible causes of observed errors. These methods are sometimes referred to as fault dictionary methods. However, as these methods require large fault behavior database, they are not practical for large designs. The second category traces the effect-cause dependencies. Methods in this category analyze the actual responses and determine which fault(s) might have caused the observed failure effects. Typically, a critical path tracing algorithm [3] is used to narrow down the fault suspects from the failing scan cells and/or primary outputs. These methods do not build the fault-response database and hence are more memory-efficient and can be applied to large designs. This approach will be used for our diagnosis procedure.
2. Block under Test
Compactor
lirmm-00136869, version 1 - 15 Mar 2007
Laboratoire d’Informatique de Robotique et de Microélectronique de Montpellier University of Montpellier II / CNRS 161 rue Ada, 34392, Montpellier Cedex 05, France {rousset,girard,pravossoudovitch,landrault,virazel}@lirmm.fr
Fig.1: Fault site determination Broadly speaking, they can be classified as compactor bypass techniques and indirect diagnosis methods. For this reason, we will focus only on the
Principle
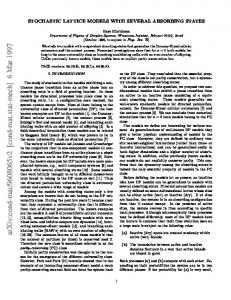
Critical path tracing (CPT) has been initially proposed to diagnose single stuck-at faults in combinational circuits [3] and has been extended to handle delay faults [4] and shorts [5]. CPT starts from erroneous output(s) provided by the tester and from fault free values obtained by simulation. Progressing back from outputs to inputs, CPT determines for each failing pattern the set of suspected lines. From all the sets of suspected lines and by using also information on fault free patterns, CPT deduces by sets intersection the final list of suspected lines. In this study, we generalize the same principle by adding fault models information to the backtracked lines. To do so, we first
perform a fault free simulation (Figure 2) using a sixvalue algebra (Figure 3) enabling to handle two consecutive test patterns necessary for the detection of faults such as delays or stuck-opens. From this information and backtracking from the erroneous outputs, the CPT provides a set of suspected lines. Each line being associated with a list of possible fault models.
e1
R1
e2 R1
G1F0
G2
a e3 C1
G3
P0 b
G4
F0
G5
e4 R1
G6
Final suspect list: Sz1 g(R1), e(R1), f(P1), c(FO)}
P1 d
G8
R1 e
c
P1
P1 z1
R1 G7
g
G9
F0 « Fail » z2
f
Symbols
Representation
C0
Constant at ‘0’ : ‘00’
C1
Constant at ‘1’ : ‘11’
Sz2 = {e2(R1), a(F0),
« Fail »
Fig. 2: Fault free simulation and path tracing from erroneous outputs
lirmm-00136869, version 1 - 15 Mar 2007
All potential lines are present in these two lists. Now, if we assume the single fault assumption, the fault location (the fault origin of the erroneous outputs) is necessarily in the lists. With this assumption, the intersection of all the list produces by the CPT procedure has to be performed. In our example, we obtain the following list:
For each suspected line, we have finally to analyze the possible implied fault models. This is done with the help of data presented in Figure 4 where, for each possible value of the algebra fault models are associated. For example, a suspected line with value C0 can be affected by a stuck-at-1. The final result of the entire diagnosis process is thus a list of suspected lines with each line associated with a list of possible fault models. C0
F0
Failing transition : ‘10’
R1
Rising transition : ‘01’
P0
Pulse 0 : ‘010’
P1
Pulse ‘1’ : ‘101’
Stuck-at 0
C1
Stuck-at 1
x
Tn Stuck open
x
Tp Stuck open
x x x
Resistive short (with any line at 1)
Suspect list from z2: Sz2 = {z2(F0), g(R1), e(R1), f(P1), c(FO), a(F0), e2(R1)}
x x
x
x x x x
Delay – Slow to Rise Delay – StF & StR
x
x
Resistive short (with any line at 0) Delay – Slow to Fall
This operation is repeated from output z2 and we obtain the following suspect list:
x x x
Short OR (with any line at 1) Short AND (with any line at 0)
Suspect list from z1: Sz1 = {z1(P1), d(P1), b(P0), a(F0), e2(R1), g(R1), e(R1), f(P1), c(FO)}
x x
Resistive open
We trace the critical path from each faulty output to inputs across sensible inputs of gates. One input is called sensible if the modification of this value causes the modification of the output of the gate. For example, consider the gate G8 in Figure 2. If the value P1 is changed into P0, then the output becomes P0, hence this input is called sensible input. From the circuit presented in Figure 2, the path tracing starts from output z1 (sensible inputs are represented by points). We obtain the first suspect list as follow:
x
x
Open 1
D
x x
x
Tp Stuck on
R1,P1
x
Tn Stuck on
Open 0
Fig. 3: Six-value algebra
F0,P0
x
x x
x
x
Fig. 4: Fault model assignment
3.
Conclusion
The proposed diagnostic method relies on an effectcause approach based on CPT process. It enables to work without manipulating explicitly fault models. The potential faults leading to the observed dysfunctions on the outputs are determined solely from an analysis of the effects (errors) produced on circuit lines. In comparison with previous methods developed on the CPT principle, this approach provides a more comprehensive and realistic set of fault models, and thus improving the diagnosis accuracy and its overall quality.
References [1] S. Mitra, K.S. Kim, "X-Compact, an Efficient Response Compaction Technique for Test Cost Reduction", International Test Conference, pp: 311320, 2002. [2] G.Mrugalski, A. Pogiel, J. Rajski, J. Tyszer, C. Wang, "Fault Diagnosis in Designs with Convolutional Compactors", International Test Cconference, pp. 498507, 2004. [3] M. Abramovici, P.R. Menon, D.T. Miller, “Critical Path Tracing – An Alternative to Fault Simulation”, IEEE Design & Test of Computers, Vol 1, n°1, pp 8392, February 1984.
lirmm-00136869, version 1 - 15 Mar 2007
[4] P. Girard, C. Landrault, S. Pravossoudovitch, “A Novel Approach to Delay Fault Diagnosis”, ACM Design Automation Conference, pp. 357- 360, 1992. [5] Srikanth Vendkataraman, W. Kent Fuchs, “A Deductive Technique for Diagnosis of Bridging Fault”, Internationel Conference on Computer Aided Design, pp. 562-567, 1997.