and numerical heterogeneous data types we propose a new weighting measure for the numerical data type called Bin. Frequency - Inverse Document Bin ...
International Journal on Advances in Systems and Measurements, vol 2 no 2&3, year 2009, http://www.iariajournals.org/systems_and_measurements/ 1
142
Unified Vectorization of Numerical and Textual Data using Self-Organizing Map Farid Bourennani, Ken Q. Pu, Ying Zhu University of Ontario Institute of Technology, Canada {farid.bourennani, ken.pu, ying.zhu}@uoit.ca a tight coupling. A tightly coupled distributed DB system provides location, replication and distribution transparencies to the user. Consequently, in order to achieve a tight coupling, the complete availability of databases documentation is necessary for the developer to understand the heterogeneous databases. Very often the information on the data schemas is not available because it is located in different locations or it has never been completed. In that case, exploiting semantic content to determine automatically similar database entities is the only way to achieve a tight coupling [3]. Firstly, the operation of finding database entities having similar content is done manually by developers. Manually specifying schema matches is a tedious, time-consuming, error-prone, and therefore expensive process [4]. Secondly, even after determining schema matches, the problem with the current integration tools is that they do not scale well to large schemas, and yet that is exactly what business need [5]. To solve this problems, in this paper we propose to classify automatically, by using SOM [6], the database entities based on the content in order to realize a tight coupling. The visualization properties of SOM make our tool very scalable to large schemas. In brief, in this paper we use the SOM based visualization tool for data integration purposes with a focus on the pre-processing phase. The proposed pre-processing techniques permit to process simultaneously heterogeneous textual and numerical data types. The resulting SOM map provides to the user a unified view of the data entities despite the heterogeneity of the data types. Furthermore, the map topology reflects the content similarities between database entities, which make data integration operation scalable and the data tightly coupled.
Abstract—Data integration is the problem of combining data residing in different sources, and providing the user with a unified view of these data. One of the critical issues of data integration is the detection of similar entities based on the content. This complexity is due to three factors: the data type of the databases are heterogeneous, the schema of databases are unfamiliar and heterogenous as well, and the quantity of records is voluminous and time consuming to analyze. Firstly, in order to accommodate the textual and numerical heterogeneous data types we propose a new weighting measure for the numerical data type called Bin Frequency - Inverse Document Bin Frequency (BF-IDBF). Our proposed BF-IDBF measure is more efficient than histograms, when combined with Term Frequency - Inverse Document Frequency (TF-IDF) measure for Heterogeneous Data Mining (HDM) by Unified Vectorization (UV). The UV permits to combine the algebraic models representing heterogeneous data documents, e.g. textual and numerical, which make the simultaneous HDM process simpler and faster than the traditional attempts to process data sequentially by their respective data type. Secondly, in order to handle the unfamiliar data structure, we use the unsupervised algorithm, Self-Organizing Map (SOM). Finally to help the user to explore and browse the semantically similar entities among the copious amounts of data, we use a SOM-based visualization tool to map the database entities based on their semantical content. Index Terms—Pre-Processing, Data Integration, Heterogeneous Data Mining (HDM), Unified Vectorization (UV), Self Organizing Map (SOM).
I. Introduction Many industrial sectors such as finance, medicine, data integration, and others are very interested in heterogeneous data classification. This interest is proportional to the heterogeneity of the data types. In other words, the more the data types are heterogeneous, the higher is the motivation for heterogeneous data mining in order extract convergent results from these dissimilar data types. In the data integration context, the purpose for joining multiple databases is to significantly increase the data richness. However, due to the large volume of data (terabytes), an automated support is needed in order to find semantic matches between database entities located in two or more data sources. Here, database entities are in fact tables’ columns in a relational database model. The schema matching operation is complex due to the heterogeneities found in the different databases, such as the heterogeneity in the data types or data models. In this paper, we extend our previous works [1], [2] to overcome these heterogeneities found in different unfamiliar data repositories, and integrate the data in an efficient manner. One of the qualities of a properly integrated data is
Contribution of the paper We show that by combining TF-IDF and BF-IDBF measures, for heterogeneous data mining by unified vectorization, it is possible extract more convergent mining results, from heterogeneous textual and numerical data types, than the combination of TF-IDF and histograms measures. • We demonstrate how the unified vectorization of numerical and textual data, for SOM-based processing, can facilitate the schema matching operations by overcoming the different heterogeneities found in the distributed databases. • We illustrate that the heterogeneous data mining by combining the TF-IDF and BF-IDBF measures is more precise and faster than the usage of post-processing algorithms on •
International Journal on Advances in Systems and Measurements, vol 2 no 2&3, year 2009, http://www.iariajournals.org/systems_and_measurements/ 2
143
larger data sets, which is demonstrated by new experiments. • We demonstrate that the SOM-based visualization tool is more appropriate to large database schemas than ontology based tools, for explorative purposes, because of its scalable properties. Outline of the paper The structure of the rest of the paper is as follows. Section II, III, IV, and V will discuss the Review, the PreProcessing, the Processing, and the Post-Processing phases respectively. The section VI is devoted to experiments while section VII concludes the present paper. II. Review The definition of data integration: it is the process of combining data residing in different data sources and providing users with a unified view of these data [7]. Many automatic schema mapping techniques have been proposed by researchers [4][8][9][10][11] to facilitate this task. These automated tools can be divided into two main categories: Ontology based vs. semantic based data integration. The ontology based tools emphasize on database structural model, while semantic based integration tools accent more on the semantical content of database entities. The big majority of the existing data integration tools are are ontology based, however some research groups, such as Microsoft, are exploring the use of semantical content for this purpose as well [5]. Probably the ontology based tools are more used because the purpose of data integration is to build a new data warehouse, which implies a new data model. It is logical to use tools based on database structural models in order to build new database models. However, the problem is that before matching these database entities, the developer needs to find manually the similar ones. That is exactly where the ontology tools are lacking, and where the semantic based tools have their strength by automatically extracting similar database entities using information retrieval techniques for example. The ontology based tools use mainly database structural model. And, the majority of the current tools are ontology based, which means that the schema matching is done manually[5]. As mentioned previously, manually specifying schema matches is a tedious, time-consuming, errorprone, and therefore expensive process [4]. In addition, it is extremely time consuming to detect semantical relations between entities using ontologies because of the huge amount of data, the semantic conflict, and the unavailable documentation on the database schemas [5] [3]. As explained earlier, the semantic based integration tools are based on semantical content of database entities. Salton [12] and Van Rijsbergen [13] were the first ones to introduce textual information retrieval techniques for classifying textual databases based on the semantics. However, for some reason these kind of tools are not used for data integration. Probably, these type of tools are not used because they are not that practical without visualization features added to them. Another possible reason for not using these methods is that they do not provide a uni-
fied view of the heterogeneous data types. Some research groups, such as Microsoft, expressed their interest in these kind of tools, but it remains that they are not commercialized yet. Indeed, the use of these content based techniques is necessary in order to build automated tools for data integration purposes, and realize a tight coupling. Because, it is firstly necessary to detect similar database entities based on the semantic content by using tools such as the one proposed in this paper. Then, once these similarities are detected, the process of combining data residing at different sources using the traditional ontology based tools is more appropriate because it serves better this purpose. However, in order to find these semantically related database entities located in different repositories, a couple of issues need to be addressed. Sheth [14] groups these concerns into ”heterogeneities”. More precisely, he divides them into four groups: syntactic heterogeneity, schematic or structural heterogeneity, representational heterogeneity, and semantic heterogeneity. Every one of these heterogeneities or issues is described bellow. In addition, we explain which solution do we propose to each one of these heterogeneities. • Syntactic heterogeneity comprises all aspects that are related to the specific technical choices for the representation of interfaces and data. For example, two databases could use two different relational database management systems (RDBMS) such as Oracle vs. DB2. Consequently, in order to query or extract database entities from these syntactically dissimilar repositories, different layers or interfaces need to be used for every database. Rather than developing complex layers, queries, and interfaces, in this project we propose to uniformly transform all the relational database columns, from these heterogeneous and unfamiliar repositories, into uniform files, e.g. text files. In other words, every text file is a database column that can be further, uniformly, processed for data integration purposes. • Schematic or structural heterogeneity means differences in the types and structures of the elements. Many research groups are interested in heterogeneous data mining, and this interest is proportional to the heterogeneity of the data. The more the data is heteregneous, the higher is the interest to HDM. For example, in the business world several projects [15][16][17][18][19][20] worked on heterogeneous textual and numerical data mining because of the availability of the data. These projects focused on the mining combination of two data types in order to enhance the quality of the extracted information and the classification results. As an illustration, for the textual data, it could be business reports, and for the numerical data, it can be stock market prices. Putting together the mining results will provide much more valuable information. However in all these research projects, the resulting clusters from the qualitative and quantitative analysis did not coincide, rather they diverged and the obtained results were of lower quality. Most probably, the main reason of this divergence is caused by the mining results combination. I.e., each data type was processed separately, then the complex combination of these outputs led to poorer quality of
International Journal on Advances in Systems and Measurements, vol 2 no 2&3, year 2009, http://www.iariajournals.org/systems_and_measurements/ 3
144 clusters. In this research it is proposed to extract a more convergent classification results by mining numerical and textual data types simultaneously by Unified Vectorization (UV). By using UV, it is possible to combine the two data types in order to simultaneously process them. Furthermore, it permits to extract more convergent mining results, from heterogeneous textual and numerical data types, and avoid the complex combination of the classification results. In addition, it allows to have a unified view all the data regardless of their type for data integration purposes. Finally, it opens the doors for mining other data types in the future. • Model or representational heterogeneity implies differences in the underlying models (database, ontologies) or their representations (relational, object-oriented, RDF, OWL). These kind of heterogeneities are usually handled by ontology based tools. In this paper, we prefer to focus mainly on the content of the database rather than on the models because it is too complicated to process automatically. In addition, even if automated tools based on the models are developed, nevertheless the content of the database entities needs be examined, manually or automatically, in order validate the similarities between database entities. That is why, as explained previously, semantic based tools are necessary for data integration purposes, and tight coupling. To solve this issue, we propose, similarly to the syntactic heterogeneity problem, to transform all the database entities from different data sources into unstructured files of the same type, hence, text files for example. Then, these files are processed uniformly by an unsupervised algorithm, in this case Self Organizing Map (SOM), for detecting semantical content similarity between the databases entities. The resulted map will facilitate the user to explore visually the relations between database columns (entities) despite difference of data models or representations. Even if the data schemas are ignored in the processing, a certain portion of the original data models is shown, on the SOM’s map, in the data entities labeling. The database entities labels, on the SOM’s map, have this format: column@table, which represents the column name, and the table name to which this column belongs to. Another reason for doing the classification of the database entities purely based on the columns’ content, and making an abstraction on the databases respective models, is that they are difficult to scale when schemas are large, and yet that is exactly what business need[5]. • Semantic heterogeneity connotes where the same real world entity is represented using different terms or viceversa. For example, if two database are merged, some definitions and concepts in their respective schemas like ”earnings” may have different meanings. in one database, ”earnings” may mean profits in dollars, while in the other database it might be the number of sales. Another example could be the concept of ”clients”, which is called ”clients” in one database and ”costumers” in the other one. The information in these database entities is similar, but the terminology used is different. Ontology of crosslexical references, such as Wordnet [21], could be used to
address this problem by finding synonyms. However the processing would be heavier, and the content of traditional databases is too basic to use these kind of techniques. In this paper, we propose to process database entities’ content by using a more advanced text vectorization technique, called N-gram[25]. Actually, the N-Grams offers the advantage of detecting similarities between two terms despite typo mistakes or two different words having similar roots. For more details and examples, refer to next section.
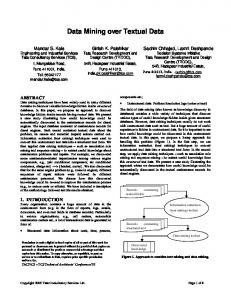
III. Pre-processing In order to implement any classification method, it is necessary to transform the input documents into an algebraic model so they can be processed. In this paper, the documents are in fact database entities, more specifically columns in a relational database model. The standard practice in information retrieval is the usage of the vector space model (VSM) to represent text documents [22]. Documents are symbolized in t-dimensional Euclidean space where each dimension corresponds to a term of the vocabulary [12]. Despite its simplicity and efficiency, the VSM has the disadvantage of focusing only on the textual data type. First, it’s hard to obtain accurate information of semantic relatedness automatically from textual information only [23]. And, more complex is the extraction of convergent results or coincident meaning from heterogenous data types.[16] Therefore, as shown on Fig. 1, our approach proposes to pre-process the heterogeneous data types, such as numerical and textual data, separately. Then combine them for simultaneous data mining by unified vectorization for better and more convergent content based clustering results.
Text Representation (n-gram / words)
Textual Vectorization (tf-idf)
Numeric Data (numbers)
Numerical Vectorization (Histogram / bf-idbf)
Input Data
Processing Phase
PreProcessed Input Data
Normalization (Linear)
Dimension Reduction (RP)
Data Combination (UV)
Fig. 1. Preprocessing Phase A. Pre-Processing of the Textual Data Let us start with textual data first and use the mothodology as a reference for numerical data, because numbers are texts, but the opposite is false. Initially, all the textual portions of a column dj are transformed into a vector xi . Thus, the combination of all the xi will form the textual portion of the VSM. The composition of xi is done as follow:
International Journal on Advances in Systems and Measurements, vol 2 no 2&3, year 2009, http://www.iariajournals.org/systems_and_measurements/ 4
145 A.2 Dimensionality reduction xi = (w1j , w2j , ...w|T |j ),
where |T | is the number of terms in whole set of terms T, and wkj represents the vectorization or the weight of the term tk in the document(column) dj . Several text representations are mentionned in the litterature, the most important ones are: Bag of Words [24], N-gram[25], Stemming and Lemmatization [24]. In this research paper, ”bag of words” and N-gram text representations are used. Firstly, the most common text representation within VSM framework is ”bag of words” [24] [22]. Every word is a term in the VSM model. Secondly, another efficient text representation is N-grams, which is a substring of N consecutive characters of word. For a given document, all the N-grams are in fact all the terms that compose the VSM matrix. N-gram has been chosen because it offers several advantages; it’s an easy and fast way to solve syntax related issues such as misspelling. Moreover, it finds common patterns between words with the same roots, but with different morphological forms (e.g., finance and financial), without treating them as equal, which happens with word stemming [26]. Example: Suppose that a document contains these two words: Finance and Financial. 4 - Gram of ”finance” =⇒ fina, inan, nanc, ance 4 - Gram of ”financial” =⇒ fina, inan, nanc, anci, cial Even if the words are different, they have three common tokens, which reflects their semantical similarity. A.1 Vectorization: TF-IDF measure Most approaches[24][27] are centered on a vectorial representation of texts using Term Frequency - Inverse Term Frequency(TF-IDF) measure, defined as: Ndoc F req(tk , dj ) × Log TF-IDF(tk , dj ) = P F req(t , d ) N k j k doc (tk ) where F req(tk , dj ) denotes the numberP of times the term tk occurs in the document (column) dj , k F req(tk , dj ) is the total number of all the term occurrences in the same document dj , and Ndoc is the total number of documents in the corpus, while Ndoc (tk ) is the number of documents in the corpus with the term tk . Example: - Suppose the corpus D composed of group of 5 documents D={d1, d2 , d3 , d4 , d5}. - The content of d1 is: ”Hello World” - Suppose all documents have the word: hello TF - IDF (hello, d1) = (1 / 2) * log (5 / 5) = 0 - If 4 documents only have the word: hello TF-IDF (hello, d1) = (1 / 2) * log (5 / 4) = 0.048 - Suppose d1, d2 , d3 have the word: world TF-IDF (world, d1) = (1 2) * log (5 / 3) = 0.255 The three last examples illustrate the smoothing function of the log in the TF-IDF formula.
In the text applications context, the high dimensionality is due to the large vocabulary of the corpus, which includes in addition to regular words, names, abbreviations, and others. This high number to terms (tokens) leads to burdensome computations and even restricts the choice of data processing methods. A statistical optimum of dimensionality reduction is to project the data onto a lowerdimensional orthogonal subspace that captures as much of the variation of the data as possible. The most widely used way to do this is Principal Component Analysis (PCA), however it is computationally expensive and is not feasible on large, high-dimensional data[28]. Therefore, another powerful technique that solves these problems is the Random Projection (RP) which is simple, offers clear computational advantages, and preserves similarity[28]. Given a matrix X, the dimensionality of the data can be reduced by projecting it through the origin onto a lower-dimensional subspace, formed by a set of random vectors R: A[k×n] = R[k×m] • X[m×n] Where, A is the reduced matrix, and the k in the subscripts is the desired, reduced dimensionality. Random Projection method was successfully tested with SOM on text and image data types, and it appears to be a good alternative to traditional methods of dimensionality reduction particularly when the dimension gets large [28]. More specifically, with textual data RP seems to perform better when the reduced dimensionality is superior to 600. The difference between the average error of RP and SVD (PCA performed directly on the data matrix) is less than 0.025 with 95% confidence interval [29]. B. Treatment of Numerical Data: Because of the different nature of data, the numerical data is pre-processed differently from the textual one. As an illustration let us have two numbers 1988 and 1991, representing years of birth or financial values, present in two columns (documents). Their proximity will not be detected by using traditional textual representations such as bag of words or n-gram because they do not possess enough textual similarities. That is why it is essential to pre-process the numeric input data differently so that their vectorized values reflects their semantic similarity. Several techniques are mentioned in the literature to specify concept hierarchies for numerical attributes such as binning, histogram analysis, entropy-based discretization, Z2-merging, cluster analysis and discretization by intuitive partitioning[30]. In this research, Histogram analysis [30] is used to ease the SOM neural network’s learning process and improve the quality of the map. More precisely, Equal-Frequency (Equal-Depth) Histogram [30] is used because of its good scaling properties and simplicity to implement. The values are partitioned so that, ideally, each partition, called bucket or bin, contains identical number of tuples. Another good reason for using histogram is that it reduces
International Journal on Advances in Systems and Measurements, vol 2 no 2&3, year 2009, http://www.iariajournals.org/systems_and_measurements/ 5
146 the dimensionality of the numerical portion of the VSM by s times, where s is the size of the bin. However, sometimes the size of the bins can be bigger than s in order to avoid cutting a cluster of the same value in the middle because of trying to respect the bin size. In this paper, the histogram bin (bucket) size was fixed to 10. All the numerical data ni of the document dj are transformed into a vector ni : ni = (v1j , v2j , ...v|N |j ), where, |N | is the total number of histogram bins, and vlj represents the number of observations that fall into various disjoint bin bl . The combination of all the vectors ni will form the VSM of the numerical data type as shown on Tab. 1. Example: - Suppose that these numbers {1, 2.5, 3, 3, 4, 5, 7, 9} are in the corpus D, and the bin size is equal to 3. - Bin1 = {1, 2.5, 3, 3} - Bin2 = {4,5,7} - Bin3 ={9} - Assume that a document d1, where d1 ∈ D, has the numbers {1, 3} in his content. - Therefore, Hist(Bin1, d1) = 2 C. Combination of the textual and the numerical data types by Unified Vectorization Now that the textual and numerical data have been vectorized and the dimensionality reduced, it is proposed to combine the numerical and the textual data by Unified Vectorization, as shown on Tab. 1, for simultaneous data processing. This combination of heterogeneous data types permits to meet the challenge of extracting convergent classification results out of this heterogeneous data types. However, the unified VSM should be normalized in order to avoid any unjustified influence of one the two data types during the SOM training phase. Tab. 1 Unified Vectorization of Textual and Numerical Data Types Docs d1 d2 .. . dm
t1 w11 w21 .. . wm1
Terms t2 ... w12 ... w22 ... .. .. . . wm2 ...
tn w1n w2n .. . wmn
b1 v11 v21 .. . vm1
Bins b2 ... v12 ... v22 ... .. .. . . vm2 ...
bl v1k v2k .. . vmk
D. Heterogenous data processing optimization The HDM by UV, using SOM, offers good results despite the difficulty of extracting convergent results from the heterogeneous textual and numerical data types[1]. However, the problem is that the results were not good enough in our first experiments. For example, it is well known that using N-gram as tokenizer for textual data gives better results than ”bag of words” [25]. But surprisingly when unified
vectorization was applied using N-grams and histograms, the results were poorer than the combination of ”bag of words” and histograms. This unsatisfactory performance of the N-gram tokenizer can be explained by the dissimilarity of the vectorization techniques. In other words, the TF-IDF measure for textual data and histogram measure for the numerical data don’t have an equivalent representation of tokens. That is why unexpectedly ”bag of words” performs better than n-gram. Indeed, TF-IDF measures the importance of a token in the document as well as its general importance in the corpus. On the contrary, histogram measures only the importance of a token in the document, while its importance in the corpus is neglected. In order to solve this insufficiency in the results, two alternatives are explored. The first one, is to find a better way to vectorize the numerical data, so that it represents a similar type of information as the text TF-IDF measure. In this direction, BF-IDBF measure of numerical data is introduced for better HDM. Another solution, is to hide the dissimilarity between two measures( TF-IDF vs. Histogram) by post-processing the resulted VSM matrix. Consequently in this sense, we use a post-processing algorithm called Common Item-set Based Classifier (CIBC) [1]. E. BF-IDBF weighting In spite of good results with HDM by UV, the usage of histograms as representation for numerical data type was was not as good as expected when it was combined with the TF-IDF measure for textual data. Probably, the reason is that in the opposite of the TF-IDF measure, the histogram measure does not give a sense of rarity or importance of a number in the corpus. In other words the two representation are not equivalent because they don’t reflect exactly the same type of information. More specifically, it is the IDF component that is not represented in the histogram measure. To solve this problem we propose the usage of Bin Frequency - Inverse Document Bin Frequency (BF-IDBF) weight as an alternative for representing the numerical data type. Actually, BF-IDBF model has two advantages. First, it uses the properties of an histogram which are more appropriate for numerical data type due to the different nature of the data. Secondly, it offers a data representation that is equivalent to TF-IDF measure in consequence of which the Machine Learning (ML) algorithms perform better when the data is processed by Unified Vectorization. In other words, BF-IDBF is an equivalent measure to the TF-IDF and it is based on the histogram at the same time. First the histogram is computed, then the BF-IDBF measure is be calculated in two step, the BF, then the IDBF. The BF serves to estimate the importance of bin, rather than the importance of a number, in a document. This way, it is possible to benefit from the precision and simplicity that offers Equal-Depth histograms. Likewise, the bin reduces the number of terms in the VSM matrix, which simplifies significantly the processing time and resources.
International Journal on Advances in Systems and Measurements, vol 2 no 2&3, year 2009, http://www.iariajournals.org/systems_and_measurements/ 6
147 The BF is defined as follows: F req(bl , dj ) BF(bl , dj ) = P k F req(bl , dj )
where, F req(bl , dj ) denotes the number Pof times the bin bl occurs in the document (column) dj , k F req(bl , dj ) is the total number of all the bin occurrences in the same document dj . It is important to mention that in this paper for simplicity reason the bin size bl was fixed ideally to 10. This number can sometimes vary in order to keep in the same bucket the numbers that are equal. Probably, a more efficient method for determining bucket sizes would improve the classification results. More details about those methods can be found in [31]. Other variances of histogram could be used as well, but because of the good results obtained in the previous work [1], ”equal depth” histogram is kept. The next step is the calculation of the IDBF weight which mainly serves to reduce the weight of the bin when it is not important in the corpus. In other words, if a certain range of numbers are common to a high amount of documents, the weight is decreased for better document classification based on the numerical semantical content. The IDBF is defined through a similar formula to IDF calculation as follow: IDBF(bl , dj ) = Log
Ndoc Ndoc (bl )
where Ndoc is the total number of documents in the corpus, while Ndoc (bl ) is the number of documents in the corpus with the bin bl . Finally, the BF-IDBF is calculated by multiplying the two measures, therefore the global formula is: Ndoc F req(bl , dj ) × Log BF-IDBF(bl , dj ) = P Ndoc (bl ) k F req(bl , dj ) F. Normalization The data does not necessarily have to be pre-processed at all before creating SOM and using it. However, in most real tasks pre-processing is important; perhaps even the most important part of the whole process[32]. All the values of the unified VSM matrix were normalized similarly in a range of [0,1] through a linear operation. IV. Processing Unsupervised classification or ”clustering” is one of the fundamental data mining techniques. Furthermore, Self Organizing Map (SOM) is an unsupervised learning neural network that produces a topologically clusters mapping on a plane (2D). The unsupervised classification property of SOM serves to classify completely unfamiliar database entities. In essence, despite the unknown databases schemas, the different database respective technologies, the different entities naming standards (client vs. customer), it would be possible to integrate these databases based on
their semantic content by using SOM. Other unsupervised algorithms such as ART [35] could be used as well, but the SOM’s trained map conveys additional information beyond the strict clustering of input documents. The SOM’s map topology reflects the content similarity between documents. In addition, the SOM algorithm is computationaly simple and produces reasonable results when compared to ART2 [36]. A. Self Organizing Map Self Organizing Map (SOM) of Kohonen is an unsupervised learning method which is based on the principle of competition according to an iterative process of updates[37]. It was used in numerous work in visualization of text corpus and applied in thousands of research projects[23]. SOM has two training modes that are mentioned in the literature: sequential and batch version. They differ basically in the method of updating weight vectors. The batch method of SOM was preferred over the sequential version because of two reasons. a) it produces a map much faster and b) it does not need a learning rate to converge. More details can be found in [6][23][33]. In brief, the batch version of SOM works as follows: • Phase 1: Compare each input vector dj with all the map nodes mi , initially selected randomly, in order to find the best matching unit (BMU). Then, copy each dj into a sublist associated with that map unit. • Phase 2: When the entire dj have been distributed into their respective BMUs sub-lists in this way, consider the neighborhood set Ni , around the map unit mi . In other words Ni represents all the map units within the radius of map unit mi . In the union of all sub lists in Ni , the mean of the correspondent mi is computed, and this is done for every Ni . • Phase 3: The next step in the process is to replace each old value of mi by its respective mi value, and this replacement is done concurrently for all the mi . In our previous work, it has been shown that SOM is appropriate to classify automatically unfamiliar database entities[1]. Moreover, the SOM based visualization tool appeared to be for semantically identical or similar database entities exploration. This is due to SOM’s inherit low dimensional regular grid layout. B. SOM based Visualization The most remarkable capability of SOM is that it produces a mapping of high-dimensional input space onto a low-dimensional (usually 2-D) map, where similar input data can be found on nearby regions of the map. Furthermore, SOM offers all the advantages of visual display for information retrieval which are: 1)the ability to convey a large amount of information in a limited space, 2) the facilitation of browsing and the perceptual inferences on retrieval interfaces, 3) the potential to reveal semantic relationship of documents [34]. These qualities will facilitate to the user the exploration of huge amount of database entities, and discover similar columns based on the semantic
International Journal on Advances in Systems and Measurements, vol 2 no 2&3, year 2009, http://www.iariajournals.org/systems_and_measurements/ 7
148
Fig. 2. Trained SOM map
content, which was not possible before with the traditional ontology based integration tools. The easiest way to visualize the clustered documents (columns) is to match every column dj to its respective Best Matching Unit (BMU) node[6] on the trained SOM’s map. The BMUs are the SOM’s map neurones. In essence, every document dj is matched to its BMU by having the smallest Euclidean distance with it. This matching operation results in having semantically similar documents clustered on the same Map’s node (BMU), let’s call that cluster Cli . Even if the results were satisfactory, it has been observed, as shown in Fig. 2, that: (1) some nodes were too large because of grouping together multiple heterogenous clusters, and (2) some documents were not matched to their best class. That is to say, the map is unbalanced because of too many nodes are empty, while some other nodes are overloaded.
Fig. 3. Clusters Zooming: table@column
In addition, the SOM-based visualization tool offers different graphical features such as zooming, flipping the map, or enlarging the distance between the nodes. The zooming feature is shown in Fig. 3.
V. Post-Processing: CIBC As a solution to the two previous issues, a new algorithm called Common Itemset Based Classifier (CIBC) is proposed in order to smoothen the clusters obtained in the previous section, and make the visual presentation clearer. Firstly, CIBC refines the SOM nodes’ clusters by validating the homogeneity of every cluster Cli , and re-clustering them into more homogeneous sub-clusters, when necessary. However, as shown on Fig. 4, CIBC try to preserve the original topology by trying to move the new sub-clusters within neighborhood. Secondly, the algorithm finds for every unclustered column a possible matching cluster Cli . Finally, it distinguishes visually on the map the clusters with homogenous documents from clusters (nodes) with heterogenous documents.
International Journal on Advances in Systems and Measurements, vol 2 no 2&3, year 2009, http://www.iariajournals.org/systems_and_measurements/ 8
149 B. Phase 2: SOM Nodes’s Clusters Homogeneity Validation
Fig. 4. Overview of CIBC
To illustrate the CIBC algorithm, suppose that we have a normalized term-document input VSM matrix, that has been pre-processed and then processed through the Batch version of SOM. The next step is to tune up the trained map using CIBC algorithm as follow: A. Phase 1: Forming Itemsets Let us assume that we are given a set of document items D. Suppose that an itemset Itk , where Itk ⊆ D, is some subset of similar documents dj (at least 2) based on the common term tk : Itk = {dj ∈ D | wjk > 0 ∧ |Itk | ≥ 2} (1) where, wjk is an entry in the VSM matrix and it represents the weight of term j in the document k. At this point, some itemsets contain a high number of similar documents because of stop words like ”the” for example or some other type of noise. Therefore, in order to eliminate these insignificant itemsets, the ratio of similar documents in every itemset |Itk | should be smaller than a certain threshold called M axI : |Itk | < M axI (2), |D| where, 0 < M axI < 1 For example, we can fix M axI to 0.7. It means that if an itemset is formed of 70% of the documents (entities) or more, then they should be eliminated because they have probably in common an insignificant term such as a stop word like ”the, a, an”. In fact, the purpose of the condition (2) is to reduce the number of potential itemsets to the essential ones. Besides, it permits to reduce the execution time of the post-processing algorithm. However, one of the problems is that M axI has to be proportionally increased to the dimensionally reduction ratio. In other words, the more the dimension is reduced, the more M axI needs to be relaxed. First, there in no exact formulas yet to increase the M axI parameter. Secondly, M axI can not be increased indefinitely. Once the original VSM matrix is reduced approximately by 4, the M axI needs to equal to almost 1 for better results. Consequently, M axI looses it sense. This to say, the CIBC becomes limited to a reduction ratio of 1/4. For more details, refer to the experiments section.
As explained previously, some cluster Cli , obtained from the SOM’s visualization phase, are not heterogeneous and as a consequence some nodes are overloaded by documents and many other ones are complectly empty. Therefore, the heterogeneity of every cluster Cli should be validated. First, for every cluster Cli has to be found all the itemsets Itk having at least two documents in common with it. Then, it should be kept only the intersection of the two T subsets Cli Itk , named: ICli ,tk . Let us call all the identical itemsets ICli ,tk : ICli ,n , where n ∈ N. Secondly, among all the itemset ICli ,n , it should be found the one having the biggest number of documents, and let us called it: Cli0 . However, Cli0 should respect the following condition in order to keep only the strongly semantically related documents: |TClk0 | |TM ax(dj ,Clk0 ) |
> α, (3)
where, |TClk0 | is the size of the vocabulary of the sub-cluster Clk0 , |TM ax(dj ,Clk0 ) | is the vocabulary size of the document dj having the richest vocabulary and which belongs to Clk0 . And α (usually = 0.05) is a threshold to keep only strongly related documents of the current sub-cluster Clk0 . Another problem in the CIBC algorithm is that there no exact formulas to calculate the threshold α. Usually when equal to 0.05, it gives good results. However, sometimes this value varies between [0.02-0.075]. The sub-cluster Clk0 is kept on its original node (BMU) while the remaining documents Clk0 are reprocessed until no homogeneous sub-cluster can be found. In case where there are other existing sub-clusters Cl”k , each one of them should be moved to a another empty node (with no clusters), ideally, within the neighborhood. C. Phase 3: Clustering the Unclustered Documents For every unclustered document, it should be found, respecting the rule (1), the best matching cluster if it exists. Otherwise, as last resort, by following the same process (phases 1 and 2), it should tried to form new clusters among the unclustered documents. D. Phase 4: Re-mapping the Unclustered Documents At this point, only left a certain number of semantically unique documents for which nor a matching cluster nor another similar document could be found. Therefore to show visually their uniqueness, these documents are reassigned to their first respective empty BMU. In the case where there is no available node, then they should be re-mapped to their first available BMU, which has only unclusterd documents. In the consequence of which, it will be formed new clusters of unclustered documents UClk .
International Journal on Advances in Systems and Measurements, vol 2 no 2&3, year 2009, http://www.iariajournals.org/systems_and_measurements/ 9
150
Fig. 5. SOM’s Updated Map
E. Visualization Update The SOM map is updated with the redistribution of homogenous clusters of columns, as well as the construction of clusters with unclustered documents (columns). As an illustration of an updated SOM map, the map shown on Fig. 5 (next page) is the original map shown on Fig. 3 (previous page) after applying the proposed CIBC algorithm to it. In the case where there is heterogenous clusters or group of heterogenous documents UClk , the clusters Clk with homogenous documents, formed in phase 2 and 3, will be differentiated visually by distinguished colors. VI. Experiments The experiments are divided into two case studies. The first case study (Northwind) being the first work related to unified vectorization, evaluates textual and numerical SOM based data processing by unified vectorization(UV). Different traditional tokenization and vectorization techniques are evaluated. In the same case study, another series of tests serve to measure the RP technique and the proposed CIBC post-processing Algorithm. In the second case study, another much bigger database (Sakila) is used to evaluate unified vectorization on more realistic scale.
The database having a larger portion of numerical data serves to assess the proposed BF-IDBF weighting measure. In addition, the experiments permit to compare the usage of CIBC versus the combination of TF-IDF and BF-IDBF on small and larger scales. A. Corpus The proposed techniques are tested on two demo databases available online, named: Northwind and Sakila. As shown on Tab. 2, the Northwind database has a 77 tables with 4681 terms as vocabulary size, which permits to test the algorithms with and without dimensionality reduction, and compare results. The Sakila Database is much bigger with 22104 term, and has more consistent volume of numerical data (17172) which permits to have more realistic database, and it’s more appropriate for BF-IDBF evaluation. Tab. 2. Unified Vectorization of Textual and Numerical Data Data Set Northwind Sakila
Columns 77 89
terms 4681 22104
text 2154 4932
num. terms 2527 17172
Cat. 15 20
International Journal on Advances in Systems and Measurements, vol 2 no 2&3, year 2009, http://www.iariajournals.org/systems_and_measurements/ 10
151
B. Tokenization
E. Evaluation
The process of breaking a text up into its constituent tokens is known as tokenization. Because we don’t make any linguistic pretreatment; i.e. we do not need to apply lemmatization, stemming or stop words elimination; the impact of tokenization on the results increases. It is not the purpose of this paper to evaluate the impact of tokenization, however we consider important to mention some important facts. For example, when using bag of words as method of representation, if the non alphanumeric characters, such as ”()-+;.”, are not eliminated, the results could be affected. The F-measure can drop when using the SOM algorithm by up to 15%, and it is even worse when using the hybrid SOM and CIBC algorithm (- 25%). Therefore, all the non alphanumeric characters are eliminated for the experiments.
The evaluation of the relevance of the classes formed remains an open problem because of the subjective nature of the task [24]. There are often various relevant groupings for the same data set. For instance, when comparing quantity entries (e.g. 12 05) with a date entry (e.g. 12-02/2005) the data are similar numerically but it does not fit within the purpose of this research which is the integration and the visualization of semantically similar columns. Therefore, these kind of data were classified in separated classes and our hybrid algorithm was significantly penalized (up to 25%) in this sense, but on the other hand it creates future research perspectives and challenges that are also closer to the industrial needs.
C. Evaluation Measures One of the most used performance evaluation of unsupervised classifiers in the IR literature, with respect to the known classes for each document, are F-measure and Entropy which are based on Precision and Recall [24]: P = P recision(i, j) =
R = Recall(i, j) =
Nij Nj
Nij Ni
where, Nij is the number of members of the class i and the cluster j, Nj is the number of members of the cluster j, and Ni is the number of members of the class i. F-measure distinguishes the correct classification of document labels within different classes. In essence, it assesses the effectiveness of the algorithm on a single class, and the higher it is, the better is the clustering. It’s defined as follow: P (|i| × F (i)) 2P R F (i) = =⇒ Fc = i P P +R i |i| where; for every class i is associated cluster j which has the highest F-measure, Fc represents the overall F-measure that is the weighted average of the F-measure for each class i, |i| is the size of the class i. D. Configuration The tests were conducted using different machines. The most recent ones were conducted on old machine: P. 4, 2.81 GHz, 1 Gig of RAM. Usually, the learning time is around 2 minutes. It does not change because the data is reduced always to the same dimensionality (2000 terms) using RP. Consequently, the learning time is not significant in this research paper, that is why the learning time was not measured for every test run.
F. Case Study 1: Northwind The objective of these tests is to evaluate, and at the same time compare, the performance of the algorithms of SOM with different weighting measures, including BFIDBF versus the hybrid proposed algorithm (SOM with CIBC). Another experimental interest is to select the best text representations, among those proposed in section 2, in order to obtain the best clustering result for heterogeneous data mining. Then, the best data representation would be tested on larger data to evaluate the scalability of the proposed methods. G. Preliminary tests: Without Dimension Reduction A good classification requires a good presentation[24]. However, the vast number of text representation possibilities presented earlier requires to select the most relevant ones to continue further our tests. In this sense, firstly it will be tested on Northwind DB, without dimensionality reduction, different combination of tokenization and vectorization as show in the Tab. 2. Accordingly, there are two tokenization methods: bag of words versus N-gram described earlier in the section III. Besides, there are two text vectorization techniques, which are TF-IDF and binary. the binary tokenization is simple; if the term is in document then weight is equal to 1, otherwise the value is 0. Regarding the numerical vectorization techniques, there is only historgram for this test. However, it is important to mention that some tests consider the numerical terms as texts, e.g. the term ”195” would be treated as a text. In brief, there are three possible vectorization methods: TFIDF (text) with histogram (numeric), binary(text) and histogram(numeric), and TF-IDF (text and numeric) where the numbers are considered as text terms. Tab. 3. Preliminary F-measure with different representations Data Set SOM Hybrid SOM Hybrid
Classifiers Bag of words Bag of words Ngram Ngram
tf-idf + hist. 58.24 87.64 51.55 59.75
bin. + hist. 49.85 74.18 45.12 52.34
tf-idf 54.37 65.07 51.26 60.18
International Journal on Advances in Systems and Measurements, vol 2 no 2&3, year 2009, http://www.iariajournals.org/systems_and_measurements/ 11
152
The preliminary tests (Tab. 3) show an evident performance advance of the hybrid (SOM+CIBC) algorithm by unified vectorization over pure SOM; there is improvement of the quality of clustering by [7.22-29.4]% of the F-Measure. The best results of the hybrid algorithm are when using bag of words as tokenizer, and with the proposed combination of TF-IDF and histogram as vectorization method. However, it can be observed that N-gram (3-gram) tokenization does not improve the results when used with proposed unified vectorization. In brief, the hybrid algorithm(SOM+CIBC) performs better than the pure SOM. More important is the fact that the proposed SOM-based HDM by UV using works better than processing the data based on one data type. H. Tests: With Dimensionality Reduction Dimensionality reduction was applied for the test series of this section, which are resumed in table 4 and Fig. 6. The size of the textual data vocabulary for all vectorization type (all test scenarios) was originally 2154 terms, then the dimension was reduced to 1000 by using RP. The dimension of the numerical data was not reduced using RP because Northwind is a small database and histograms reduced it enough. From the results, we can see that the best performance in general is the usage of the proposed Hybrid algorithm of SOM and CIBC. First of all, as shown on Tab.5, CIBC improves the classification precision of SOM by [4.84 - 23.78]% (F-Measure). Secondly, we can see that the proposed integration technique of numerical and textual data works very well, particularly with bags of words tokenization. Another interesting remark, is that the proposed unified vectorization technique (TF-IDF + histogram) performs better when using bag of words tokenization for textual data rather than N-Gram. This is valid for both processing algorithms.
Fig. 6 F-measure comparison depending on tokenization, vectorization, and classification algorithms We were expecting N-Gram to perform better that bagwords because usually N-gram performs better than bag of words. But, the most surprising is the fact that the combination of TF-IDF and BF-IDBF performs very similarly to TF-IDF and histogram. As it will shown in the next se-
ries of experiments, the duo of TF-IDF and BF-IDBF performs not only better that TF-IDF and histogram, but it performs even better than CIBC (TF-IDF and histogram). The only explanation that we can find to this lower F-Score is the fact that Northwind is not appropriate DB to evaluate BF-IDBF because of its low amount of numerical data (4681). In addition, the majority of these numbers, because the data is synthetic, are repeated dozen of times in the corpus, which probably lowers the BF-IDBF score. Consequently, we think that the Northwind data set is not appropriate to evaluate Numerical data vectorization measures. I. Case Study II: Sakila The objective of these tests is to evaluate the add value of the BF-IDBF measure on the processing of heterogenous data type, and more specifically using SOM classification method. In order to measure the contribution of the BFIDBF weight to the processing phase, F-measure is used. It is used with references to defined classes documents; The SOM’s resulting clusters are compared to the classes which are the ideal clustering results. Several representations are tested; therefore, multiple combinations of tokenization and vectorization are tried for SOM based processing. Accordingly, two tokenization methods, for textual data, are used: bag of words versus N-gram as described earlier. Besides, three vectorization techniques are compared: TF-IDF (textual data), histogram (numerical data) and the proposed BFIDBF(numerical data). It’s important to mention that around 60 % of the Sakila database files (columns) are constituted of purely numerical data such as keys, dates, prices, phone numbers, etc. The remaining ones are textual or a combination of the two data types. This to say that Sakila reassembles more to the real industrial databases because usually there are more numerical keys due to primary keys and other numerical informations. In addition, by having more numerical files, it permits to evaluate better the contribution of the BF-IDBF measure to the classification algorithm. For every measure, four sets of tests were completed. Firstly, the database classification using SOM was evaluated without unified vectorization, i.e. either numerical or textual exclusive input data were processed. In this case, the dimension was reduced using RP to 1500. Then, the heterogenous textual and numerical data type were processed simultaneously by unified vectorization using different vectorization including BF-IDBF. Therefore, it was possible to estimate the enhancement obtained by the proposed measure. Note that in the second case, the dimension was reduced to 1250 for textual data and 750 for numerical data for a total dimension of 2000. In other words, there is a loss of information when the data is processed by unified vectorization, but we don’t think it has a major impact to bias the results. As illustrated on (Tab. 6, Fig.7), the experiments show that the proposed combination of TF-IDF and
International Journal on Advances in Systems and Measurements, vol 2 no 2&3, year 2009, http://www.iariajournals.org/systems_and_measurements/ 12
153 Tab. 5 Comparison of the F-score values Tokenization Bag of words 3-Gram 4-Gram 5-Gram
TF-IDF + Histogram 54.03 51.63 42.88 46.00
SOM TF-IDF + BF-IDBF 54.74 49.91 50.85 45.39
TF-IDF 52.93 43.83 62.02 58.04
(SOM + CIBC) TF-IDF + Histogram TF-IDF 71.42 59.21 66.66 56.47 66.66 68.28 61.00 62.88
Tab. 6 Precision measures with different representations Tokenization Bag of words 3-Gram 4-Gram 5-Gram
TF-IDF 26.68 21.68 30.02 26.57
TF-IDF+HISTO 46.23 38.15 42.72 47.28
(TF-IDF+HISTO)+CIBC 52.81 43.11 45.23 54.64
TF-IDF+BFIDBF 64.81 58.77 65.56 63.94
Tab. 7 Recall measures with different representations Tokenization Bag of words 3-Gram 4-Gram 5-Gram
TF-IDF 89.89 93.26 92.13 92.13
TF-IDF+HISTO 74.15 70.79 71.91 71.91
(TF-IDF+HISTO)+CIBC 81.58 82.02 71.05 71.05
TF-IDF+BFIDBF 86.52 86.52 88.76 83.14
Tab. 8 F-measures with different representations Tokenization Bag of words 3-Gram 4-Gram 5-Gram
TF-IDF 41.15 35.18 45.29 41.25
TF-IDF+HISTO 56.95 49.58 53.59 57.05
BF-IDBF vectorization measures enhances the precision of SOM significantly by at least 15% when compared to the combination of TF-IDF and histogram. The precision is even better than applying the CIBC post processing algorithm. The best precision results are obtained when using 4-gram as tokenizer which improves the SOM’s precision by almost 20 % . Furthermore, the precision results obtained using exclusively BF-IDBF (54.49%) were better than even the combination of TF-IDF and histogram.
(TF-IDF+HISTO)+CIBC 64.11 56.51 55.28 61.77
TF-IDF+BFIDBF 74.11 69.99 75.42 72.29
very low, and that is why F-measure is a more objective way of comparing these representations. Then, the proposed combination of TF-IDF and the new BF-IDBF vectorization measures follow in the second position. It is interesting to note that again the exclusive usage of the BF-IDBF measure with purely numerical data (69.66%) is almost as good as the unified vectorization by TF-IDF and histogram.
Fig. 8. Recall comparison depending on tokenization, vectorization and classification algorithm Fig. 7. Precision comparison depending on tokenization, vectorization and classification algorithm In respect to the Recall measure (Tab. 7, Fig. 8), the best performance was with the exclusive usage of the TF-IDF vectorization measure; however, its precision was
Finally, the precision and the recall are combined equally to produce the F-measure which is more objective to compare the different representations. It can be easily observed (Tab. 8) that the 4-gram tokenization combined with the proposed vectorization using TF-IDF and BF-IDBF overcomes all the other representations.
International Journal on Advances in Systems and Measurements, vol 2 no 2&3, year 2009, http://www.iariajournals.org/systems_and_measurements/ 13
154
In fact, it performs better than the unified vectorization by TF-IDF and histogram by around 20%, and it almost doubles the performance of the traditional textual representation by TF-IDF. Even the usage of the pure BF-IDBF representation of the exclusively numeric data(61.15% ) performs better than the pure TF-IDF or even the combination of TF-IDF and histogram. Furthermore, even the post-processing algorithm CIBC is applied to the combination of TF-IDF and histogram, the proposed combination of TF-IDF and BF-IDBF show better results by at least 10%. This demonstrates the beneficial properties of the proposed BF-IDBF measure for heterogeneous data mining by unified vectorization on large data sets. Generally, it appears that similar data representations, such as TF-IDF and BF-IDBF, are more appropriate for heterogeneous data mining by unified vectorization. In fact, as illustrated on Fig. 9, the impact of the vectorization measures is more significant than the impact of the tokenization measures on the clustering results. In addition, the Fig. 9 illustrates well the importance of the pre-processing phase as one of the most important phases in data classification because of the major impact that it can have on the machine learning clustering results. Finally, per induction we can expect the proposed combination of TF-IDF and the new BF-IDBF measure to be possibly applied to any other machine learning algorithm for better heterogeneous data mining results.
Fig. 9. F-measure comparison depending on tokenization, vectorization and classification algorithm VII. Conclusions In this paper we have presented an efficient way to process heterogenous textual and numerical data, for data integration purposes, by the usage of the SOM-based visualization tool. By focusing on the pre-processing and post-processing phases, we demonstrated using SOM based processing by unified vectorization, that it is possible to extract convergent clustering results from heterogeneous textual and numerical data types despite the heterogeneity of the data type. The SOM visualization tool exposes the similarity between database columns based on their semantical content, which greatly serves the purpose of distributed database integration. This tool is applicable to data integration over web data sources. To evaluate
the best configuration of the SOM-based tool, we have compared several pre-processing methods, additionally to the CIBC post-processing method, for heterogeneous data mining by unified vectorization using SOM. First, we tried several text tokenization (Bag of words, 3Gram, 4-Gram, 5-Gram). Even if their impact is minor on heterogeneous data mining clustering results, nevertheless 4-Gram shows generally the best performances. Secondly, we tried several vectorization measures(text: TF-IDF, numeric:histograms and BF-IDBF), which may have much more important impact on heterogeneous data mining clustering results. The results differ depending on the size of the databases. With smaller databases, which have smaller data corpus and require a partial dimensional reduction ratio ( maximum 1/4), the combination of TFIDF and histogram versus TF-IDF and the proposed BFIDBF have very similar results. However, the couple (TFIDF, histogram) combined with the CIBC offer better results than the couple (TF-IDF, BF-IDBF). This is true on small databases only because once the database is large enough to require a dimension reduction ratio superior to 1/4, the performances of CIBC and histograms are penalized. In fact, at that point CIBC method offers a limited improvement which make suitable for small databases only. In the opposite, with larger data sets that are more similar to industrial database, the couple (TF-IDF, BF-IDBF) offer a clear amelioration of heterogeneous data mining results. Even when compared to the couple (TF-IDF, histogram) combined with the CIBC algorithm, the couple (TF-IDF, BF-IDBF) is better. Consequently, the combination (TF-IDF, BF-IDBF) is more suitable because it offers better results, and it is faster because it does not require the usage of a post-processing algorithm such as CIBC. Generally speaking, it seems that the usage of similar vectorization methods, such as TF-IDF and BF-IDBF for example, lead to better heterogeneous data mining results. In our future work we want to apply the proposed methods to other domains such as medical, finance, or network intrusion detection fields. Furthermore, we are considering to improve the pre-processing techniques for better heterogeneous data mining by unified vectorization. In addition, we would like to apply the unified vectorization method with other processing techniques. Finally, we aim to integrate other data types such as images, dna, and others. Acknowledgements The authors wish to thank the anonymous reviewers for their valuable suggestions. References [1] Bourennani, F., Pu, K. Q., Zhu, Y., Visualization and Integration of Databases using Self Organizing Maps, Proceedings of the International Conference on Advances in Databases, Knowledge, and Data Applications (DBKDA09), Cancun, Mexico, 2009, pp. 155-160. [2] Bourennani, F., Pu, K. Q., Zhu, Y. Visual Integration Tool for Heterogeneous Data Type by Unified Vectorization. Proceedings of the 10th IEEE International Conference in Reuse and Integration (IRI’09), Las-Vegas, USA, 2009, pp. 132-137.
International Journal on Advances in Systems and Measurements, vol 2 no 2&3, year 2009, http://www.iariajournals.org/systems_and_measurements/ 14
[3] Colomb, R. M. Impact of Semantic Heterogeneity on Federating Databases. The Computer Journal, Vol. 40, no 5, 1997, pp. 235244. [4] Rahm, E. and Bernsteinp, P. A. A survey of approaches to automatic schema matching. The VLDB Journal, Springer-Verlag New York, Inc., Secaucus, Vol. 10, no 4, NJ, USA, 2001, pp. 334-350. [5] Robertson, G. G., Czerwinski, M. P., Churchill, J. E. Visualization of Mappings Between Schemas. ACM SIGCHI Conference on Human Factors in Computing Systems, Portland, Oregon, USA, 2005, pp. 431-439. [6] Kohonen, T. Self-Organizing Maps. Berlin : Springer-Verlag, 2001. [7] Lenzerini, M. Data Integration: A Theoretical Perspective. PODS’02, 2002. pp, 233-246. [8] Shvaiko, P., and Euzenat, J., A Survey of Schema-Based Matching Approaches. Journal on Data Semantics, Vol. 4, 2007, pp. 146-171. [9] Noy, N. F. Semantic Integration: A Survey Of Ontology-Based Approaches. SIGMOD Record, Vol. 33, no 4, 2004. [10] Miller, R., Haas, L. M., A. Hernandez, M. Schema Mapping as Query Discovery. VLDB ’00: Proceedings of the 26th International Conference on Very Large Data Bases, San Francisco, CA, USA, 2000, pp. 77-88. [11] Wache, H., Veogele, T., Visser, U., Stuckenschmidt, H., Schuster, G., Neumann, H. and Hubner, S. Ontology-Based Integration of Information - A Survey of Existing Approaches. The Workshop on Ontologies and Information Sharing at the International Joint Conference on Artificial Intelligence (IJCAI), Victoria, BC, Canada, 2001. pp. 108-117. [12] Salton, G. Automatic Text Processing. MA : Addison-Wesley, 1989. [13] Van Rijsbergen, C.J., Information Retrieval 2nd ed.: Butterworth-Heinemann, 1979. [14] Sheth, A. P. Changing Focus on Interoperability in Information Systems: From System, Syntax, Structure to Semantics. Norwell, Massachussetts, USA : M. F. Goodchild, M. J. Egenhofer, R. Fegeas, and C. A. Kottman (eds.) Kluwer, Academic Publishers, 1998, pp. 5-30. [15] Kloptchenko, A., Eklund, T., Karlsson, J., Back, B., Vanharanta, H., Visa, A. Combining data and text mining techniques for analysing financial reports. Intelligent Systems in Accounting Finance and Management, Vol. 12, no 1, 2004. pp. 29 - 41. [16] Back, B., Toivonen, J., Vanharanta, H., Visa, A. Comparing numerical data and text information from annual reports using self-organizing maps. International Journal of Accounting Information Systems, Vol. 2, no 4, 2001. pp. 249-269. [17] Eklund, T., Back, B., Vanharanta, H., Visa, A. Benchmarking International Pulp and Paper Companies Using Self-Organizing Maps. Turku, Finland : TUCS Technical Report No 396, Turku Centre for Computer Science, 2001. [18] Hearst, M. A. Untangling Text Data Mining. Proceedings of the 37th annual meeting of the Association for Computational Linguistics on Computational Linguistics, College Park, Maryland, USA, 1999. pp. 3-10. [19] Rbov, I., Konecn, V., Matiov, A. Decision Making with Support of Artificial Intelligence. Agricultural Economics, Vol. 51, no 9, 2005, pp. 385-388. [20] Parvizian, J., Tarkesh, H., Farid, S., Atighehchian, A. Project Management Using Self-Organizing Maps. Industrial Engineering and Management Systems, the official journal of APIEMS, Vol.5, no 1, 2006. [21] Miller, R., Haas, L. M., A. Hernandez, M. Schema Mapping as Query Discovery. VLDB ’00: Proceedings of the 26th International Conference on Very Large Data Bases, San Francisco, CA, USA, 2000, pp. 77-88. [22] Baeza-Yates, R. and Ribeiro-Neto, R., Modern Information Retrieval. : Addison Wesley Longman, 1999. [23] K. Lagus, S. Kaski, and T. Kohonen. Mining massive document collections by the WEBSOM method. Information Sciences, Vol.163, 2004. pp. 135-156. [24] Amine, A., Elberrichi, Z., Bellatreche, L., Si- Monet, M., Malki, M. Concept-based clustering of textual documents using SOM. In Proceedings of the IEEE/ACS International Conference on Computer Systems and Applications, Doha, Quatar. 2008. [25] Y. Miao, V. Keelj, and E. Milios. Document Clustering Using Character N-Grams:A Comparative Evaluation With TermBased and Word-Based Clustering. 14th ACM International Con-
155 ference on Information and Knowledge Management, Bremen, Germany, 2005. [26] Sahami, M. Using Machine Learning to Improve Information Access. PhD thesis, Computer Science Department, Stanford University, 1999. [27] Sebastiani, F. Machine learning in automated text categorization. ACM Computing Surveys, Vol. 34, no 1, 2002. pp. 1-47. [28] Fradkin, D., Madigan, D. Experiments with Random Projections for Machine Learning. Ninth ACM SIGKDD International Conference on Knowledge Discovery and Data Mining, Washington, D.C, USA, 2003, pp. 517 - 522. [29] Bingham, E. and Mannila, H. Random projection in dimensionality reduction: Applications to image and text data. Seventh ACM SIGKDD International Conference on Knowledge Discovery and Data Mining, San Francisco, USA, 2001, pp. 245 - 250. [30] Han, J., Kamber, M. Data Mining, Second Edition: Concepts and Techniques. San Francisco : Morgan Kaufmann, 2006. pp. 72-97. [31] Magnello, M. E., Karl Pearson and the Origins of Modern Statistics: An Elastician becomes a Statistician, The New Zealand Journal for the History and Philosophy of Science and Technology, Vol. 1. [32] Pyle, D. Data Preparation for Data Mining. San Francisco : Morgan Kaufman Publishers, 1999. [33] Lagus, K. Text Mining with the WEBSOM, PhD thesis, Department of Computer Science and Engineering, Helsinki University of Technology, 2000. [34] Lin, X. Map displays for information retrieval. Journal of the American Society for information Science, Vol. 48, no 1, 1997, pp. 40-54. [35] Carpenter, G. A and Grossberg, S. ART2: Self-Organization of Stable Category Recognition Codes for Analog Input Patterns. Vol. 26, no 23, 1987, pp. 4919-4930. [36] Alseshunas, J.J, St. Clair, D. C., Bond, W.E. Classification Characteristics of SOM and ART2, In Proceedings of the 1994 ACM symposium on Applied computing, Phoenix, USA, 1994, pp. 297 - 302. [37] Song, M., Wu, YF (eds.). Handbook of Research on Text and Web Mining Technologies. USA : Idea Group Inc., 2008.