Discussions
This discussion paper is/has been under review for the journal The Cryosphere (TC). Please refer to the corresponding final paper in TC if available.
Discussion Paper
The Cryosphere
Open Access
The Cryosphere Discuss., 8, 1227–1256, 2014 www.the-cryosphere-discuss.net/8/1227/2014/ doi:10.5194/tcd-8-1227-2014 © Author(s) 2014. CC Attribution 3.0 License.
|
1,2
A. Rivera
1
1
3
1
, R. Zamora , J. A. Uribe , R. Jaña , and J. Oberreuter
Discussion Paper
Union Glacier: a new exploration gateway for the West Antarctic Ice Sheet
TCD 8, 1227–1256, 2014
Union Glacier A. Rivera et al.
Title Page Abstract
Introduction
Conclusions
References
Tables
Figures
J
I
J
I
Back
Close
1
Correspondence to: A. Rivera (
[email protected]) Published by Copernicus Publications on behalf of the European Geosciences Union.
Discussion Paper
Received: 31 December 2013 – Accepted: 24 January 2014 – Published: 20 February 2014
|
Centro de Estudios Científicos, P.O. Box 5110466, Valdivia, Chile 2 Departamento de Geografía, Universidad de Chile, P.O. Box 3387, Santiago, Chile 3 Instituto Antártico Chileno, Punta Arenas, Chile
Full Screen / Esc
| Discussion Paper |
1227
Printer-friendly Version Interactive Discussion
5
| Discussion Paper
1 Introduction
Discussion Paper
15
|
10
Union Glacier (79◦ 460 S/83◦ 240 W) in the West Antarctic Ice Sheet (WAIS), has been used by the private company Antarctic Logistic and Expeditions (ALE) since 2007 for their landing and commercial operations, providing a unique logistic opportunity to perform glaciological research in a vast region, including the Ice divide between Institute and Pine Island glaciers and the Subglacial Lake Ellsworth. Union glacier is flowing into the Ronne Ice Shelf, where future migrations of the grounding line zone (GLZ) in response to continuing climate and oceanographic changes have been modelled. In order to analyse the potential impacts on Union glacier of this scenario, we installed an array of stakes, where ice elevation, mass balance and ice velocities have been measured since 2007, resulting in near equilibrium conditions with horizontal displacements between 10 and 33 m yr−1 . GPS receivers and three radar systems have been also used to map the subglacial topography, the internal structure of the ice and the presence of crevasses along surveyed tracks. The resulting radar data showed a subglacial topography with a minimum of 858 m below sea level, much deeper than estimated before. The below sea level subglacial topography confirms the potential instability of the glacier in foreseen scenarios of GLZ upstream migration during the second half of the XXI century.
Discussion Paper
Abstract
TCD 8, 1227–1256, 2014
Union Glacier A. Rivera et al.
Title Page Abstract
Introduction
Conclusions
References
Tables
Figures
J
I
J
I
Back
Close
Full Screen / Esc
1228
|
Discussion Paper
25
WAIS, the West Antarctic Ice sheet (Fig. 1) has been considered potentially unstable because its bedrock is located well below sea level (Humbert, 2012), and its total disintegration could contribute up to 4.3 m (Fretwell et al., 2013) to global sea-level rise. In many cases, the topography underneath WAIS is inversed (ice is deeper upstream) and steeper than at the present grounding line zones (GLZ) (Ross et al., 2012). This topographic condition, in a context of ongoing global changes, especially oceanic warming in areas of the Southern Ocean, is leading to GLZ upstream migration, as ob-
|
20
Printer-friendly Version Interactive Discussion
1229
|
Discussion Paper
TCD 8, 1227–1256, 2014
Union Glacier A. Rivera et al.
Title Page Abstract
Introduction
Conclusions
References
Tables
Figures
J
I
J
I
Back
Close
Full Screen / Esc
| Discussion Paper
25
|
20
Discussion Paper
15
|
10
Discussion Paper
5
served for example at the Amundsen Sea Embayment Area (ASEA) glaciers, like Pine Island (PIG) and Thwaites (Rignot et al., 2002). This migration process in a context of inversed subglacial topographies, has an impact on glacier dynamics, since bottom melting at the GLZ is higher in deeper waters, provoking higher ice fluxes, ice thinning and, in general, a more negative mass balance (Rignot and Jacobs, 2002). However, there are WAIS areas where the changes are not as dramatic as observed at ASEA, with some regions thickening rather than thinning (Joughin and Bamber, 2005). One of the WAIS areas where glaciological changes are not strong at present is the Weddell Sea sector (Rignot and Thomas, 2002), where the Ronne Ice Shelf (RIS) is located (Fig. 1). This floating platform has been relatively stable in recent decades, with different behaviours of the GLZ and very small net mass balance changes (Rignot et al., 2011b). The relative stability of the RIS is partly explained by the Weddell Seas oceanographic and atmospheric conditions, and the associated sea ice extension (Mayewski et al., 2009). The sea ice volume in this area has been stable (Cavalieri and Parkinson, 2008), but recent studies (Hellmer et al., 2012) forecast a sea ice volume reduction for the XXI century resulting in incremental circulation of warm water beneath the Filchner ice shelf toward the GLZ of the Slessor, Support Force, Moeller and Foundation ice streams. The intrusion of warmer waters will certainly increase the basal melt rate of the ice shelf, and possibly lead to retreat of the GLZ. This, in turn, would favour higher ice fluxes along tributary glaciers, and thinning that will spread upstream along deep channels (Rignot et al., 2011a). Between two of the main ice streams in the region (Rutford and Institute), there ◦ 0 ◦ 0 are two smaller glaciers also draining into the RIS; Union glacier (79 46 S/83 24 W) ◦ 0 ◦ 0 flowing into the Constellation inlet and the Horseshoe valley (80 18 S/81 22 W) flowing into the Hercules inlet. The study of these glaciers could provide an important clue about ongoing changes taking place in the region, especially considering that local glacier conditions can be significantly affected by RIS changes.
Printer-friendly Version Interactive Discussion
2 Study area
1230
TCD 8, 1227–1256, 2014
Union Glacier
|
A. Rivera et al.
Title Page Abstract
Introduction
Conclusions
References
Tables
Figures
J
I
J
I
Back
Close
Full Screen / Esc
| Discussion Paper
25
The Horseshoe valley (80 18 S/81 22 W) has been studied since the 1990s (Wendt et al., 2009), when Chilean Air Force C-130 airplanes landed on wheels at the Patriot Hills Blue Ice Area (BIA). BIAs have long been recognized as suitable places for landing airplanes (Mellor and Swithinbank, 1989). Since the 1980s, the private company Antarctic Logistics and Expeditions (ALE) also operated at this part of the Ellsworth Mountains using the Patriot Hills BIA for their commercial operations. However, the landing of heavy airplanes has been frequently disrupted due to strong prevailing cross winds. In order to increase the number of airplane operational days and improve access ◦ 0 ◦ 0 for heavy cargo airplanes, in 2007/8 ALE moved to Union Glacier (79 46 S/83 24 W) (Fig. 2), where the prevailing wind direction is in line with the landing strip (tail-head katabatic winds), helping airplanes to operate even with strong gusts. Thanks to ALE logistic support, four scientific campaigns have been conducted on Union glacier since 2008, where a glaciological program was established, including ice dynamic, mass balance and geophysical surveys (Rivera et al., 2010). Union glacier has an estimated total area of 2561 km2 , with a total length of 86 km from the ice divide with Institute ice stream down to the grounding line of the Constellation Inlet on the RIS. The glacier has several glacier tributaries, the main trunks being located in the Union and Schanz valleys (Figs. 1 and 2), which are feed through narrow glacial valleys (9 km wide) flowing from the interior plateau until they join together at the Union “gate”. This gate or narrowest section of the glacier (7 km wide), has a central moraine line comprised of clasts and small-sized debris. The central moraine is visible
Discussion Paper
20
0
|
15
◦
Discussion Paper
10
0
|
5
◦
Discussion Paper
In this context, the main aim of this paper is to present recent glaciological results obtained at the Union glacier and nearby areas that provide a base line for possible ice dynamic responses to ongoing and modelled future changes of RIS.
Printer-friendly Version Interactive Discussion
10
Discussion Paper
3.2 Remote sensing
|
15
The meteorological data analysed here was collected at the Union Glacier base camp (Fig. 2) Automatic Weather Station (AWS), which has been operating since 2008. The AWS includes air temperature, humidity, air pressure, and wind speed and direction sensors. The AWS data series show several data gaps due to malfunction or low power supply problems during the winter. In spite of the above, the available data are good enough for weather forecast during landing operations in the summer, and for describing general temperature conditions in the area, as well as predominant winds and directions.
Discussion Paper
3.1 Meteorological data
|
3 Methods
Discussion Paper
5
along the local BIA that is used for landing Ilyushin IL76 airplanes on wheels under a contract with ALE llc. An array of 21 stakes was installed at the gate in 2007 for ice dynamic and surface mass balance studies. The Union gate has been re-surveyed by using GPS and radar systems installed onboard convoys pulled by Camoplast tractors travelling along predesignated routes. Results of the first campaigns of 2007 and 2008 were published by Rivera et al. (2010).
TCD 8, 1227–1256, 2014
Union Glacier A. Rivera et al.
Title Page Abstract
Introduction
Conclusions
References
Tables
Figures
J
I
J
I
Back
Close
Full Screen / Esc
|
Mid-summer ASTER satellite images acquired between 2002 and 2013 were analyzed and classified via manual digitalization in order to delineate the local Union Glacier main BIA. This task allowed areal changes in snow cover to be quantified and analysed for possible relationships with local meteorological data. The ASTER images were geometrically corrected using the internal parameters of each scene. A true colour composition (Band 1, 2 and 3N) for each year was pro-
Discussion Paper
1231
|
20
Printer-friendly Version Interactive Discussion
Discussion Paper
5
duced and the contrast and brightness modified by means of histogram equalization to facilitate the delimitation of the blue ice area. The BIA outline mapping was based upon a similar procedure established by Rivera et al. (2013), where the boundary between snow and ice is manually identified assuming the maximum extent criterion of identification. This is easily done thanks to the spectral differences between snow and ice.
|
3.3 Glaciological mass balance
|
1232
Union Glacier A. Rivera et al.
Title Page Abstract
Introduction
Conclusions
References
Tables
Figures
J
I
J
I
Back
Close
Full Screen / Esc
Discussion Paper
In December 2007, the initial observation network of 21 bamboo-stakes was installed on a Blue Ice Area on the Union Glacier (Fig. 2). For each of these stakes GPS measurements were made using Topcon GR3 dual frequency GPS receivers with measurement times of less than 30 s per stake, yielding metre scale errors. In December 2008, 2009 and 2010, the same network, as well as 35 new stakes were surveyed with dual frequency Javad GPS model Lexon GGD receivers. In order to apply a differential correction procedure, a similar GPS receiver was continuously collecting data at a rock location (RX1 in Fig. 2). The precision obtained by these surveys increased to less than 10 cm, by measuring between 15–30 min per stake. Additionally, a dual frequency Javad GPS receiver was installed on snow (Bstat in Fig. 2) collecting data between 11 December 2009 and 31 January 2010 for high resolution studies (each 30 s), with
8, 1227–1256, 2014
|
25
GPS
Discussion Paper
20
3.4
|
15
Discussion Paper
10
The protruding heights of every stake were measured yearly between 2007 and 2011 (Figs. 1 and 2). The annual heights were compared and local mass balance was subsequently calculated. In order to convert these values into water equivalent, a mean density of 910 kg m−3 (Paterson, 1994) was used for stakes drilled on ice. In those cases where the stakes were located at snow surfaces, the densities were measured by using a Mount Rose snow probe with penetration capacity of near 50 cm of snowfirn.
TCD
Printer-friendly Version Interactive Discussion
5
3.5 Surface elevation changes and geodetic mass balance estimation
(1)
∂h = b − we ∂t
TCD 8, 1227–1256, 2014
Union Glacier A. Rivera et al.
Title Page Abstract
Introduction
Conclusions
References
Tables
Figures
J
I
J
I
Back
Close
Full Screen / Esc
(2) |
If the glacier is in a steady state, there would be no surface changes since accumulation and ablation equals out the submergence and emergence velocities so that the surface profile remains unchanged (Hooke, 2005). In this case b = we , however most glaciers are not perfectly in steady state. Only the stake array measured at the Union gate was considered for this analysis.
Discussion Paper
1233
|
20
Discussion Paper
where ws is the vertical ice velocity, us is the ice velocity along the surface flow direction and α is the slope. The emergence velocity represents the vertical flow of ice relative to the glaciers surface and allows the estimation of the net balance if it is assumed that density does not change with depth during the period (Hooke, 2005). By subtracting the emergence velocity of the measured specific balance (stake height difference) the surface elevation change with time at a fixed position can be obtained.
|
15
we = ws − us tan α
Discussion Paper
10
|
The data obtained by the GPS measurements were compared in order to calculate the local mass balance and the absolute surface elevation changes at the BIA. Using the measured height differences obtained by GPS and considering the surface topographic slope effect, the submergence/emergence velocity (we ) was calculated:
Discussion Paper
the aim of detecting possible tidal modulated ice velocities. In January 2011, a Real Time Kinematic procedure was applied to data collected at the Union glaciar gate by a Leica SR 9500 receiver, with estimated decimetre accuracy. All GPS data collected were processed using the commercial software GrafNav 8.20.
Printer-friendly Version Interactive Discussion
5
TCD 8, 1227–1256, 2014
Union Glacier A. Rivera et al.
Title Page Abstract
Introduction
Conclusions
References
Tables
Figures
J
I
J
I
Back
Close
Full Screen / Esc
| Discussion Paper |
1234
Discussion Paper
25
|
20
Discussion Paper
15
|
10
A pulse compression radar depth sounder designed at CECS, was used to measure ice thickness. The radar operates at a central frequency of 155 MHz, a bandwidth of 20 MHz, and 200 W of peak power. Yagi antennae were used for both the transmitter and receiver. The radar includes a digital waveform generator, up converter transmitter, a timing and synchronization controller and an 80 dB variable gain digital receiver. A Frequency Modulated – Continuous Wave (FM-CW) radar, was also used to measure surface snow accumulation (up to 450 m thick), with high vertical resolution (1 m). This radar works at a frequency from 550 MHz to 900 MHz using two separated log periodic antennae for the transmitter and receiver. The transmit power was 21 dBm, the intermediate frequency (IF) amplifier gain was 70 dB and the whole system operated at a PRF (Pulse Repetition Frequency) 10 kHz. A Direct Digital Synthesis (DDS) system was used to generate an extremely linear frequency sweep transmitted signal. The third radar system used along these tracks was a commercial Ground Penetrating Radar (GPR), a Geophysical Survey Systems Inc. (GSSI) model SIR-3000, working at 400 MHz. The digital control unit of the radar triggers pulses at 100 kHz repetition rate. The range was set between 190 and 300 ns to record subsurface reflection with the aim to find crevasses in real time. The GPR antennae were mounted on a 7 m long rod which was attached to a tractor and had rubber car tire tube installed at the opposite end. The radar data were analysed in real time while the tractor was moving, in order to alert the driver to the presence of hyperbolae, potentially related to crevasses. This system was used particularly in areas previously detected on ASTER satellite imagery as being highly crevassed. Post processing and data analyses were carried out using Reflex-Win V5.6 (Sandmeier Scientific Software) for the three radar systems. A background removal, dewow filter and adjustment of the gain function, among other procedures, were applied to the raw data. For crevasses analysis, migration correction procedures were also applied to collapse the hyperbolic diffractions to their proper point origins (Plewes and Hub-
Discussion Paper
3.6 Radar
Printer-friendly Version Interactive Discussion
5
4
Discussion Paper
bard, 2001). In order to convert travel time to ice thickness in metres, it was assumed that the electromagnetic wave travelled through the ice at 0.168 m ns−1 , a mean value representative of cold ice (Glen and Paren, 1975) and at 0.194 m ns−1 assumed to be representative for snow/firm (Woodward and King, 2009). Results
|
10
Union Glacier A. Rivera et al.
Title Page Abstract
Introduction
Conclusions
References
Tables
Figures
J
I
J
I
Back
Close
Full Screen / Esc
Discussion Paper |
1235
8, 1227–1256, 2014
|
25
Discussion Paper
20
The meteorological data collected at Union Glacier between 2008 and 2013 contains several gaps and non valid records, but in general provide a good idea of the local conditions, which are especially useful for landing operations. In terms of climatological analysis, the series is too short and noisy, but is the only one available in the region. The mean daily air temperature at this location (Fig. 3) from 2008 to 2012 was ◦ ◦ −20.6 C, with an absolute minimum of −42.7 C recorded on 12 August 2008 at 2 a.m. ◦ and an absolute maximum of 0.5 C registered on 15 January 2010 at 8 p.m. Daily air temperatures have maximums in December–January following direct solar radiation, however between April and August (included) when the Sun is below the horizon, the ◦ lowest temperatures have a mean of −25.5 ± 3.5 C. Temperatures close to the melting point have only been observed in three summer events: 7–8 January 2008, 14–15 January 2010 and 25–26 December 2010, but no surface melting has been observed on this site. The mean air temperature in January is −10.3 ◦ C. Regarding wind speed and direction, the data are very consistent between 2008– 2012 with a mean value 16.3 knots and predominant direction from 224◦ . The maximum wind speed recorded on site was near 60 knots and the predominant wind speeds are higher than 25 knots (Fig. 4). This predominant wind direction explains the extension of the main BIA which has experienced less than 10 % area changes between 2002 and 2013. The series is however too short to detect a trend (Table 1).
|
15
Meteorological data and BIA area changes
Discussion Paper
4.1
TCD
Printer-friendly Version Interactive Discussion
5
|
1236
8, 1227–1256, 2014
Union Glacier A. Rivera et al.
Title Page Abstract
Introduction
Conclusions
References
Tables
Figures
J
I
J
I
Back
Close
Full Screen / Esc
Discussion Paper
Surface ice velocities were obtained for 19 stakes (B1–B19) located along the track between Patriot Hills and Union Glacier base camp (Figs. 3 and 6), with measurements periods of near 1 yr, and resulting ice velocities between 0.1 and 34.6 m a−1 . Minimum values were observed at local ice divides (B2–B8) while the maximum velocity was
TCD
|
25
Surface ice velocity
Discussion Paper
4.3
|
20
Discussion Paper
15
|
10
Snow densities measured at stakes drilled on snow surfaces have a mean value of 400 ± 3 kg m−3 , with small variability between all surveyed stakes. No fresh and soft snow was detected due to the lack of precipitation in the region during our surveys. Table 2 indicates the details of each stake, the type of surface and period of measurements. The mass balance estimations between 2007 and 2011 at the stakes installed on the BIA gate (V00 to V21, Table 2), are typically negative (Fig. 5), with a mean inter annual −1 mass balance of −0.097 m w.eq. a . The stakes installed along the traverse between Patriot Hills and Union Glacier (Fig. 1) were only measured between 2008 and 2009 and showed differing results depending on their location. Stakes installed on snow surfaces (B1–B12) have positive mass balances with a mean snow accumulation of 0.3 m a−1 (0.12 m w.eq. a−1 ). −1 Just outside the BIA, stake B12 showed the maximum net balance (0.2 m w.eq. a ), indicating that snow drift coming from the BIA, due to the predominant katabatic wind direction (Fig. 4) is having a positive downstream accumulation effect. The only negative mass balance along the track Patriot Hills-Union Glacier (excluding the Union glacier BIA) was detected at stake B5, which is located at the edge of the local BIA −1 of the Plumber glacier (Fig. 1). Here a modest −0.07 m w.eq. a (Table 2) was obtained between 2008 and 2009. Stakes B13–B19 (Table 2, Fig. 2), also had negative −1 values with a mean surface balance of 0.1 m w.eq. a , coincident with the other stakes located at a local BIA.
Discussion Paper
4.2 Mass balance
Printer-friendly Version Interactive Discussion
1237
|
Discussion Paper
TCD 8, 1227–1256, 2014
Union Glacier A. Rivera et al.
Title Page Abstract
Introduction
Conclusions
References
Tables
Figures
J
I
J
I
Back
Close
Full Screen / Esc
| Discussion Paper
25
|
20
Discussion Paper
15
|
10
Discussion Paper
5
observed at stake B10 located at the steepest area of Union Glacier, between two crevasse fields (Figs. 2 and 6). Between 11 December 2009 and 31 January 2010 a dual frequency GPS receiver was attached to stake Bstat, taking continuous measurements every 15 s. The receiver was powered by batteries and solar panels, providing a high detailed record of daily ice dynamic during the spanned period of time. The main aim of this survey was to test the hypothesis that the ice dynamics of Union glacier are affected by Ronne Ice Shelf tides, as has been observed at the Rutford ice stream where a modulated ice flow was detected (Gudmundsson, 2006). This stake (Bstat, Table 2) is located ∼ 38 km upstream the local grounding line zone of the Constellation inlet at the Ronne Ice Shelf (Figs. 1 and 2). The resulting ice velocity was 33 m a−1 , and thanks to the analysis carried out by H. Gudmunsson (personal communication, 2010), no tidal effect was detected. The neighbouring stake to Bstat (B9, located within a distance of 10 m) was only measured for 30 min in December 2009 and in December 2010, resulting in a annual velocity of 33.26 ± 0.7 m a−1 . The good correspondence with the Bstat results (33 m a−1 ) indicates that Union Glacier does not show important seasonal ice velocity changes. At the Union Glacier gate stake array (Fig. 2), 22 stakes were drilled into its Blue Ice Area in 2007 and have been annually resurveyed up until 2011. Unfortunately, not all the original stakes have survived, or were re-measured every year. However, from the remaining stake network a mean velocity of 20 m a−1 was estimated for the measurement period (Fig. 6). The orientation of the overall ice movement shows an ◦ angle of 65.42 at the gate, similar to the main wind direction (Fig. 4) observed at the ◦ ◦ BIA (from 224 to 44 ). No temporal velocity changes were observed during the studied period.
Printer-friendly Version Interactive Discussion
5
10
8, 1227–1256, 2014
Union Glacier A. Rivera et al.
Title Page Abstract
Introduction
Conclusions
References
Tables
Figures
J
I
J
I
Back
Close
Full Screen / Esc
Discussion Paper |
1238
TCD
|
25
Discussion Paper
20
More than 450 km long radar tracks were measured between 2008 and 2010 at the Union Glacier area, including oversnow traverses between Patriot Hills, Union Glacier and the high Antarctic plateau. The ∼ 80 km long profile between the Antarctic Plateau and Union Glacier (Fig. 7 upper), including the transit along Balish, Schneider, Schanz and Driscoll glaciers, was surveyed with a FM-CW radar for snow accumulation data, a compression pulse radar for ice thickness data and a GPR system for crevasse detection purposes. The deep ice of the plateau is seen at the beginning of the survey profile (A in Fig. 7), then is followed by a passage characterized by shallow ice (B) where the steepest section of the whole traverse was crossed. After this section, the thickness increases sharply until a local maximum thickness of 1120 m was observed at Balish Glacier. The local divide between the Balish and Schneider glaciers (C in Fig. 7) has a prominent subglacial peak (C in Fig. 7) where the mountain range dividing the two glaciers is also visible underneath the ice. The maximum thickness measured at Schneider Glacier was 900 m, 1050 m at Schanz Glacier, 1510 m in Driscoll Glacier and 1540 m in Union Glacier, close to the base camp. At the beginning of the radar profile (A and B in Fig. 7), it is possible to see the shallowest ice at the Gifford Peaks pass (passage), with a thickness between 45 and
|
15
Glacier thickness and internal structure
Discussion Paper
4.5
|
Considering the surface velocities obtained for the stakes (Table 2) and by applying Eq. (1), a mean vertical velocity for the blue ice of −0.07±0.007 m a−1 was found at the Union Gate. For a steady state glacier this would be equal to the local mass balance, however this is not the case for the studied area (there is a negative mass balance at the BIA) and a mean local elevation change of −0.012 m a−1 . was found. In any case, this result is close to the estimated error of the measurements and indicates near equilibrium conditions.
Discussion Paper
4.4 Surface elevation change
Printer-friendly Version Interactive Discussion
1239
|
Discussion Paper
TCD 8, 1227–1256, 2014
Union Glacier A. Rivera et al.
Title Page Abstract
Introduction
Conclusions
References
Tables
Figures
J
I
J
I
Back
Close
Full Screen / Esc
| Discussion Paper
25
|
20
Discussion Paper
15
|
10
Discussion Paper
5
140 m (Fig. 8) obtained with the low gain channel. This section (B in Fig. 7 bottom) corresponds to a ∼ 5 km long FM-CW radargram where 400 m of dynamic range were processed detecting the snow/firm stratigraphy with a resolution of 1 m. All along the whole A–F profile (Fig. 7 bottom), a detailed internal stratigraphy was detected in the upper hundred metres, comprised of isochronous layers that are particularly prominent at local ice divides (e.g. at C in Fig. 7 bottom). In those areas, the internal structures are characterized by typical minimum and divergent flow and the presence of Raymond Bumps (Paterson, 1994) and other internal inflections that can lead to the understanding of long-term changes in the ice flow. The collected ice thickness data at Union glacier has a mean ice thickness of 1450 m. The subglacial topography in the valley is smooth, with “U” shape flanks. The FM-CW radar detected multiple internal snow-firn layers and the snow-ice boundary layer with a high resolution (Fig. 8). Also, the FM-CW radar was capable of detecting the bedrock up to 350 m, improving the bedrock detection from the pulse-compression radar when surveying shallow ice (B at Fig. 7 bottom). The GPR data collected along the track from Union Glacier to the Antarctic Plateau allowed the detection of many crevasses both near the runway area, and at the Gifford Peaks passage, just before reaching the plateau. Along the survey route from the Union Glacier to the Antarctic Plateau the GPR system was able to detect the upper 20 m of the internal structure of the ice. Within this upper layer annual snow/firn layers suffered (in places) discontinuities due to crevasses that appeared as hyperbolae on the radar traces. In general, the route from Union glacier to the Antarctic plateau is almost totally free of crevasses. An exception to this was the Gifford passage (B in Fig. 7) where a minor system of crevasses was detected corresponding to steepening slopes. These crevasses have widths between 1 and 5 m, with snow bridges between 1.5 and 3 m thick. The Gifford passage is a narrow and steep valley, where the longitudinal stresses and velocities are probably much higher than the rest of the area. In spite of these crevasses, the Gifford passage is the shortest (235 km) gateway for oversnow tra-
Printer-friendly Version Interactive Discussion
|
5 Discussion
8, 1227–1256, 2014
Union Glacier A. Rivera et al.
Title Page Abstract
Introduction
Conclusions
References
Tables
Figures
J
I
J
I
Back
Close
Full Screen / Esc
Discussion Paper |
1240
TCD
|
25
Discussion Paper
20
|
15
At Union glacier, the local BIA is shaped by strong snowdrift caused by katabatic winds accelerated by the slope at the main junction between the two glacial valley arms feeding Union glacier from the upper Antarctic plateau. As a result, the net mass balance at this BIA is negative, the driving factor explaining the mass loses being sublimation of ice during summer months, as no melting event has been observed since 2007. However, melting events have been observed in the region, especially at Patriot Hills, where a small water pound was formed at the boundary between the BIA and the nunatak during a very warm 1997 summer (Carrasco et al., 2000). In spite of this negative surface mass balance, the resulting ice elevation changes between 2008–2011 at the Union gate are very close to the error of the measurements −1 (combined error of 0.01 m), with a mean of −0.012 m a and high spatial variability −1 (±0.044 m a ) among the gate stakes. Accordingly, the glacier must be considered in equilibrium without significant changes compared with previous data (Rivera et al., 2010). The ice velocities at the BIA fluctuate between 11 and 24 m a−1 without significant changes between 2007 and 2011. However, downstream of the Union gate, the veloc−1 ities increase up to 33 m a at the continuous GPS stake (Bstat), where no seasonal variations or tidal modulated variability were detected. The GPR survey allowed the detection of many more crevasses than were previously mapped with the ASTER imagery. The 400 MHz GPR is capable of identifying in real time surface and buried crevasses. The 400 MHz GPR crevasses data were compared
Discussion Paper
10
Discussion Paper
5
verses from Union glacier to the Subglacial Lake Ellsworth (Vaughan et al., 2007) at the Antarctic plateau, and is therefore the preferred route. The alternative route to this subglacial lake is near 520 km long, starting at Union glacier, passing along Patriot Hills, then travelling around the Tree Sails and finally turning west toward the Subglacial lake Ellsworth (Fig. 1 bottom).
Printer-friendly Version Interactive Discussion
| Discussion Paper
20
Discussion Paper
15
|
10
Discussion Paper
5
to the 500–900 MHz FMCW records and in most of the cases the wider crevasses (2 to 4 m width) could be detected in both radars. However, the FMCW radar did not provide the best information in regards to snow bridge thicknesses (less than 1 m), its resolution being insufficient to detect the first meters of the snow pack. Comparisons of surface and bedrock topography along transect A–F (Fig. 9), resulted in a maximum ice thickness difference of 1447 m with a mean difference of 477 m (standard deviation: 348 m) between the data presented here and BEDMAP2 (Fretwell et al., 2013). The surface topography of the surveyed traverse was found to differ from BEMAP2 and IceSat (2003–2005) by a mean of 91 m and 169 m, respectively. These differences are understandable due to the coarse resolution of BEDMAP2 and the footprint of IceSat. The subglacial topography (Fig. 9) at the main trunk of the Union glacier toward the local GLZ (Segment E–G in Fig. 7), showed a subglacial topography well below sea level (−858 m), much deeper than previously thought. However, between Union glacier and the local GLZ, the subglacial topography shows a maximum altitude of −190 m at F in Fig. 9. The subglacial topography then deepens toward the GLZ, where the bedrock is estimated to be 1050 m below sea level (Fretwell et al., 2013). This subglacial condition implies that an upstream migration of the GLZ until point F in Fig. 9 will not have a strong effect on Union glacier. However, the glacier can respond in a more dynamic way if this possible migration is affecting Union glacier upstream this point.
TCD 8, 1227–1256, 2014
Union Glacier A. Rivera et al.
Title Page Abstract
Introduction
Conclusions
References
Tables
Figures
J
I
J
I
Back
Close
Full Screen / Esc
|
25
Conclusions
Several glaciological oversnow campaigns have been undertaken to Union Glacier and nearby areas since 2007, where the surface and subglacial topographies were mapped in detail. These results were compared to the Bedmap dataset, showing much deeper bedrock and a much more complex subglacial topography than previously estimated. The obtained results determined a maximum ice thickness of 1540 m in Union Glacier,
|
1241
Discussion Paper
6
Printer-friendly Version Interactive Discussion
TCD 8, 1227–1256, 2014
Union Glacier A. Rivera et al.
Title Page Abstract
Introduction
Conclusions
References
Tables
Figures
J
I
J
I
Back
Close
Full Screen / Esc
| Discussion Paper |
1242
Discussion Paper
25
Acknowledgements. This research was supported by Antarctic Logistic Expeditions (ALE) Ltd. Special thanks to M. Sharp, M. and P. McDowell, C. Jacobs, Eddy, Boris and all ALE personnel at Union. CECs is funded by the Basal fund of CONICYT, among other grants. J. A. Neto collaborated with GPS data collection in 2011. A. Wendt, C. Rada, T. Kohoutek and M. Barandun helped with data processing. H. Gudmundsson analysed the GPS data at Bstat in order to detect possible tidal modulated effects on the ice flow. J. Carrasco and F. Burger helped with the met data. D. Carrión helped with figures and satellite image analysis. R. Wilson edited the text. A. Rivera is a Guggenheim fellow.
|
20
Discussion Paper
15
|
10
Discussion Paper
5
with a maximum snow ice boundary layer at 120 m. The internal structure of the ice was also mapped, including the detection of isochronous layers and crevasses, allowing logistic operators and scientists to work along safer routes. Ice dynamics were also recorded thanks to the measurement of ice velocities and ice −1 thickness. Maximum ice velocity values of 34.6 m a were obtained. Near equilibrium conditions were calculated at the BIA, where mean velocities of 20 m a−1 were measured. The snow accumulation among the studied stakes outside BIAs showed values −1 −1 of up to 0.2 m w.eq. a (near 0.5 m a of snow). At the BIA, a local negative mass −1 balance was detected as expected, with mean ablation rates of 0.1 m w.eq. a . Due to the below sea level subglacial topography upstream the local GLZ, it is expected that Union Glacier can experience some thinning and acceleration in future scenarios of GLZ migration. However these impacts will not affect the whole glacier, because at near 55 km upstream the present GLZ, the bedrock topography is close to sea level. Overall the collected data allowed a ground route from Union glacier to the upper Antarctic plateau to be satisfactory mapped. The route is important as it traverses the Subglacial lake Ellsworth and the main ice streams flowing into the Amundsen Sea Embayment area (Pine Island Glacier) and toward the Weddell Sea (Institute and Rutford Ice stream). This new 235 km long route toward Subglacial Lake Ellsworth is shorter than half of the previously traversed track of 517 km, providing a much direct and short gateway into inner Antarctica.
Printer-friendly Version Interactive Discussion
5
8, 1227–1256, 2014
Union Glacier A. Rivera et al.
Title Page Abstract
Introduction
Conclusions
References
Tables
Figures
J
I
J
I
Back
Close
Full Screen / Esc
Discussion Paper |
1243
TCD
|
30
Discussion Paper
25
|
20
Discussion Paper
15
|
10
Carrasco, J., Casassa, G., and Rivera, A.: A warm event at Patriot Hills, Antarctica: an ENSO related phenomena?, in: Sixth International Conference on Southern Hemisphere Meteorology and Oceanography, 240–241, Santiago, Chile, 3–7 April, 2000. 1240 Cavalieri, D. and Parkinson, C.: Antarctic sea ice variability and trends, 1979–2006, J. Geophys. Res., 113, C07004, doi10.1029/2007JC004564, 2008. 1229 Fretwell, P., Pritchard, H. D., Vaughan, D. G., Bamber, J. L., Barrand, N. E., Bell, R., Bianchi, C., Bingham, R. G., Blankenship, D. D., Casassa, G., Catania, G., Callens, D., Conway, H., Cook, A. J., Corr, H. F. J., Damaske, D., Damm, V., Ferraccioli, F., Forsberg, R., Fujita, S., Gim, Y., Gogineni, P., Griggs, J. A., Hindmarsh, R. C. A., Holmlund, P., Holt, J. W., Jacobel, R. W., Jenkins, A., Jokat, W., Jordan, T., King, E. C., Kohler, J., Krabill, W., RigerKusk, M., Langley, K. A., Leitchenkov, G., Leuschen, C., Luyendyk, B. P., Matsuoka, K., Mouginot, J., Nitsche, F. O., Nogi, Y., Nost, O. A., Popov, S. V., Rignot, E., Rippin, D. M., Rivera, A., Roberts, J., Ross, N., Siegert, M. J., Smith, A. M., Steinhage, D., Studinger, M., Sun, B., Tinto, B. K., Welch, B. C., Wilson, D., Young, D. A., Xiangbin, C., and Zirizzotti, A.: Bedmap2: improved ice bed, surface and thickness datasets for Antarctica, The Cryosphere, 7, 375–393, doi:10.5194/tc-7-375-2013, 2013. 1228, 1241, 1256 Glen, J. and Paren, J.: The electrical properties of snow and ice, J. Glaciol., 15, 15–38, 1975. 1235 Gudmundsson, G.: Fortnightly variations in the flow velocity of Rutford Ice Stream, West Antarctica, Nature, 444, 1063–1064, 2006. 1237 Hellmer, H., Kauker, F., Timmermann, R., Determann, J., and Rae, J.: Twenty-first-century warming of a large Antarctic ice-shelf cavity by a redirected coastal current, Nature, 485, 225–228, 2012. 1229 Hooke, R.: Principles of Glacier Mechanics, 2nd Edn., Cambridge University Press, Cambdridge, UK, 2005. 1233 Humbert, A.: Vulnerable ice in the Weddell Sea, Nat. Geosci., 5, 370–371, 2012. 1228 Jezek, K., and RAMP Product Team: RAMP AMM-1 SAR Image Mosaic of Antarctica. Version 2. Fairbanks, AK: Alaska Satellite Facility, in association with the National Snow and Ice Data Center, Boulder, CO, Digital media, 2002. 1254
Discussion Paper
References
Printer-friendly Version Interactive Discussion
1244
|
TCD 8, 1227–1256, 2014
Union Glacier A. Rivera et al.
Title Page Abstract
Introduction
Conclusions
References
Tables
Figures
J
I
J
I
Back
Close
Full Screen / Esc
| Discussion Paper
30
Discussion Paper
25
|
20
Discussion Paper
15
|
10
Discussion Paper
5
Joughin, I. and Bamber, J.: Thickening of the ice stream catchments feeding the Filchner-Ronne Ice Shelf, Antarctica, Geophys. Res. Lett., 32, L17503, doi:doi:10.1029/2005GL023844, 2005. 1229 Mayewski, P., Meredith, M., Summerhayes, C., Turner, J., Worby, A., Barrett, P., Casassa, G., Bertler, N., Bracegirdle, T., Naveira, A., Bromwich, D., Campbell, H., Hamilton, G., Lyons, W., Maasch, K., Aoki, S., Xiao, C., and van Ommen, T.: State of the Antarctic and Southern Ocean climate system, Rev. Geophys., 47, RG1003, doi:10.1029/2007RG000231, 2009. 1229 Mellor, M. and Swithinbank, C.: Airfields on Antarctic glacier ice, CRREL Rep. 89–21, US Army Cold Regions Research and Engineering Laboratory, USA, 97 pp., 1989. 1230 Paterson, W.: The Physics of Glaciers, 2nd Edn., Pergamon Press, Exeter, Great Britain, 1994. 1232, 1239 Plewes, A. and Hubbard, B.: A review of the use of radio-echo sounding in glaciology, Prog. Phys. Geog., 25, 203–236, 2001. 1234 Rignot, E. and Jacobs, S.: Rapid bottom melting widespread near Antarctic Ice Sheet grounding lines, Science, 296, 2020–2023, 2002. 1229 Rignot, E. and Thomas, R.: Mass balance of polar ice sheets, Science, 297, 1502–1506, 2002. 1229 Rignot, E., Vaughan, D., Schmeltz, M., Dupont, T., and MacAyeal, D.: Acceleration of Pine Island and Thwaites Glaciers, West Antarctica, Ann. Glaciol., 34, 189–194, 2002. 1229 Rignot, E., Mouginot, J., and Scheuchl, B.: Ice flow of the Antarctic Ice Sheet, Science, 333, 1427–1430, 2011a. 1229 Rignot, E., Mouginot, J., and Scheuchl, B.: Antarctic grounding line mapping from differential satellite radar interferometry, Geophys. Res. Lett., 38, L10504, doi:10.1029/2011GL047109, 2011b. 1229 Rivera, A., Zamora, R., Rada, C., Walton, J., and Proctor, S.: Glaciological investigations on Union Glacier, Ellsworth Mountains, West Antarctica, Ann. Glaciol., 51, 91–96, 2010. 1230, 1231, 1240 Rivera, A., Cawkwell, F., Wendt, A., and Zamora, R.: Mapping blue ice areas and crevasses in West Antarctica using ASTER images, GPS and radar measurements, in: Global Land Ice Measurements from Space, edited by: Kargel, J., Leonard, G., Bishop, M., Kääb, A., and Raup, B., Springer-Praxis, Heidelberg, 743–757, 2013. 1232
Printer-friendly Version Interactive Discussion
| Discussion Paper
10
Discussion Paper
5
Ross, N., Bingham, Corr, H., Ferraccioli, F., Jordan, T., Le Brocq, A., Rippin, D., Young, D., Blankenship, D., and Siegert, J.: Steep reverse bed slope at the grounding line of the Weddell Sea sector in West Antarctica, Nat. Geosci., 5, 393–396, 2012. 1228 Scambos, T., Haran, T., Fahnestock, M., Painter, T., and Bohlander, J.: MODIS-based Mosaic of Antarctica (MOA) data sets: continent-wide surface morphology and snow grain size, Remote Sens. Environ., 111, 242–257, 2007. 1248 Vaughan, D., Rivera, A., Woodward, J., Corr, H., Wendt, J., and Zamora, R.: Topographic and hydrological controls on Subglacial Lake Ellsworth, West Antarctica, Geophys. Res. Lett., 34, L18501, 2007. 1240 Wendt, A., Casassa, G., Rivera, A., and Wendt, J.: Reassessment of ice mass balance at Horseshoe Valley, Antarctica, Antarct. Sci., 21, 505–513, 2009. 1230 Woodward, J. and King, E.: Radar surveys of the Rutford Ice Stream onset zone, West Antarctica: indications of flow (in)stability?, Ann. Glaciol., 50, 57–62, 2009. 1235
TCD 8, 1227–1256, 2014
Union Glacier A. Rivera et al.
Title Page
| Discussion Paper
Abstract
Introduction
Conclusions
References
Tables
Figures
J
I
J
I
Back
Close
Full Screen / Esc
| Discussion Paper |
1245
Printer-friendly Version Interactive Discussion
Discussion Paper |
2
Area (km )
Date
Discussion Paper
95.6 104.7 112.0 111.8 88.2 96.7
|
24 Nov 2002 9 Dec 2004 27 Jan 2007 17 Jan 2009 11 Feb 2012 1 Feb 2013
Discussion Paper
Table 1. BIA extension based upon ASTER images collected since 2002.
TCD 8, 1227–1256, 2014
Union Glacier A. Rivera et al.
Title Page Abstract
Introduction
Conclusions
References
Tables
Figures
J
I
J
I
Back
Close
Full Screen / Esc
| Discussion Paper |
1246
Printer-friendly Version Interactive Discussion
H. (m.a.e)
Velocity (m a−1 )
Mass Balance (m w.eq. a−1 )
B1 B2 B3 B4
−80.211 −80.124 −80.045 −79.985
−81.230 −81.113 −80.937 −81.080
803.12 813.51 759.07 573.57
12.7 1.8 0.6 1.8
0.18 0.19 0.04 0.06
B5
−79.922
−81.211
538.16
2.0
−0.07
B6 B7 B8 B9
−79.840 −79.801 −79.757 −79.709
−81.298 −81.348 −81.965 −82.455
669.59 553.87 459.99 531.04
0.1 1.2 2.9 33.3
0.03 0.04 0.14 0.14
Bstat
−79.708
−82.454
531.34
33.0
-
B10 B11 B12
−79.717 −79.757 −79.760
−82.643 −82.803 −82.931
639.79 672.46 690.56
34.6 20.5 20.9
0.17 0.13 0.20
B13 B14 B15 B16
−79.764 −79.768 −79.798 −79.796
−83.091 −83.266 −83.281 −83.316
703.53 738.39 735.19 742.20
22.9 22.4 21.6 23.2
−0.09 −0.06 −0.16 −0.13
B17 B18 B19
−79.765 −79.760 −79.764
−83.343 −83.370 −83.372
739.36 747.68 743.72
17.0 14.0 11.1
−0.08 −0.11 −0.10
V00
−79.769
−83.370
739.47
18.1
−0.08
2008–2010
V01
−79.770
−83.370
738.44
19.0
−0.08
2007–2011
V02
−79.772
−83.368
738.13
20.2
−0.04
2007–2010
V03 V04 V05
−79.774 −79.775 −79.777
−83.365 −83.363 −83.361
739.69 736.40 733.57
21.7 22.3 23.0
−0.11 −0.07 −0.22
2007–2011
V06 V07
−79.779 −79.781
−83.358 −83.355
735.12 736.61
23.5 23.9
−0.11 −0.08
2007–2010
V08
−79.784
−83.352
739.05
24.3
−0.13
2007–2009
V09 V10
−79.787 −79.790
−83.343 −83.334
738.60 737.63
24.3 24.3
−0.11 −0.13
2007–2011
V11
−79.792
−83.325
738.82
24.0
−0.07
2007–2010
V12 V13 V14 V15
−79.771 −79.773 −79.774 −79.777
−83.337 −83.335 −83.332 −83.327
738.51 735.87 733.20 731.27
21.9 22.3 22.4 22.7
−0.09 −0.08 −0.08 −0.09
2007–2011
V16
−79.779
−83.323
731.72
23.1
−0.10
2007–2009
V17 V18 V19 V20 V21
−79.782 −79.784 −79.786 −79.788 −79.791
−83.316 −83.313 −83.309 −83.303 −83.298
731.16 730.33 729.48 728.57 733.66
23.4 23.5 23.6 23.3 23.0
−0.11 −0.13 −0.07 −0.11 −0.07
2007–2011
Type of surface
snow 2008–2009
2009/11/12 2010/31/01
2008–2009
snow/BIA
snow
ice
|
ice/crevasses
ice
Discussion Paper
TCD 8, 1227–1256, 2014
Union Glacier A. Rivera et al.
Title Page Abstract
Introduction
Conclusions
References
Tables
Figures
J
I
J
I
Back
Close
Full Screen / Esc
| Discussion Paper |
1247
Period
Discussion Paper
Lon◦
|
Lat◦
Stakes
Discussion Paper
Table 2. Stake co-ordinates, velocities and mass balance per period. See Figs. 1 and 2 for locations.
Printer-friendly Version Interactive Discussion
Rivera et al (2013): Union Glacier; a new exploration gateway for the West Antarctic Ice Sheet
Discussion Paper
2
| Discussion Paper |
65
75
days and improve access for heavy cargo airplanes, in 2007/8 ALE moved to Union Glacier (79◦ 46’S/83◦ 24’W) (Figure 2), where the prevailing wind direction is in line with the landing strip (tail-head katabatic winds), helping airplanes to operate even with strong gusts. Thanks to ALE logistic support, four scientific campaigns have been conducted on Union glacier since 2008, where a glaciological program was established, including ice dynamic, mass balance and geophysical surveys (Rivera et al., 2010). Union glacier has an estimated total area of 2561 km2 , with a total length of 86 km from the ice divide with Institute ice stream down to the grounding line of the Constellation Inlet on the RIS. The glacier has several glacier tributaries, the main trunks being located in the Union and Schanz
1248
80
|
Between two of the main ice streams in the region (Rutford and Institute), there are two smaller glaciers also draining into the RIS; Union glacier (79◦ 46’S/83◦ 24’W) 95 flowing into the Constellation inlet and the Horseshoe valley (80◦ 18’S/81◦ 22’W) flowing into the Hercules inlet. The study of these glaciers could provide an important clue about ongoing changes taking place in the region, especially considering that local glacier conditions can be significantly 100 affected by RIS changes. In this context, the main aim of this paper is to present recent glaciological results obtained at the Union glacier and nearby areas that provide a base line for possible ice dynamic responses to ongoing and modelled future changes of RIS. 105
Union Glacier A. Rivera et al.
Title Page Abstract
Introduction
Conclusions
References
Tables
Figures
J
I
J
I
Back
Close
Full Screen / Esc
Discussion Paper
70
90
8, 1227–1256, 2014
|
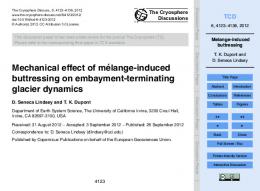
Fig. 1. Left: WAIS Location map. Right: union glacier basin (light blue area). In yellow, the main ice divides in the region. In dashed white the 2005 track to Subglacial lake Ellsworth (517 km). In green, the new track surveyed in 2010 (235 km). Stakes B1 to B9 are described in the text. operations.MODIS However, themosaic landing of heavy airplanes has been turn,box wouldisfavour higher ice glaciers, image: The black shown at fluxes Fig.along 2. tributary Background of Antarctic (Scambos frequently disrupted due to strong prevailing cross winds. and thinning that will spread upstream along deep channels et al., 2007). (Rignot et al., 2011a). In order to increase the number of airplane operational
Discussion Paper
Fig. 1. Left: WAIS Location map. Right: Union glacier basin (light blue area). In yellow, the main ice divides in the region. In dashed white the 2005 track to Subglacial lake Ellsworth (517 km). In green, the new track surveyed in 2010 (235 km). Stakes B1 to B9 are described in the text. The black box is shown at Figure 2. Background image: MODIS mosaic of Antarctic (Scambos et al., 2007).
TCD
Printer-friendly Version Interactive Discussion
Rivera et al (2013): Union Glacier; a new exploration gateway for the West Antarctic Ice Sheet
3
Discussion Paper
TCD 8, 1227–1256, 2014
Union Glacier
|
A. Rivera et al.
Discussion Paper
Title Page
| Discussion Paper
Abstract
Introduction
Conclusions
References
Tables
Figures
J
I
J
I
Back
Close
Full Screen / Esc
|
travelling along pre-designated routes. Results of the first campaigns of 2007 and 2008 were published by Rivera et al. 12493.1 Meteorological data (2010). The meteorological data analysed here was collected at the
|
120
Discussion Paper
2. Yellow dots show the stakes the text (Figure 1in andthe Tabletext 2). RX1 is the1location the static2). GPSRX1 on rock. Fig. 2.Fig. Yellow dots show the described stakesin described (Fig. and ofTable isCrevasses the location are shown in red. The Union Glacier “gate” is a transversal profile between B18 and B15 (inset) where the ice runway is shown in purple. of the Mean static GPS on rock. Crevasses are shown in red. The Union Glacier “gate” is a transverice velocities area shown as arrows. Summer base camp is located near B11. The background image is an ASTER false composite 321 acquiredbetween on February 1,B18 2013. and B15 (inset) where the ice runway is shown in purple. Mean ice sal profile velocities area shown as arrows. Summer base camp is located near B11. The background onboard convoys by Camoplast 3 on Methods image installed is an ASTER falsepulled composite 321tractors acquired 1 February 2013.
Printer-friendly Version Interactive Discussion
Discussion Paper
a et al (2013): Union Glacier; a new exploration gateway for the West Antarctic Ice Sheet
| Discussion Paper | Discussion Paper
◦
8, 1227–1256, 2014
5
Union Glacier A. Rivera et al.
Title Page Abstract
Introduction
Conclusions
References
Tables
Figures
J
I
J
I
Back
Close
Full Screen / Esc
|
Fig. 3. Mean daily temperature ( C) during 2008 (black triangles) and modeled solar direct radiation (red line) the 2008 AWS(black site (kW m−2 ).and modeled solar direct radiation (red line) at the AWS site (kW/m2 ). Mean daily temperature (◦ C) at during triangles)
TCD
Discussion Paper
Printer-friendly Version
|
1975) and at 0.194 m/ns assumed to be representative for Interactive Discussion works at a frequency from 550 MHz to 900 MHz using eparated log periodic antennae for the transmitter and 260 snow/firm (Woodward and King, 2009). er. The transmit power was 21 dBm, the intermediate ncy (IF) amplifier gain was 70 dB and the whole m operated at a PRF (Pulse Repetition Frequency) 10 4 Results A Direct Digital Synthesis (DDS) system was used to 1250 ate an extremely linear frequency sweep transmitted 4.1 Meteorological data and BIA area changes .
Rivera et al (2013): Union Glacier; a new exploration gat 320
Discussion Paper
6
| Discussion Paper
325
| Discussion Paper
330
|
Fig. 4. Predominant wind speed and direction 2008-2012 at the 335 Union Glacier Automatic Weather Station.
|
1251
Discussion Paper
Fig. 4. Predominant wind speed and direction 2008–2012 at the Union Glacier Automatic Weather Station.
TCD
4.3 8, 1227–1256, Surface2014 ice vel Union Glacier
Surface ice etvelocitie A. Rivera al. located along the tr GlacierTitlebase Page camp periods 1 ye Abstract of near Introduction 0.1Conclusions and 34.6References m/a. Mi divides (B2-B8) whi Tables Figures at stake B10 located J I between two crevass J I Between Decembe Back Close frequency GPS recei Full Screen / Esc continuous measurem was Printer-friendly poweredVersion by batt detailed record of d Interactive Discussion period of time. The the hypothesis that affected by Ronne at the Rutford ice st
Discussion Paper
era et al (2013): Union Glacier; a new exploration gateway for the West Antarctic Ice Sheet
| Discussion Paper | Discussion Paper
−1
Fig. 5. Mass balance (m w.eq. a ) 2007–2011 at stake located at the local BIA. Stakes locaare Fig. 2. at stake located at the local BIA. Stakes locations are shown in Figure 2. 5. Mass tions balance (mshown w.eq./a)in 2007-2011
TCD 8, 1227–1256, 2014
7
Union Glacier A. Rivera et al.
Title Page Abstract
Introduction
Conclusions
References
Tables
Figures
J
I
J
I
Back
Close
Full Screen / Esc
| Discussion Paper |
1252
Printer-friendly Version Interactive Discussion
Discussion Paper
5. Mass balance (m w.eq./a) 2007-2011 at stake located at the local BIA. Stakes locations are shown in Figure 2.
TCD 8, 1227–1256, 2014
Union Glacier
|
A. Rivera et al.
Discussion Paper
Title Page Introduction
Conclusions
References
Tables
Figures
J
I
J
I
Back
Close
|
Abstract
Discussion Paper
−1
Fig. 6. Ice velocities (m a ) at the Union Glacier gate by indicated years. Stakes location is 2. Union Glacier gate by indicated years. Stakes location is shown in Figure 2. shown(m/a) in Fig. 6. Ice velocities at the
Full Screen / Esc
| Discussion Paper
Glacier thickness and internal structure
|
mountain range dividing the two glaciers is also visible underneath the ice. The maximum thickness measured at e than 450 km long radar tracks were measured between Schneider Glacier was 900 m, 1050 m at Schanz Glacier, and 2010 at the Union Glacier area, including oversnow 1510 m in Driscoll Glacier and 1540 m in Union Glacier, rses between Patriot Hills, Union Glacier and the high close to the base camp. rctic plateau. 395 At the beginning of the radar profile (A-B in Figure 7), it e ∼80 km long profile between the Antarctic Plateau is possible to see the shallowest ice at the Gifford Peaks pass Union Glacier (Figure 7 upper), including the transit1253(passage), with a thickness between 45 and 140 m (Figure 8) g Balish, Schneider, Schanz and Driscoll glaciers, was obtained with the low gain channel. This section (B in Figure 390
Printer-friendly Version Interactive Discussion
Discussion Paper
TCD 8, 1227–1256, 2014
Union Glacier
|
A. Rivera et al.
Discussion Paper
Title Page
| Discussion Paper
Abstract
Introduction
Conclusions
References
Tables
Figures
J
I
J
I
Back
Close
Full Screen / Esc
|
420
Discussion Paper
Fig. Upper: location map of GPS thesurvey radar and between GPS thesurvey between the(F)Antarctic Fig.7. 7. Upper: Location map of the radar and measured Antarctic measured Plateau (A) and the Union Glacier in 2010 (green line). blue, the dataGlacier between F and Grounding Line Zone at the (G). The background image Plateau (A)Inand theavailable Union (F)theinlocal 2010 (green line). InConstellation blue, theInlet available data between is the RAMP AMM-1 SAR Image Mosaic of Antarctica (Jezek and RAMP Product Team, 2002). Bottom: Surface (red line) and subglacial F and the (blue local Grounding Zone at the Constellation Inlet (G). The background image is topography line) interpreted fromLine the radar data collected in 2010 along the A-F track. the RAMP AMM-1 SAR Image Mosaic of Antarctica (Jezek and RAMP Product Team, 2002). Bottom: line) subglacial topography line)collected interpreted from the radar data internal surface inflections (red that can leadand to the understanding of The(blue GPR data along the track from Union collected 2010inalong the A–F track. long-termin changes the ice flow. Glacier to the Antarctic Plateau allowed the detection of
410
|
The collected ice thickness data at Union glacier has a many crevasses both near the runway area, and at the Gifford mean ice thickness of 1450 m. The subglacial topography in1254 Peaks passage, just before reaching the plateau. Along the the valley is smooth, with “U” shape flanks. The FM-CW survey route from the Union Glacier to the Antarctic Plateau
Printer-friendly Version Interactive Discussion
Discussion Paper
TCD 8, 1227–1256, 2014
Union Glacier
|
A. Rivera et al.
Discussion Paper
Title Page
| Discussion Paper
Abstract
Introduction
Conclusions
References
Tables
Figures
J
I
J
I
Back
Close
Full Screen / Esc
| internal annual snow/firn layers and the firn/ice boundary (blue line). Letters A and B indicate the base camp where the snow/firn layers are near 30–40 m thick in total. Letter C, corresponds to thesystem central morainewas line of thecorresponding glacier. Letter D, minor of crevasses detected to 5 indicates Discussion the appearance of the BIA at the steepening surface. slopes. These crevasses have widths between 1
and 5 m, with snow bridges between 1.5 and 3 m thick. At Union glacier, the local BIA is shaped by strong snowdrift The Gifford passage is a narrow and steep valley, where 1255caused by katabatic winds accelerated by the slope at the the longitudinal stresses and velocities are probably much main junction between the two glacial valley arms feeding higher than the rest of the area. In spite of these crevasses, 450 Union glacier from the upper Antarctic plateau. As a result,
|
435
Discussion Paper
Fig. 8. FM-CW dataat Union obtained Union glacier. Upper: theof surveyed near Fig. 8. FM-CW data obtained glacier. at Upper: location of the surveyed tracklocation near the baseofcamp Union glacier. track The background the isbase camp Union321glacier. is showing an ASTER false composite 321 image an ASTER falseof composite acquired onThe Marchbackground 14, 2013. Bottom:image Radargram the surface topography (red line), internal annual snow/firn the firn/ice boundary (blue line). Letters A-B indicates the base where the snow/firn layers(red are near 30-40 acquired onlayers 14 and March 2013. Bottom: radargram showing thecamp surface topography line), m thick in total. Letter C, corresponds to the central moraine line of the glacier. Letter D, indicates the appearance of the BIA at the surface.
Printer-friendly Version Interactive Discussion
Rivera et al (2013): Union Glacier; a new exploration gateway for the West Antarctic Ice Sheet
Discussion Paper
10
| Discussion Paper | |
475
Union Glacier A. Rivera et al.
Title Page Abstract
Introduction
Conclusions
References
Tables
Figures
J
I
J
I
Back
Close
Full Screen / Esc
Discussion Paper
470
8, 1227–1256, 2014
|
465
in Figure 7), showed a subglacial topography well below spatial variability (± 0.044 m/a) among the gate stakes. Accordingly, the glacier must be considered in equilibrium 495 sea level (-858 m), much deeper than previously thought. without significant changes compared with previous data However, between Union glacier and the local GLZ, the subglacial topography shows a maximum altitude of -190 (Rivera et al., 2010). m at F in Figure 9. The subglacial topography then deepens The ice velocities at the BIA fluctuate between 11 and toward the GLZ, where the bedrock is estimated to be 1050 24 m/a without significant changes between 2007 and 2011. However, downstream of the Union gate, the velocities 500 m below sea level (Fretwell et al., 2013). This subglacial condition implies that an upstream migration of the GLZ increase up to 33 m/a at the continuous GPS stake (Bstat), where no seasonal variations or tidal modulated variability until point F in Figure 9 will not have a strong effect on Union glacier. However, the glacier can respond in a more were detected. dynamic way if this possible migration is affecting Union The GPR survey allowed the detection of many more crevasses than were previously mapped with the ASTER 505 glacier upstream this point. imagery. The 400 MHz GPR is capable of identifying in 1256 real time surface and buried crevasses. The 400 MHz GPR 6 Conclusions crevasses data were compared to the 500 - 900 MHz FMCW
Discussion Paper
Fig.Fig. 9. 9. Comparisons of surface bedrock topography of different sources along transect Comparisons of surface and bedrockand topography of different data sources along transect A - data G (see Figure 8 upper for location of and bedrock year 2010. surface fromCECs 2003-2005, Bedmap 2and surfacebedrock and Bedrock from from Fretwell al. A–Gtransect). (see CECs Fig.surface 8 upper for from location ofIceSat transect). surface yearet 2010. (2013). Bedmap2 bottom dashed line is interpolated. IceSat surface from 2003–2005, Bedmap 2 surface and Bedrock from Fretwell et al. (2013). Bedmap2 bottom dashed line is interpolated.
TCD
Printer-friendly Version Interactive Discussion