Uniprocessor SMC Performance on Vectors with Non-Unit Strides Sally A. McKee Computer Science Report No. CS-93-67 January 31, 1994
This work was supported in part by a grant from Intel Supercomputer Division and by NSF contract MIP-9114110.
Uniprocessor Uniprocessor SMC SMC Performance Performance for on Vectors Vectors with with NonNonUnit unit Strides
Sally A. McKee Department of Computer Science University of Virginia Charlottesville, VA 22903
[email protected]
Abstract Memory bandwidth is rapidly becoming the performance bottleneck in the application of high performance microprocessors to vector-like algorithms, including the “grand challenge” scientific problems. Access ordering is one technique that can help bridge the processor-memory performance gap. Our solution combines compile-time detection of memory access patterns with a memory subsystem that decouples the order of requests generated by the processor from that issued to the memory system. This decoupling permits the requests to be issued in an order that optimizes use of the memory system. The hardware part of this solution is the Stream Memory Controller, or SMC. We have conducted numerous simulation experiments to evaluate uniprocessor SMC performance for unit-stride vectors; the results of these are presented elsewhere. Here we examine uniprocessor SMC performance for non-unit stride vectors. We present simulation results and extend the analytic performance model proposed in an earlier report.
Uniprocessor SMC Performance on Vectors with Non-Unit Strides
Uniprocessor SMC Performance on Vectors with NonUnit Strides 1. Introduction The growing disparity between processor speeds and memory speeds is well known [Kat89, Hen90]. Memory bandwidth is becoming the limiting performance factor for many applications — particularly scientific computations. Access ordering is one technique that can help bridge the processor-memory performance gap. [Moy93] develops and analyzes algorithms to perform access ordering statically at compile time. [McK93c] proposes a combined hardware/software scheme for implementing access ordering dynamically at run-time, and presents simulation results demonstrating its effectiveness. The hardware part of this solution is the Stream Memory Controller (SMC), the design and implementation of which is described in more detail in [McK93b]. We have conducted numerous simulation experiments to evaluate uniprocessor SMC performance for unitstride vectors; results of these can be found in [McK93a]. Here we examine uniprocessor SMC performance for non-unit stride vectors. This report is organized as follows. Section 2 provides a brief introduction to access ordering in general, and Section 3 gives an overview of the design of the SMC. Section 4 and Section 5 describe the simulation environment and benchmark suite used to conduct the experiments whose results are presented in Section 6 and in the Appendix. Section 7 presents the conclusions we draw from these results. 2. Access Ordering Memory components are usually assumed to require about the same amount of time to access any random location, but this assumption no longer applies to modern memory devices: most components manufactured in the last decade provide special capabilities that make it possible to perform some access sequences faster than others. For instance, nearly
1
Uniprocessor SMC Performance on Vectors with Non-Unit Strides
all current DRAMs implement a form of page-mode operation [Qui91]. These devices behave as if implemented with a single on-chip cache line, or page (this should not be confused with a virtual memory page). A memory access falling outside the address range of the current DRAM page forces a new page to be accessed. The overhead time required to set up the new page makes servicing such an access significantly slower than one that hits the current page. Other modern devices offer similar features (e.g. nibble mode, staticcolumn mode, or on-chip SRAM cache) or exhibit novel organizations (e.g. Rambus, Ramlink, or synchronous DRAM) [Ram92, IEEE92]. The order of requests strongly affects the performance of all these components. For multiple-module memory systems, the order of requests is important on yet another level: successive accesses to the same memory bank cannot be performed as quickly as accesses to different banks. To get the best performance out of such a system, we must take advantage of the architecture’s available concurrency. A comprehensive, successful solution to the memory bandwidth problem must exploit the richness of the full memory hierarchy, both its architecture and its component characteristics. One way to do this is via access ordering, which we define as any technique for changing the order of memory requests to increase bandwidth. Here we are especially concerned with ordering a set of vector-like “stream” accesses. 3. The SMC [Moy93] develops algorithms and analyzes the performance benefits and limitations of doing compile-time access ordering. The beneficial impact of access ordering on effective memory bandwidth together with the limitations inherent in implementing the technique statically motivate us to consider an implementation that reorders accesses dynamically at run time. What follows is an overview of the architecture proposed in [McK93b, McK93c]: see those documents for more details.
2
Uniprocessor SMC Performance on Vectors with Non-Unit Strides
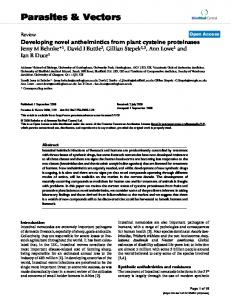
Our discussion is based on the simplified architecture of Figure 1. In this system, memory is interfaced to the processors through a controller labeled “MSU” for Memory Scheduling Unit. The MSU includes logic to issue memory requests as well as logic to determine the order of requests during streaming computations. For non-stream accesses, the MSU provides the same functionality and performance as a traditional memory controller.
scalar accesses
mem
state
FIFO state
FIFO
FIFO
CPU
SBU
MSU
state
mem mem
CACHE mem Figure 1 Stream Memory Controller for Uniprocessor System
The MSU has full knowledge of all streams currently needed by the processor: given the base address, vector stride, and vector length, it can generate the addresses of all elements in a stream. The scheduling unit also knows the details of the memory architecture, including interleaving, device characteristics, and current state. The access-ordering circuitry uses this information to issue requests for individual stream elements in an order that attempts to optimize memory system performance.
3
Uniprocessor SMC Performance on Vectors with Non-Unit Strides
A separate Stream Buffer Unit (SBU) contains high-speed buffers for stream operands and provides control registers that the processor uses to specify stream parameters (base address, stride, length, and data size). Together, the MSU and SBU comprise a Stream Memory Controller (SMC) system. The stream buffers are implemented logically as a set of FIFOs within the SBU, as illustrated in Figure 1. Each stream is assigned to one FIFO, which is asynchronously filled from (or drained to) memory by the access/issue logic of the MSU. The “head” of the FIFO is another memory-mapped register, and load instructions from (or store instructions to) a particular stream reference the FIFO head via this register, dequeueing or enqueueing data as is appropriate. Note that we assume the processor can perform non-caching loads and stores so that nonunit stride streams can be accessed without concomitantly accessing extraneous data and wasting bandwidth. While not a common architectural feature, some commercial processors such as the Convex C-1 [Wal85] and Intel i860 [Int91] include such “cache bypassing”. Others, such as the DEC Alpha [DEC92], provide a means of specifying some portions of memory as non-cacheable. 4. Simulation Environment In order to validate the SMC concept, we have simulated a wide range of SMC configurations and benchmarks, varying FIFO depth, dynamic order/issue policy, number of memory banks, DRAM speed, benchmark algorithm, and vector length, stride, and alignment with respect to memory banks. Complete uniprocessor results for stride-one vectors, including a detailed description of each access-ordering heuristic, can be found in [McK93a]; highlights of these results are presented in [McK93b, McK93c]. Most performance figures in Section 6 are given as a percentage of peak bandwidth, i.e., the bandwidth necessary to allow the processor to perform a memory operation each cycle.
4
Uniprocessor SMC Performance on Vectors with Non-Unit Strides
The vectors used in these simulations are 10,000 doublewords in length, and all vectors within a computation have the same stride. In all cases, servicing an access that misses the current DRAM page is assumed to require four times as long as servicing a page-hit. This 4:1 cost ratio is fairly representative of current technology. The DRAM page size used in the simulations discussed here is 4K doublewords (this is twice the page size used in [McK93a, McK93b, and McK93b]). This may seem large with respect to current technology, but this is of little import, for DRAM page size and vector stride are strongly related performance parameters. SMC performance for vectors of stride S on a system with DRAM pages of size N is identical to that for vectors of stride 2S on a system with pages of size 2N, assuming that both strides hit the same number of memory banks. To determine performance for DRAM components with a smaller page, we simply look at SMC performance for vectors with the appropriate larger stride, scaling the interleaving factor if necessary. This keeps the number of banks used by the computation and the number of vector elements per page constant, hence performance remains constant. 5. Benchmark Suite Scientific computations are perhaps the most obvious examples of applications that are severely bandwidth-limited. Caching may provide adequate bandwidth for some, but not all, portions of such programs. The bottlenecks in these computations usually take the form of memory-intensive inner loops, which tend to derive little benefit from caching. Thus we have chosen a suite of benchmark kernels representing access patterns found in the inner loops of real scientific codes. Scalar and instruction references are assumed to hit in the cache, and all stream references use non-caching loads and stores. In the following, “axpy” refers to a computation involving some entity a times a vector x plus a vector y, with the first letter of the name indicating the type of a. For instance, daxpy denotes a computation involving a double-precision scalar times a vector plus a vector.
5
Uniprocessor SMC Performance on Vectors with Non-Unit Strides
Our benchmark suite is depicted in Figure 2. Daxpy, copy, scale, and swap are from the BLAS (Basic Linear Algebra Subroutines) [Law79, Don79]. These vector and matrix computations occur frequently in scientific applications, and have been collected into a set of library routines that are highly optimized for various architectures. Hydro and tridiag are the first and fifth Livermore Loops [McM86], a set of kernels culled from important scientific computations. The former is a hydrodynamics code fragment, and the latter is a tridiagonal elimination computation. Although the computations differ, their access patterns are identical, thus results for these benchmarks are presented together. Vaxpy is a vector axpy computation that occurs in matrix-vector multiplication by diagonals; this algorithm is useful for the diagonally sparse matrices that arise frequently in the solution of parabolic or elliptic partial differential equations by finite element or finite difference methods [Gol93]. copy:
∀i
yi ← xi
daxpy:
∀i
y i ← ax i + y i
hydro:
∀i
x i ← q + y i × ( r × zx i + 10 + t × zx i + 11 )
scale:
∀i
x i ← ax i
swap:
∀i
tmp ← y i
tridiag:
∀i
xi ← zi × ( yi – xi – 1)
vaxpy:
∀i
yi ← ai xi + yi
yi ← xi
x i ← tm
Figure 2 Benchmark Algorithms Note that although these computations do not reuse vector elements, they are often found in the inner loops of algorithms that do, as with vaxpy for matrix-vector multiply, and blocked algorithms such as those in the Level 3 BLAS [Don90]. 6. Results Figure 3 through Figure 10 illustrate performance for vectors of various strides run on four different memory systems with several SMC configurations. We present results for two different dynamic ordering policies, algorithms A1 and T1 from [McK93a]. These figures
6
Uniprocessor SMC Performance on Vectors with Non-Unit Strides
represent SMC performance on the copy benchmark as a function of vector stride and FIFO depth or number of memory banks. Since these are representative of all results, they are discussed in detail here. Performance graphs for other benchmarks are similar, and are included in the Appendix. Non-SMC system performance numbers presented here were generated with the simulator of [Moy93]. These results represent the bandwidth attained by executing the benchmark’s accesses in their natural order (without loop unrolling or other compiler optimizations) using non-caching loads and stores. 6.1 Algorithm A1 In this ordering scheme, the MSU examines each FIFO in round-robin order, initiating accesses for the current FIFO until no ready accesses remain. Here a ready access refers to an empty position in a read FIFO (that position is ready to be filled with the appropriate data element) or a full position in a write FIFO (the corresponding data element is ready to be written to memory). If there are no ready accesses, the MSU advances to the next FIFO and proceeds to initiate accesses for it. While servicing a particular FIFO, if the next ready access from that FIFO is to a busy bank, the MSU waits until the bank is idle; it does not try to find an access to a currently idle bank. In the simulation experiments involving A1, the vectors are all aligned to begin in the same bank of memory. For unit-stride vectors, this alignment has little effect on SMC performance, since accesses are reordered and the vectors are distributed evenly across all banks of memory. In general, such an alignment limits achievable bandwidth in the cases where the vector stride is not relatively prime to the number of memory banks: only a subset of the banks will be used, thus the SMC cannot take full advantage of the system’s available concurrency. Since A1 services each FIFO (i.e. each vector) in turn, however, the relative alignment of the vectors in the computation has little effect on performance.
7
Uniprocessor SMC Performance on Vectors with Non-Unit Strides
Figure 3 provides an overview of the effect increasing vector stride has on SMC performance for the copy benchmark. For a single-bank system, smaller strides yield very similar performance, as depicted in Figure 3(a). Strides of up to 64 yield in excess of about 95% of the total system bandwidth. When the stride grows to 512, performance ceases to be limited by FIFO depth, and is instead limited by the number of vector elements per DRAM page. Since in this case there are only 8 vector elements in each page, the best the SMC can do is to get 7 page-hits for each page-miss. The attainable bandwidth is thus 100 limited to --------------------------------------------------------------- = 72.73 % of available system bandwidth. At a ( 4 + ( 7 × 1 ) ) ⁄ 8 = 1.375 stride of 8K, only one vector element resides in a DRAM page, thus every access necessarily misses the current DRAM page, realizing only 25% of the available system bandwidth. Performance is identical to that of a non-SMC system using non-caching loads and stores. Figure 3(b) illustrates performance on a system with two interleaved memory banks. Performance for unit-stride vectors and deep FIFOs is akin to that for a single-bank system. For the non-unit strides depicted here, all vector elements fall in just one of the two banks. The SMC cannot take advantage of the system’s available concurrency, thus performance is limited to half of the potential bandwidth. As indicated by the curves for stride-8 and stride-64, we can expect the SMC to deliver close to 50% of the full system bandwidth for even strides around this range. Performance for odd-stride vectors in this range corresponds to that for like strides on a single-bank system. Non-SMC performance and SMC performance for large-stride vectors are limited to 12.5% of the system bandwidth. As illustrated by the non-unit-stride curves in Figure 3(c) and Figure 3(d), SMC performance is bounded by a maximum of 25% of system bandwidth in the four-bank case and 12.5% in the eight-bank case. Performance for very large-stride vectors is only 9.99% and 7.12% of total bandwidth for these respective memory systems. Although the vector stride is as large as the DRAM page size, the interleaving factors make the effective stride
8
Uniprocessor SMC Performance on Vectors with Non-Unit Strides
within a single bank small enough that the SMC can take some advantage of page-mode operation. The corresponding non-SMC systems incur the DRAM page-miss overhead at each access, and are thus limited to one-quarter of the maximum attainable bandwidth, or 6.25% and 3.12% of peak. The unit-stride curves in Figure 3 emphasize that as the degree of interleaving increases, deep FIFOs become essential to good performance. The straight lines in the graphs indicate that for very large strides, FIFO depth no longer affects performance.
100
100
80
80
% bandwidth
% bandwidth
stride 1 stride 8 stride 64 stride 512 stride 8192
60 40 20 0
60 40 20 0
8
16
32
64
128 256
8
16
fifo depth
(a) one bank
64
128 256
(b) two banks
100
100
80
80
% bandwidth
% bandwidth
32
fifo depth
60 40 20 0
60 40 20 0
8
16
32
64
fifo depth
(c) four banks
128 256
8
16
32
64
128 256
fifo depth
(d) eight banks
Figure 3 copy Performance for Increasing Strides Figure 4 through Figure 7 give a more detailed view of how SMC performance changes with vector stride. These results are given as a percentage of the system’s peak bandwidth.
9
Uniprocessor SMC Performance on Vectors with Non-Unit Strides
The highest value on the y-axis in each graph indicates the maximum attainable bandwidth for a computation using vectors of the given strides on a particular memory system. 100
% bandwidth
80 60 40 20
7 15 23 31 63 127 255 511 1023 2047 4095 8191
0
vector stride
Figure 4 copy Performance for a 1-Bank Memory System with 256-Deep FIFOs Figure 4 depicts performance for a single-bank SMC-system with FIFOs that are 256 double-words deep. The percentage of system bandwidth delivered remains above 90% for strides up to 127. As we saw earlier, performance for strides greater than the DRAM page size, 2K double words, is limited to 25% of the potential bandwidth by virtue of the 4:1
50
80
40
% bandwidth
100
60 40
30 20 10
0
0
vector stride
(a) gcd(stride, banks) = 1
6 14 22 30 62 126 254 510 1022 2046 4094 8190
20
7 15 23 31 63 127 255 511 1023 2047 4095 8191
% bandwidth
page-miss/page-hit cost ratio.
vector stride
(b) gcd(stride, banks) = 2
Figure 5 copy Performance for a 2-Bank Memory System with 256-Deep FIFOs
10
Uniprocessor SMC Performance on Vectors with Non-Unit Strides
Figure 5 depicts SMC performance on the copy benchmark for two families of strides and a two-bank memory system. Figure 5(a) illustrates the percentage of system bandwidth delivered for vectors with odd strides (i.e. relatively prime to the number of banks), and Figure 5(b) illustrates performance for even strides. Note that the these two graphs are drawn to different scales: the percentage of peak bandwidth delivered in the case of even strides is limited to half that possible for odd strides. Performance for the odd strides is comparable to that for the same strides on a single-bank system: the percentage of peak
50
80
40
% bandwidth
100
60 40
30 20 10
0
0 6 14 22 30 62 126 254 510 1022 2046 4094 8190
20
7 15 23 31 63 127 255 511 1023 2047 4095 8191
% bandwidth
bandwidth delivered does not fall below 90% until the stride grows above 127.
vector stride
vector stride
(a) gcd(stride, banks) = 1
(b) gcd(stride, banks) = 2 25
% bandwidth
20 15 10 5
4 12 20 28 60 124 252 508 1020 2044 4092 8188
0
vector stride
(c) gcd(stride, banks) = 4 Figure 6 copy Performance for a 4-Bank Memory System with 256-Deep FIFOs
11
100
50
80
40
% bandwidth
60 40
30 20 10
0
0 7 15 23 31 63 127 255 511 1023 2047 4095 8191
20
6 14 22 30 62 126 254 510 1022 2046 4094 8190
% bandwidth
Uniprocessor SMC Performance on Vectors with Non-Unit Strides
vector stride
(a) gcd(stride, banks) = 1
vector stride
(b) gcd(stride, banks) = 2
25 10
% bandwidth
% bandwidth
20 15 10
5
5
4 12 20 28 60 124 252 508 1020 2044 4092 8188
vector stride
(c) gcd(stride, banks) = 4
8 16 24 32 64 128 256 512 1024 2048 4096 8192
0
0
vector stride
(d) gcd(stride, banks) = 8
Figure 7 copy Performance for an 8-Bank Memory System with 256-Deep FIFOs
Figure 6 illustrates SMC performance for a memory system with four interleaved banks and three families of strides, and Figure 7 presents the analogous information for an eightbank system. The strides in Figure 6(a) and Figure 7(a) are relatively prime to the number of banks. The greatest common denominator (gcd) of the number of banks and the strides in Figure 6(b) and Figure 7(b) is two: only half the memory banks are being used, and SMC performance is limited to 50% of the system peak. For the strides in Figure 6(c) and
12
Uniprocessor SMC Performance on Vectors with Non-Unit Strides
Figure 7(c), the gcd is four, thus achievable bandwidth is limited to 25% of peak. Likewise, for the strides in Figure 7(d), achievable bandwidth only 12.5% of peak. In all cases, the SMC delivers very close to the maximum achievable bandwidth for strides up to about 256.
1 bank 2 banks 4 banks 8 banks 100
% system bandwidth
% system bandwidth
100 80 60 40 20 0
80 60 40 20 0
8
16
32
64
128 256
8
16
fifo depth
a) stride 2
64
128 256
b) stride 4 100
% system bandwidth
100
% system bandwidth
32
fifo depth
80 60 40 20 0
80 60 40 20 0
8
16
32
64
128 256
8
16
fifo depth
c) stride 16
32
64
128 256
fifo depth
d) stride 256
Figure 8 copy Performance as a Percentage of System Bandwidth
Figure 8 and Figure 9 illustrate how SMC performance varies with the number of memory banks as vector stride increases. Figure 8 depicts performance as a percentage of the peak system bandwidth. Figure 9 presents the same curves scaled to indicate the relative percentage of attainable bandwidth. As the vector stride grows, the systems with more
13
Uniprocessor SMC Performance on Vectors with Non-Unit Strides
banks deliver a greater percentage of attainable bandwidth. This is especially evident in Figure 9(d). This phenomenon occurs because in a multi-bank memory system, the distance between vector elements within a single bank is the vector stride divided by the stride number of banks the vector hits: -------------------------------------- . We refer to this value as the effective gcd ( b, stride ) intrabank stride, or eis. Thus with two interleaved banks, elements of a stride-two vector have an eis of 1, and are contiguous within a single bank of memory. In general, when more vector elements are contained within a DRAM page, fewer page-misses are incurred, and the SMC is able to deliver a greater portion of the attainable bandwidth for that memory system and vector stride.
100
100
80
80
% bandwidth
% bandwidth
1 bank 2 banks 4 banks 8 banks
60 40 20 0
60 40 20 0
8
16
32
64
128 256
8
16
fifo depth
a) stride 2
64
128 256
b) stride 4
100
100
80
80
% bandwidth
% bandwidth
32
fifo depth
60 40 20 0
60 40 20 0
8
16
32
64
128 256
8
16
fifo depth
c) stride 16
32
64
128 256
fifo depth
d) stride 256
Figure 9 copy Performance as a Percentage of Attainable Bandwidth
14
Uniprocessor SMC Performance on Vectors with Non-Unit Strides
6.2 Algorithm T1 Although vector alignment had little effect on algorithm A1’s performance, it has a significant effect on the performance of our second ordering scheme, T1. This policy is able to take better advantage of memory system concurrency for non-unit stride vectors. Like A1, T1 tries to initiate a memory access at each available bus cycle. In doing so, however, it considers only one memory bank, the next one in round-robin order from the bank considered during the last “turn”. If that bank is busy, or if no ready access to it exists, then no access is initiated at the current time. Otherwise, first looks for an access that hits the current DRAM page, and if found, issues it. If no such access exists, then an access is issued for the FIFO requiring the most service from that bank. The vectors used in simulations involving T1 are aligned such that the ith vector in the computation, vi, resides in bank bi mod n,
where n is the total number of memory banks.
Figure 10 presents an overview of the effect increasing vector stride has on the performance of SMC systems using the T1 ordering scheme, much as Figure 3 did for systems using the A1 ordering policy. Figure 10(a) illustrates results for a single-bank memory system. For deep FIFOs, performance is similar to that for A1. For shallow FIFOs and larger vector strides, T1 makes better use of available buffer space than A1. For strides of at least 512, bandwidth is independent of FIFO depth. At a stride of 8192, performance for both the SMC and non-SMC systems is limited to 25% of peak, since at this stride every access incurs the DRAM page-miss overhead. For the non-unit strides shown in Figure 10(b), the combination of a more favorable vector alignment and a more intelligent ordering scheme allows the SMC to deliver at least twice the bandwidth achieved for the alignment and policy (A1) used in Figure 3(b). At a FIFO depth of 256, T1 delivers 99.64%, 97.63%, 84.12%, and 25% of peak bandwidth for strides 8, 64, 512, and 8192, respectively, whereas the corresponding values for A1 are 49.57%, 48.57%, 41.91%, and 12.5%. For even strides, each of the two vectors in the benchmark
15
Uniprocessor SMC Performance on Vectors with Non-Unit Strides
lies entirely within one memory bank. The SMC need never switch DRAM pages (recall that scalar and operand references are assumed to hit in cache), thus the only page-misses are the compulsory ones incurred when crossing page boundaries. This explains why FIFO depth has no effect on performance for these non-unit stride vectors. For stride-8192 vectors, a non-SMC system can deliver performance to that of the SMC, since at this stride, DRAM page size, and two banks, all accesses miss the current page. Odd-stride vectors will exhibit performance much like that for similar-stride vectors depicted in Figure 10(a).
100
100
80
80
% bandwidth
% bandwidth
stride 1 stride 8 stride 64 stride 512 stride 8192
60 40 20 0
60 40 20 0
8
16
32
64
128 256
8
16
fifo depth
64
128 256
fifo depth
(a) one bank
(b) two banks
100
100
80
80
% bandwidth
% bandwidth
32
60 40 20 0
60 40 20 0
8
16
32
64
fifo depth
(c) four banks
128 256
8
16
32
64
128 256
fifo depth
(d) eight banks
Figure 10 copy Performance for Increasing Strides (Algorithm T1)
16
Uniprocessor SMC Performance on Vectors with Non-Unit Strides
When we go to a four-bank memory system, attainable bandwidth is once again limited to 50% of peak system bandwidth for these non-unit strides, as illustrated in Figure 10(c). The gcd of these strides and the four banks is two, thus the SMC can only make use of half the memory banks. Even so, we still encounter only compulsory page-misses, thus bandwidth for these non-unit strides is constant across all FIFO depths. Figure 10(d) exhibits a similar phenomenon for an eight-bank system, with attainable bandwidth limited to 25% of peak. For the memory systems of Figure 10(c) and Figure 10(d), the DRAM pages contain more than one vector element, even at stride 8192. By exploiting the DRAM’s page-mode, the SMC systems deliver better performance than the comparable non-SMC systems, for which every access generates a page-miss. The non-SMC systems are limited to 15.17% and 10.65% of peak for the memory systems with four and eight banks, respectively. The corresponding SMC systems deliver 20% and 14.28% of peak system bandwidth. Note that the vector alignment used for these experiments allows both SMC and non-SMC systems to take better advantage of each interleaved memory’s concurrency, thus performance for this alignment always exceeds that for the less-favorable alignment used in Section 6.1. 6.3 An Analytic Model The graphs in Figure 4 through Figure 7 in Section 6.1 emphasize that for larger strides, the predominant factor affecting performance is no longer FIFO depth, but the number of vector elements per page. In light of this, we might expect the bandwidth delivered for stride-one vectors an SMC system with 16-deep FIFOs to perform comparably to a similar system with deeps FIFOs and a vector stride equal to the page size divided by sixteen times the data size. The relationship turns out to be slightly more complicated than this, but is explained by the analytic model of [McK93d]. Let b be the number of interleaved memory banks, f be the depth of the FIFOs, v be the number of distinct vectors in the computation, and s be the number of streams. A single-
17
Uniprocessor SMC Performance on Vectors with Non-Unit Strides
access vector constitutes one stream, whereas a read-modify-write vector counts as two. The model states that the average page-miss rate for each FIFO in a stride-1 computation b ( s – 1) ( v – 1) - [McK93d]. This formula also applies to involving at least two vectors is --------------------------------------2 f×s vectors with non-unit strides, provided that the number of vector elements residing in a DRAM page is significantly greater than the FIFO depth. The ( s – 1 ) ⁄ s part of this equation comes from taking the limit of a converging series; this series models the effect created by the processor’s draining data from the FIFO at the same time that the memory system is filling it. This processor interaction makes SMC performance for 16-deep FIFOs different from that for vectors having sixteen elements per DRAM page, thus we must extend the model in order to describe performance for large-stride vectors. As noted in Section 4, decreasing DRAM page size and increasing vector stride affect SMC performance in similar ways. Let p be the number of data elements in a DRAM (i.e., page size divided by data size). Then for vectors with large eis values (up to p), the average pagestride miss rate per FIFO is ----------------------------------------------- , or eis ⁄ p . Computations involving vectors with gcd ( b, stride ) × p effective intrabank strides greater than p will have the same performance as those with an eis of p: in both cases, only one vector element resides in a DRAM page. For single-vector computations, only the first access to each bank generates a DRAM page miss. The average page-miss rate per stream for a unit-stride vector is thus b ⁄ p [McK93d]. For a non-unit stride vector, the average miss rate becomes gcd ( b, stride ) ⁄ p . We can now use these miss rates to calculate SMC performance. Let h be the cost of servicing an access that hits the current DRAM page, and let m be the cost of servicing an access that misses the current DRAM page. The percentage of attainable bandwidth delivered by the computation is approximately: h ----------------------------------------------------------------------------------------------------- × 100 ( missrate × m ) + ( ( 1 – missrate ) × h )
18
Uniprocessor SMC Performance on Vectors with Non-Unit Strides
Dividing the percentage of attainable bandwidth by the gcd gives the percentage of peak system bandwidth. Note that neither FIFO depth nor the processor’s access pattern comes into play in the large-stride model: analytic results for large strides are identical for all benchmarks (given sufficiently deep FIFOs).
Table 1 Analytic vs. Simulated Performance Results for copy
Simulated
Modeled
Simulated
Modeled
Simulated
Modeled
Simulated
Difference
8 Banks Difference
4 Banks Difference
2 Banks Difference
1 Bank Modeled
Stride
Percentage of Peak System Bandwidth
1020
57.24
57.10
0.14
36.40
36.27
0.13
21.07
20.97
0.10
21.07
20.90
0.17
1022
57.19
57.00
0.19
36.38
36.23
0.15
36.38
36.39
-0.01
36.38
36.36
0.02
1023
57.17
57.03
0.14
57.17
56.90
0.27
57.17
56.50
0.67
57.17
56.11
1.06
1024
57.14
56.99
0.15
36.36
36.23
0.13
21.05
20.96
0.09
11.43
11.37
0.06
2044
40.05
39.96
0.09
28.60
28.50
0.09
18.19
18.11
0.08
18.19
18.21
-0.02
2046
40.02
39.98
0.04
28.58
28.52
0.06
28.58
28.47
0.11
28.58
28.29
0.29
2047
40.01
39.97
0.04
40.01
39.92
0.09
40.01
39.84
0.17
40.01
39.64
0.37
2048
40.00
39.95
0.05
28.5
28.50
0.07
18.18
18.11
0.07
10.53
10.48
0.05
4092
25.02
25.02
0.00
20.01
19.99
0.02
14.29
14.26
0.03
14.29
14.24
0.05
4094
25.01
25.01
0.00
20.01
19.98
0.03
20.01
19.97
0.04
20.01
19.93
0.08
4095
25.01
25.00
0.00
25.01
25.00
0.00
25.01
24.98
0.02
25.01
24.96
0.04
4096
25.00
25.00
0.00
20.00
19.98
0.02
14.29
14.25
0.04
9.09
9.06
0.03
8188
25.00
25.00
0.00
12.51
12.51
0.00
10.0
9.99
0.01
10.00
9.98
0.02
8190
25.00
25.00
0.00
12.50
12.50
0.00
12.50
12.50
0.00
12.50
12.49
0.01
8191
25.00
25.00
0.00
25.00
24.99
0.01
25.00
24.95
0.05
25.00
24.92
0.08
8192
25.00
25.00
0.00
12.50
12.50
0.00
10.00
9.99
0.01
7.14
7.12
0.02
gcd(banks, stride) = 1
gcd(banks, stride) = 2
gcd(banks, stride) = 4
gcd(banks, stride) = 8
19
Uniprocessor SMC Performance on Vectors with Non-Unit Strides
Table 1 compares analytic and simulated performance results of the copy benchmark with large strides on memory systems with deep FIFOs and one to four banks. Table entries are shaded according to the value of gcd ( b, stride ) . Strides for which the gcd is one are left white, whereas strides with a gcd of two through eight are grayed, with darker shades representing greater values. Recall that performance is limited to 50%, 25%, and 12.5% of system bandwidth for computations using strides with gcds of two, four, and eight, respectively. Note that the differences in almost all cases are less than 0.2% of peak bandwidth. The largest differences occur for the two smaller strides that are relatively prime to the number of banks. The maximum difference is only 1.06% of peak, for a stride of 1023 on an eight-bank memory system. 7. Conclusions Our experiments indicate that small changes in stride have little effect on SMC performance, provided the number of banks hit by the vectors remains constant. For all SMC configurations and memory systems examined here, the SMC is able to deliver very close to the maximum attainable performance for small to moderate strides. Although SMC systems are fairly immune to changes in vector stride, data alignment has a significant effect on achievable bandwidth. Obviously the SMC cannot deliver better bandwidth than the layout of operands will allow. Mapping different vectors of the computation to different sets of memory banks allows the SMC to more effectively exploit page-mode and similar component capabilities; as we have seen, this can improve bandwidth considerably. Aligning the vectors in a computation such that all memory banks are used will insure that the concurrency of the memory architecture is exploited. One way to achieve this is to use a stride that is relatively prime to the number of memory banks. Skewed storage [Bud71, Har87] or dynamic address transformations [Har89, Rau91] provide another means of increasing concurrency.
20
Uniprocessor SMC Performance on Vectors with Non-Unit Strides
Very large vector strides hinder the SMC’s ability to take advantage of page-mode, but given such a stride, the SMC will do the best it can to maximize bandwidth. Note that our simulations do not reflect the greater number of TLB misses — and subsequent effects on performance — that larger strides are likely to generate. Here we have modeled the processor as a simple generator of loads and stores, in order to place maximum stress on the memory system. In practice, the SMC will be able to overlap memory latency with computation by prefetching read operands, thereby mitigating some of the unfavorable effects larger strides have on memory bandwidth. Finally, we have presented an extension to the analytic model of [McK93d] to explain SMC performance for non-unit strides. In particular, we have developed a performance model for when FIFO depth exceeds the number of data elements residing within a DRAM page.
21
Uniprocessor SMC Performance on Vectors with Non-Unit Strides
Appendix
1 bank 2 banks 4 banks 8 banks x: stride 1 y: stride 1024
80
100
% system bandwidth
% system bandwidth
100
60 40 20 0
x: stride 1 y: stride 1024
80 60 40 20 0
8
16
32
64
128 256
8
16
fifo depth
% system bandwidth
% system bandwidth
128 256
(b) T1 ordering and alignment 100
x: stride 1024 y: stride 1024
80
64
fifo depth
(a) A1 ordering and alignment 100
32
60 40 20 0
x: stride 1024 y: stride 1024
80 60 40 20 0
8
16
32
64
128 256
fifo depth
(c) A1 ordering and alignment
8
16
32
64
128 256
fifo depth
(d) T1 ordering and alignment
Figure 11 copy Performance for Vectors of Different Strides
Figure 11 depicts SMC performance on the copy benchmark when the two vectors are of different strides. In these experiments, x is a unit-stride vector, while y has a very large stride (1024). Figure 11(a) uses the ordering policy and vector alignment of Section 6.1. Figure 11(b) uses the ordering policy and vector alignment of Section 6.2. Relative vector alignment, ordering policy, and FIFO depth have little effect on bandwidth. This indicates that performance is dominated by the accesses to vector y, all elements of which lie in a
22
Uniprocessor SMC Performance on Vectors with Non-Unit Strides
single bank. Figure 11(c) illustrates bandwidth for copy using two stride-1024 vectors and the alignment and ordering policy Section 6.1, and Figure 11(d) presents analogous results for the alignment and ordering policy Section 6.2. Note that in Figure 11(d) the SMC performance for a two-bank memory far exceeds that for the other memory systems in Figure 11(c) and Figure 11(d). This results from the advantageous partitioning of the vectors among the banks: x lies in the even banks, and y lies in the odd banks. Figure 12 through Figure 34 present simulation results for the remaining kernels in our benchmark suite. These results were generated using the ordering scheme and vector alignment from Section 6.1, unless otherwise indicated. Performance trends for these benchmarks are remarkably like those exhibited by copy, thus in the interests of brevity we omit performance details for deep FIFOs and the various families of vector strides for one, two, and four-bank memory systems. Figure 12 through Figure 16 describe SMC performance on the daxpy benchmark. Figure 17 through Figure 21 present the same kinds of information for the hydro and tridiag kernels. Figure 22 through Figure 24 depict simulation results for scale. Since this benchmark involves only one vector, performance is almost entirely unaffected by changes in FIFO depth and is completely immune to changes in vector alignment. We therefore omit results for the ordering scheme and alignment of Section 6.2. We also leave out the detailed breakdown of performance for changing strides and an eight-bank memory system with deep FIFOs. Performance for the swap kernel is presented in Figure 25 through Figure 29, and performance for vaxpy is given in Figure 30 through Figure 34.
23
50
80
40
% bandwidth
100
60 40
30 20 10
0
0 6 14 22 30 62 126 254 510 1022 2046 4094 8190
20
7 15 23 31 63 127 255 511 1023 2047 4095 8191
% bandwidth
Uniprocessor SMC Performance on Vectors with Non-Unit Strides
vector stride
(a) gcd(stride, banks) = 1
vector stride
(b) gcd(stride, banks) = 2
25 10
% bandwidth
% bandwidth
20 15 10
5
5
4 12 20 28 60 124 252 508 1020 2044 4092 8188
vector stride
(c) gcd(stride, banks) = 4
8 16 24 32 64 128 256 512 1024 2048 4096 8192
0
0
vector stride
(d) gcd(stride, banks) = 8
Figure 12 daxpy Performance for an 8-Bank Memory System with 256-Deep FIFOs
24
Uniprocessor SMC Performance on Vectors with Non-Unit Strides
100
% system bandwidth
% system bandwidth
100 80 60 40 20 0
80 60 40 20 0
8
16
32
64
128 256
8
16
fifo depth
a) stride 2
64
128 256
b) stride 4 100
% system bandwidth
100
% system bandwidth
32
fifo depth
80 60 40 20 0
80 60 40 20 0
8
16
32
64
128 256
8
16
fifo depth
c) stride 16
32
64
128 256
fifo depth
d) stride 256
Figure 13 daxpy Performance as a Percentage of System Bandwidth
25
100
100
80
80
% bandwidth
% bandwidth
Uniprocessor SMC Performance on Vectors with Non-Unit Strides
60 40 20 0
60 40 20 0
8
16
32
64
128 256
8
16
fifo depth
a) stride 2
64
128 256
b) stride 4
100
100
80
80
% bandwidth
% bandwidth
32
fifo depth
60 40 20 0
60 40 20 0
8
16
32
64
128 256
8
16
fifo depth
c) stride 16
32
64
128 256
fifo depth
d) stride 256
Figure 14 daxpy Performance as a Percentage of Attainable Bandwidth
26
Uniprocessor SMC Performance on Vectors with Non-Unit Strides
100
100
80
80
% bandwidth
% bandwidth
stride 1 stride 8 stride 64 stride 512 stride 8192
60 40 20 0
60 40 20 0
8
16
32
64
128 256
8
16
fifo depth
(a) one bank
64
128 256
(b) two banks
100
100
80
80
% bandwidth
% bandwidth
32
fifo depth
60 40 20 0
60 40 20 0
8
16
32
64
fifo depth
(c) four banks
128 256
8
16
32
64
128 256
fifo depth
(d) eight banks
Figure 15 daxpy Performance for Increasing Strides (A1)
27
Uniprocessor SMC Performance on Vectors with Non-Unit Strides
100
100
80
80
% bandwidth
% bandwidth
stride 1 stride 8 stride 64 stride 512 stride 8192
60 40 20 0
60 40 20 0
8
16
32
64
128 256
8
16
fifo depth
(a) one bank
64
128 256
(b) two banks
100
100
80
80
% bandwidth
% bandwidth
32
fifo depth
60 40 20 0
60 40 20 0
8
16
32
64
fifo depth
(c) four banks
128 256
8
16
32
64
128 256
fifo depth
(d) eight banks
Figure 16 daxpy Performance for Increasing Strides (T1)
28
50
80
40
% bandwidth
100
60 40
30 20 10
0
0 6 14 22 30 62 126 254 510 1022 2046 4094 8190
20
7 15 23 31 63 127 255 511 1023 2047 4095 8191
% bandwidth
Uniprocessor SMC Performance on Vectors with Non-Unit Strides
vector stride
(a) gcd(stride, banks) = 1
vector stride
(b) gcd(stride, banks) = 2
25 10
% bandwidth
% bandwidth
20 15 10
5
5
4 12 20 28 60 124 252 508 1020 2044 4092 8188
vector stride
(c) gcd(stride, banks) = 4
8 16 24 32 64 128 256 512 1024 2048 4096 8192
0
0
vector stride
(d) gcd(stride, banks) = 8
Figure 17 hydro/tridiag Performance for an 8-Bank Memory System with 256-Deep FIFOs
29
Uniprocessor SMC Performance on Vectors with Non-Unit Strides
100
% system bandwidth
% system bandwidth
100 80 60 40 20 0
80 60 40 20 0
8
16
32
64
128 256
8
16
fifo depth
a) stride 2
64
128 256
b) stride 4 100
% system bandwidth
100
% system bandwidth
32
fifo depth
80 60 40 20 0
80 60 40 20 0
8
16
32
64
128 256
8
16
fifo depth
c) stride 16
32
64
128 256
fifo depth
d) stride 256
Figure 18 hydro/tridiag Performance as a Percentage of System Bandwidth
30
100
100
80
80
% bandwidth
% bandwidth
Uniprocessor SMC Performance on Vectors with Non-Unit Strides
60 40 20 0
60 40 20 0
8
16
32
64
128 256
8
16
fifo depth
a) stride 2
64
128 256
b) stride 4
100
100
80
80
% bandwidth
% bandwidth
32
fifo depth
60 40 20 0
60 40 20 0
8
16
32
64
128 256
8
16
fifo depth
c) stride 16
32
64
128 256
fifo depth
d) stride 256
Figure 19 hydro/tridiag Performance as a Percentage of Attainable Bandwidth
31
Uniprocessor SMC Performance on Vectors with Non-Unit Strides
100
100
80
80
% bandwidth
% bandwidth
stride 1 stride 8 stride 64 stride 512 stride 8192
60 40 20 0
60 40 20 0
8
16
32
64
128 256
8
16
fifo depth
(a) one bank
64
128 256
(b) two banks
100
100
80
80
% bandwidth
% bandwidth
32
fifo depth
60 40 20 0
60 40 20 0
8
16
32
64
fifo depth
(c) four banks
128 256
8
16
32
64
128 256
fifo depth
(d) eight banks
Figure 20 hydro/tridiag Performance for Increasing Strides (A1)
32
Uniprocessor SMC Performance on Vectors with Non-Unit Strides
100
100
80
80
% bandwidth
% bandwidth
stride 1 stride 8 stride 64 stride 512 stride 8192
60 40 20 0
60 40 20 0
8
16
32
64
128 256
8
16
fifo depth
(a) one bank
64
128 256
(b) two banks
100
100
80
80
% bandwidth
% bandwidth
32
fifo depth
60 40 20 0
60 40 20 0
8
16
32
64
fifo depth
(c) four banks
128 256
8
16
32
64
128 256
fifo depth
(d) eight banks
Figure 21 hydro/tridiag Performance for Increasing Strides (T1)
33
50
80
40
% bandwidth
100
60 40
30 20 10
0
0 6 14 22 30 62 126 254 510 1022 2046 4094 8190
20
7 15 23 31 63 127 255 511 1023 2047 4095 8191
% bandwidth
Uniprocessor SMC Performance on Vectors with Non-Unit Strides
vector stride
(b) gcd(stride, banks) = 2 12.5
20
10.0
% bandwidth
25
15 10
7.5 5.0 2.5
0
0.0
vector stride
(c) gcd(stride, banks) = 4
8 16 24 32 64 128 256 512 1024 2048 4096 8192
5
4 12 20 28 60 124 252 508 1020 2044 4092 8188
% bandwidth
(a) gcd(stride, banks) = 1
vector stride
vector stride
(d) gcd(stride, banks) = 8
Figure 22 scale Performance for an 8-Bank Memory System with 256-Deep FIFOs
34
Uniprocessor SMC Performance on Vectors with Non-Unit Strides
100
% system bandwidth
% system bandwidth
100 80 60 40 20 0
80 60 40 20 0
8
16
32
64
128 256
8
16
fifo depth
a) stride 2
64
128 256
b) stride 4 100
% system bandwidth
100
% system bandwidth
32
fifo depth
80 60 40 20 0
80 60 40 20 0
8
16
32
64
128 256
8
16
fifo depth
c) stride 16
32
64
128 256
fifo depth
d) stride 256
Figure 23 scale Performance as a Percentage of System Bandwidth
35
100
100
80
80
% bandwidth
% bandwidth
Uniprocessor SMC Performance on Vectors with Non-Unit Strides
60 40 20 0
60 40 20 0
8
16
32
64
128 256
8
16
fifo depth
a) stride 2
64
128 256
b) stride 4
100
100
80
80
% bandwidth
% bandwidth
32
fifo depth
60 40 20 0
60 40 20 0
8
16
32
64
128 256
8
16
fifo depth
c) stride 16
32
64
128 256
fifo depth
d) stride 256
Figure 24 scale Performance as a Percentage of Attainable Bandwidth
36
50
80
40
% bandwidth
100
60 40
30 20 10
0
0 6 14 22 30 62 126 254 510 1022 2046 4094 8190
20
7 15 23 31 63 127 255 511 1023 2047 4095 8191
% bandwidth
Uniprocessor SMC Performance on Vectors with Non-Unit Strides
vector stride
(a) gcd(stride, banks) = 1
vector stride
(b) gcd(stride, banks) = 2
25 10
% bandwidth
% bandwidth
20 15 10
5
5
4 12 20 28 60 124 252 508 1020 2044 4092 8188
vector stride
(c) gcd(stride, banks) = 4
8 16 24 32 64 128 256 512 1024 2048 4096 8192
0
0
vector stride
(d) gcd(stride, banks) = 8
Figure 25 swap Performance for an 8-Bank Memory System with 256-Deep FIFOs
37
Uniprocessor SMC Performance on Vectors with Non-Unit Strides
100
% system bandwidth
% system bandwidth
100 80 60 40 20 0
80 60 40 20 0
8
16
32
64
128 256
8
16
fifo depth
a) stride 2
64
128 256
b) stride 4 100
% system bandwidth
100
% system bandwidth
32
fifo depth
80 60 40 20 0
80 60 40 20 0
8
16
32
64
128 256
8
16
fifo depth
c) stride 16
32
64
128 256
fifo depth
d) stride 256
Figure 26 swap Performance as a Percentage of System Bandwidth
38
Uniprocessor SMC Performance on Vectors with Non-Unit Strides
100
% system bandwidth
% system bandwidth
100 80 60 40 20 0
80 60 40 20 0
8
16
32
64
128 256
8
16
fifo depth
a) stride 2
64
128 256
b) stride 4 100
% system bandwidth
100
% system bandwidth
32
fifo depth
80 60 40 20 0
80 60 40 20 0
8
16
32
64
128 256
8
16
fifo depth
c) stride 16
32
64
128 256
fifo depth
d) stride 256
Figure 27 swap Performance as a Percentage of Attainable Bandwidth
39
Uniprocessor SMC Performance on Vectors with Non-Unit Strides
100
100
80
80
% bandwidth
% bandwidth
stride 1 stride 8 stride 64 stride 512 stride 8192
60 40 20 0
60 40 20 0
8
16
32
64
128 256
8
16
fifo depth
(a) one bank
64
128 256
(b) two banks
100
100
80
80
% bandwidth
% bandwidth
32
fifo depth
60 40 20 0
60 40 20 0
8
16
32
64
fifo depth
(c) four banks
128 256
8
16
32
64
128 256
fifo depth
(d) eight banks
Figure 28 swap Performance for Increasing Strides (A1)
40
Uniprocessor SMC Performance on Vectors with Non-Unit Strides
100
100
80
80
% bandwidth
% bandwidth
stride 1 stride 8 stride 64 stride 512 stride 8192
60 40 20 0
60 40 20 0
8
16
32
64
128 256
8
16
fifo depth
(a) one bank
64
128 256
(b) two banks
100
100
80
80
% bandwidth
% bandwidth
32
fifo depth
60 40 20 0
60 40 20 0
8
16
32
64
fifo depth
(c) four banks
128 256
8
16
32
64
128 256
fifo depth
(d) eight banks
Figure 29 swap Performance for Increasing Strides (T1)
41
50
80
40
% bandwidth
100
60 40
30 20 10
0
0 6 14 22 30 62 126 254 510 1022 2046 4094 8190
20
7 15 23 31 63 127 255 511 1023 2047 4095 8191
% bandwidth
Uniprocessor SMC Performance on Vectors with Non-Unit Strides
vector stride
(a) gcd(stride, banks) = 1
vector stride
(b) gcd(stride, banks) = 2
25 10
% bandwidth
% bandwidth
20 15 10
5
5
4 12 20 28 60 124 252 508 1020 2044 4092 8188
vector stride
(c) gcd(stride, banks) = 4
8 16 24 32 64 128 256 512 1024 2048 4096 8192
0
0
vector stride
(d) gcd(stride, banks) = 8
Figure 30 vaxpy Performance for an 8-Bank Memory System with 256-Deep FIFOs
42
Uniprocessor SMC Performance on Vectors with Non-Unit Strides
100
% system bandwidth
% system bandwidth
100 80 60 40 20 0
80 60 40 20 0
8
16
32
64
128 256
8
16
fifo depth
a) stride 2
64
128 256
b) stride 4 100
% system bandwidth
100
% system bandwidth
32
fifo depth
80 60 40 20 0
80 60 40 20 0
8
16
32
64
128 256
8
16
fifo depth
c) stride 16
32
64
128 256
fifo depth
d) stride 256
Figure 31 vaxpy Performance as a Percentage of System Bandwidth
43
100
100
80
80
% bandwidth
% bandwidth
Uniprocessor SMC Performance on Vectors with Non-Unit Strides
60 40 20 0
60 40 20 0
8
16
32
64
128 256
8
16
fifo depth
a) stride 2
64
128 256
b) stride 4
100
100
80
80
% bandwidth
% bandwidth
32
fifo depth
60 40 20 0
60 40 20 0
8
16
32
64
128 256
8
16
fifo depth
c) stride 16
32
64
128 256
fifo depth
d) stride 256
Figure 32 vaxpy Performance as a Percentage of Attainable Bandwidth
44
Uniprocessor SMC Performance on Vectors with Non-Unit Strides
100
100
80
80
% bandwidth
% bandwidth
stride 1 stride 8 stride 64 stride 512 stride 8192
60 40 20 0
60 40 20 0
8
16
32
64
128 256
8
16
fifo depth
(a) one bank
64
128 256
(b) two banks
100
100
80
80
% bandwidth
% bandwidth
32
fifo depth
60 40 20 0
60 40 20 0
8
16
32
64
fifo depth
(c) four banks
128 256
8
16
32
64
128 256
fifo depth
(d) eight banks
Figure 33 vaxpy Performance for Increasing Strides (A1)
45
Uniprocessor SMC Performance on Vectors with Non-Unit Strides
100
100
80
80
% bandwidth
% bandwidth
stride 1 stride 8 stride 64 stride 512 stride 8192
60 40 20 0
60 40 20 0
8
16
32
64
128 256
8
16
fifo depth
(a) one bank
64
128 256
(b) two banks
100
100
80
80
% bandwidth
% bandwidth
32
fifo depth
60 40 20 0
60 40 20 0
8
16
32
64
fifo depth
(c) four banks
128 256
8
16
32
64
128 256
fifo depth
(d) eight banks
Figure 34 vaxpy Performance for Increasing Strides (T1)
46
Uniprocessor SMC Performance on Vectors with Non-Unit Strides
References [Bud71]
Budnik, P., and Kuck, D., “The Organization and Use of Parallel Memories”, IEEE Trans. Comput., 20, 12, 1971.
[DEC92]
Alpha Architecture Handbook, Digital Equipment Corporation, 1992.
[Don79]
Dongarra, J.J., et. al., “Linpack User’s Guide“, SIAM, Philadelphia, 1979.
[Don90]
Dongarra, J.J., DuCroz, J., Duff, I., and Hammerling, S., “A set of Level 3 Basic Linear Algebra Subprograms”, ACM Trans. Math. Softw., 16:1-17, 1990.
[Gol93]
Golub, G., and Ortega, J.M., Scientific Computation: An Introduction with Parallel Computing, Academic Press, Inc., 1993.
[Har87]
Harper, D. T., Jump, J., “Vector Access Performance in Parallel Memories Using a Skewed Storage Scheme”, IEEE Trans. Comput., 36, 12, 1987.
[Har89]
Harper, D. T., “Address Transformation to Increase Memory Performance”, 1989 International Conference on Supercomputing.
[Hen90]
Hennessy, J., and Patterson, D., “Computer Architecture: A Quantitative Approach”, Morgan Kaufmann, San Mateo, CA, 1990.
[IEEE92]
“High-speed DRAMs”, Special Report, IEEE Spectrum, vol. 29, no. 10, October 1992.
[Int91]
i860 XP Microprocessor Data Book, Intel Corporation, 1991.
[Kat89]
Katz, R., and Hennessy, J., “High Performance Microprocessor Architectures”, University of California, Berkeley, Report No. UCB/CSD 89/529, August, 1989.
[Law79]
Lawson, et. al., “Basic Linear Algebra Subprograms for Fortran Usage”, ACM Trans. Math. Soft., 5, 3, 1979.
[McK93a]
McKee, S.A, “Hardware Support for Access Ordering: Performance of Some Design Options”, University of Virginia, Department of Computer Science, Technical Report CS-93-08, August 1993.
[McK93b]
McKee, S.A., Klenke, R.H., Schwab, A.J., Wulf, Wm.A., Moyer, S.A., Hitchcock, C., Aylor, J.H., “Experimental Implementation of Dynamic Access Ordering”, University of Virginia, TR CS-93-42, August 1993. In Proc. HICSS-27, Maui, HI, January 1994.
[McK93c]
McKee, S.A., Moyer, S.A., Wulf, Wm.A., Hitchcock, C., “Increasing Memory Bandwidth for Vector Computations”, University of Virginia, TR
47
Uniprocessor SMC Performance on Vectors with Non-Unit Strides
CS-93-34, August 1993. To appear in Proc. Conf. on Prog. Lang. and Sys. Arch., Zurich, Switzerland, March 1994. [McK93d]
McKee, S.A., “An Analytic Model of SMC Performance”, University of Virginia, TR CS-93-54, November, 1994.
[McM86]
McMahon, F.H., “The Livermore Fortran Kernels: A Computer Test of the Numerical Performance Range”, Lawrence Livermore National Laboratory, UCRL-53745, December 1986.
[Moy93]
Moyer, S.A., “Access Ordering and Effective Memory Bandwidth”, Ph.D. Dissertation, Department of Computer Science, University of Virginia, Technical Report CS-93-18, April 1993.
[Qui91]
Quinnell, R., “High-speed DRAMs”, EDN, May 23, 1991.
[Ram92]
“Architectural Overview”, Rambus Inc., Mountain View, CA, 1992.
[Rau91]
Rau, B. R., “Pseudo-Randomly Interleaved Memory”, 18th International Symposium on Computer Architecture, May 1991.
[Wal85]
Wallach, S., “The CONVEX C-1 64-bit Supercomputer”, Compcon Spring 85, February 1985.
48