best allocate system resources in order to balance between the three factors. ..... larger the ticket value a data item has, the higher the prob- ability it will be ...
UNIT: User-centric Transaction Management in Web-Database Systems∗ Huiming Qu
Alexandros Labrinidis
Daniel Moss´e
Department of Computer Science University of Pittsburgh Pittsburgh, PA 15260, USA {huiming, labrinid, mosse}@cs.pitt.edu
Abstract Web-database systems are nowadays an integral part of everybody’s life, with applications ranging from monitoring/trading stock portfolios, to personalized blog aggregation and news services, to personalized weather tracking services. For most of these services to be successful (and their users to be kept satisfied), two criteria need to be met: user requests must be answered in a timely fashion and using fresh data. This paper presents a framework to balance both requirements from the users’ perspective. Toward this, we propose a user satisfaction metric to measure the overall effectiveness of the Web-database system. We also provide a set of algorithms to dynamically optimize this metric, through query admission control and update frequency modulation. Finally, we present extensive experimental results which compare our proposed algorithms to the current state of the art and show that we outperform competitors under various workloads (generated based on real traces) and user requirements.
1
Introduction
Web-database systems have surely come a long way since the early days of e-commerce (mid 90s). Everyday we rely on such systems to perform a variety of tasks that were not possible a few years back. The wealth of information online has led to a myriad of data-intensive services and applications. Typical data-intensive applications include online banking, monitoring and trading of stock portfolios, aggregating blogs and news on specific topics, computer network monitoring (especially for intrusion detection), personalized weather forecasts, environmental monitoring (for example, USGS’ National Water Information System Web Site), and many more. ∗ Funded
in part by NSF ITR Medium Award (ANI 0325353).
In almost all of these applications, it is crucial that user requests are answered in a timely fashion, using the most recent data possible. Let us take the stock trading application as an example: assume that a Web server receives stock ticks (i.e., updates on stock prices) on a regular basis and that users are querying current stock prices (for example, a moving average of the stock price over the last half hour). Clearly, in such an environment, it is imperative to: (1) compute the results to a user’s query based on fresh data and (2) give the user results as fast as possible. Results computed on old data can lead to misleading values (while the market may have changed dramatically) and, also, results that are delivered late can also lead to missed opportunities and financial losses. It is no surprise that modern stock trading web sites offer guarantees (e.g., 2 seconds1 ) for when the user transactions will be executed. As we can see from the stock trading example, there are two types of requests competing for resources at the Web server: user query transactions and update transactions. Update transactions happen in the background, constantly refreshing the data in the database, whereas user query transactions are the main foreground operations and are used to compute the answers to users’ requests. As such, we associate response time (therefore, timeliness) with user query transactions and freshness with update transactions. Clearly, high timeliness is achieved by delivering quick responses, whereas high freshness is achieved by executing all updates in time. In order to measure timeliness, we assume that each user associates a deadline with his/her query transaction, and overall timeliness can be measured by computing the percentage of user queries that met their respective deadlines. Similarly, we assume that each user associates a freshness requirement with his/her query transaction, and overall freshness can be computed from the percentage of user queries that met their respective freshness requirements. 1 E*Trade,
www.etrade.com/2secondgurantee
Ideally, if we have enough computing resources to handle both user query transactions and update transactions in time, we could maintain the best timeliness and the highest data freshness. However, this is usually an unrealistic assumption as Web servers are often characterized by their unpredictable access patterns over data/time, which typically translates to periods of peak request load, usually because of flash crowds. Web-database servers must be prepared to deal with such bursty accesses and balance the trade-off between query timeliness and data freshness. In order to effectively utilize the resources of the Webdatabase server in times of peak load, we want to shed some of the load on the server. Since load on the server is due to both user query transactions and update transactions, shedding load can be done in two ways: by dropping some of the user query transactions or by reducing the amount of the update transactions2 . Although performing all updates will guarantee the highest level of freshness for any user query, dropping some of the updates does not necessarily lead to decreased freshness. Revisiting the earlier stock monitoring example, if a stock (e.g., PITT) receives updates every 10 seconds and is only accessed once (through a user query that involves PITT), we could easily ignore all updates until the last one before the access, without loss in data freshness from the user’s point of view. In general, we identify three types of degradation in the perceived satisfaction from the users: rejections, deadline misses, freshness misses. A rejection occurs when the Webdatabase server decides that accepting the user query will jeopardize the timeliness/freshness of the other transactions to a critical degree and as such chooses to reject the user query. A deadline miss occurs when a user query transaction, although accepted for execution, misses its target deadline. Finally, a freshness miss occurs when the user query ends up reading data that are stale to a degree beyond what is tolerable from the user. Ideally, we want to eliminate all aspects of user dissatisfaction (rejections, deadline misses, freshness misses). However, as we discussed earlier, in times of peak loads this will not be possible. The question then arises of how to best allocate system resources in order to balance between the three factors. The answer to this question depends on what users value the most. Toward this, we propose a unified User Satisfaction Metric, which considers all three factors, and also provides weights that indicate the relative importance of each factor to users. For example, users will most probably prefer to have their queries rejected immediately rather than have the queries accepted and then miss the deadlines. In this case, we will assign a higher penalty to deadline misses than rejections. 2 We assume periodic updates on the current value of a data item, that is, updates are not incremental. In such environments, skipping updates affects data freshness, but not correctness.
Given the User Satisfaction Metric (USM) definition, we propose a suite of algorithms to maximize USM when the system resources are not enough to guarantee a hundred percent of both freshness and timeliness. Specifically, we provide two algorithms: an admission control algorithm and an update frequency modulation algorithm. The admission control algorithm adjusts the user query workload by dropping those transactions which threaten the system USM. The update frequency modulation algorithm adjusts the update workload by intelligently reducing the frequency of updates to data that have minimal harm to the overall user-perceived freshness. When and which workload to adjust depends on the decisions made by a general feedback control loop. Contributions The main contributions of this work are: • We propose a unified User Satisfaction Metric (USM) for Web-database systems that incorporates multiple factors and can be tailored to the users’ needs and preferences. • We propose a feedback control system, UNIT to adaptively maximize USM. • We propose two algorithms that perform admission control and update frequency modulation to balance the query and update workload. We compare our proposed algorithms to two baseline algorithms and the current state of the art with an extensive simulation study using workloads generated from real traces. Road Map The paper is organized as follows. Section 2 presents the needed background and definitions. Section 3 presents the proposed UNIT framework. Experimental results are presented in Section 4. We briefly present related work in Section 5 and conclude in Section 6.
2 2.1
Background and Definitions User Queries and Update Transactions
There are two kinds of transactions in our system: user query transactions (or simply user queries) and update transactions (or simply updates). The set of all user queries is denoted as Q = {qi |i ≥ 0}. The set of all updates is denoted as U = {uj |j ≥ 0}. We assume that the database D = {di |1 ≤ i ≤ S} has multiple data items, where S is the number of data items. Each user query reads one or more data items, whereas each update transaction updates a single data item. A user query qi specifies the preferences of the user in terms of timeliness and freshness for the query, specifically, relative deadline qti and freshness requirement qfi . The relative deadline qti is the time distance from query arrival
to the latest time by which the qi has to be completed (i.e., it represents the time duration the query is allowed to run before being aborted). We assume that user queries have firm deadlines meaning transactions have no value if they miss their deadlines. The freshness requirement qfi is the freshness percentage that qi has to meet. We elaborate on freshness in Section 2.2. An update specification uj (or simply update) lists the data item to be updated and the period that updates for that data item arrive. For our stock market example, the web server periodically pulls updates or subscribes to update “feeds” being pushed from the source (e.g., NYSE, www.nyse.com). Specifically, each update uj specifies: (1) the data item udj it updates, and (2) the update period upj with which updates for udj arrive. Having defined user queries and updates in our system, we now identify the four possible outcomes for user queries: Rejection A query qi may fail because the system has rejected it outright (i.e., the query did not pass the admission control phase). We refer to this case as a rejection. Deadline-Missed Failure A user query qi will fail when it misses its deadline, that is, when qi fails to commit before qti . We refer to this case as Deadline-Missed Failure (DMF). Data-Stale Failure Even if query qi meets its deadline, it will fail if it misses its freshness requirement, that is, when its freshness is less than qfi . We refer to this case as Data-Stale Failure (DSF). Success If a user query does not fail (for any of the above three reasons), it is considered successful.
2.2
Measuring Freshness
In order to measure the freshness of the results returned to a user query, we measure the freshness of the data items that were accessed by the query. Therefore, the freshness for a user query qi , Qu(qi ), is a function of the freshness of all data items accessed by qi , or Qu(dj ), where dj ∈ Di and Di is the set of data items that are accessed by qi . To properly compute the overall freshness for the user query, Qu(qi ), we must answer two questions: (1) how to measure the freshness for each data item, and (2) how to aggregate the freshness over all data items that are accessed by qi . To answer the second question, we take a strict approach, where we select the minimum freshness over all the individual freshness values from the accessed data items. This provides a strong guarantee that all items that were accessed in order to compute the query result have at least as much freshness. Formally, Qu(qi ) = min(Qu(dj )), ∀dj ∈ Di . There are multiple ways to answer the first question, that is, how to measure the freshness for each data item. We characterize the various methods into three distinct classes:
time-based, lag-based, and divergence-based [14]. Since we only have periodic updates, a lag-based scheme is most suitable because it uses the number of un-applied updates to quantify how stale a data item is. Combined with the way we aggregate the freshness over all data items accessed by qi , the freshness for qi can be expressed as follows: � � 1 Qu(qi ) = min (1) dj ∈Di 1 + U dropj where U dropj is the number of updates on data item dj that were dropped since the last successful update, and Di is the set of data items which query qi accesses. Under this definition, the lowest possible freshness value for query qi , Qu(qi ), is near 0, whereas the maximum value is 1 for the case that there are no pending updates for query qi .
2.3
User Satisfaction Metric
From the perspective of the user, the more queries meeting their deadline and freshness requirements, the better it is. Therefore, one could use the success ratio (i.e., the ratio of user queries that meet their deadline and freshness requirements over all user queries) as a good metric of overall system performance. However, using success ratio alone is not enough if the user has a preference over which requirement is more important to him/her, or in other words, which failure is more serious. For instance, one user may tolerate slightly stale results, but wants to be able to see the results very quickly, whereas another user may be willing to tolerate delays in order to get fresher results. By using the success ratio alone, we are not able to distinguish among the different types of failures: rejections, deadline-missed failures, and data-stale failures. To ameliorate this problem, we propose a dual metric that: • assigns a gain for user queries that were accepted by the system, finished before their deadline, and were computed using fresh data (based on the user’s preferences), and • assigns a penalty for user queries that fail; the penalty is differentiated based on the type of failure, according to users’ preferences. In this way, the overall performance metric includes not only how successful the user queries are, but also how serious it is when user queries fail. 2.3.1
USM Definition
We define the total User Satisfaction Metric of the system (over Q, the set of all queries submitted by the users) as the sum of the User Satisfaction of each user query, US(qi ): X USMtotal = (US(qi )) (2) qi ∈Q
As mentioned earlier, the User Satisfaction Metric (USM) should include both success gain and failure penalty, and also enable users to indicate their preference by assigning different cost weights. For each user query, qi , US(qi ) could have four values because there are four possible outcomes for a query (success, rejection, deadline-missed failure, data-stale failure). If qi gets rejected by the system, US(qi ) should be assigned a rejection penalty value of Cr . If qi gets admitted, but fails to meet its deadline, US(qi ) should be assigned a DMF penalty value of Cf m . If qi completes within its deadline, but the accessed data items do not meet the freshness requirement, US(qi ) should be assigned a DSF penalty value of Cf s . If qi is admitted and successfully meets its deadline and freshness requirements, US(qi ) will be assigned a success gain, Gs . In this paper, Gs is 1 and the penalties (Cr , Cf m , Cf s ) are normalized to Gs . The user satisfaction of qi is defined as follows: i Gs −C i r US(qi ) = i −C fm −Cfi s
if qi if qi if qi if qi
meets both qti and qfi is rejected fails to meet qti fails to meet qfi
(3)
If we have Ns user queries that succeed, Nr that get rejected, Nf m that exhibit a deadline-missed failure, and Nf s that exhibit a data-stale failure, then by combining Equations 2 and 3 we have that: USMtotal =
Ns X
Gks −
k=1
Nr X k=1
Nf m
Crk −
X
Cfkm −
k=1
Nf s X
Cfks (4)
k=1
Now we have the four parts representing the gain and penalty according to the four outcomes of the transactions. If we divide the total USM by the total number of submitted user queries, we have the following average USM USM = S − R − Fm − Fs
(5)
which is the average success gain (S), deducted by average rejection cost (R), the average DMF cost (Fm ), and the average DSF cost (Fs ). 2.3.2
USM Range
Higher values for the USM as defined in Equation 5, correspond to higher levels of user satisfaction. The maximum attainable value for USM is 1, for the case that all user queries are successful. The lowest possible USM value is -max (Cr , Cf m , Cf s ). In other words, the worst case scenario is when all the user queries fail and the type of failure matches what the users consider to be the most annoying (and have thus assigned to it the highest penalty).
3
The UNIT Framework
Given the system USM as defined in the previous section, our goal is to maximize it by employing an adaptive load control scheme. The idea is inspired by Kang’s work [12] in which they use a feed back control loop to monitor the freshness and deadline miss ratio. We provide detailed comparison of our work to Kang’s in Section 4.1 and 5.
3.1
System Overview
In this paper, we assume users have similar preferences (penalty parameters). We believe that our framework can be easily extended to support multiple preferences. Figure 1 shows the overview of the feedback control system. System inputs are penalty parameters Cr , Cf m , and Cf s . There are two interrelated parts in this system: • Data flow: corresponds to how queries and updates propagate through the system; • Control flow: corresponds to how the control process interacts with the data flow. Data flow User queries and updates are submitted into the system and put into the ready queue if admitted. The dispatching discipline adopted in our system is a dualpriority queue: updates have higher priorities than queries, whereas within each group, EDF (Earliest Deadline First) is applied. When a transaction completes successfully (i.e., within deadline and freshness constraints), the query result becomes available in the success queue. Concurrency control is addressed by Two-Phase Locking - High Priority (2PL-HP) [2]. Control flow The Load Balancing Controller (LBC) is responsible for regulating control flow. Specifically, it can tighten/loosen admission control by sending signals to the Query Admission Control module to allow less/more user queries into the system. LBC can also increase/decrease the update frequency of updates by sending signals to the Update Frequency Modulation module to carry out more/less updates. The control flow is triggered periodically or when the USM drops more than a certain threshold. The LBC also monitors queries for further load shedding. Since we assume firm deadlines, if a query deadline is missed while the query is in the ready queue or during its execution, the query has to be aborted. Similarly, query results with stale data items (DSF) can be discarded or returned to the user with a special notice.
3.2
Load Balancing Controller (LBC)
The Load Balancing Controller monitors the system statistics and initiates the Adaptive Allocation periodically
Adaptive Allocation Algorithm 0. [Inputs: Rr Rf m , Rf s ] [Output: control signals] 1. if ∆USM > USMt or ∆time >= Grace Period 2. if (Cr , Cf m , Cf s all equal 0) 3. R = R r ; Fm = R f m ; Fs = R f s 4. switch ( max(R, Fm , Fs ) ) / / break ties randomly 5. case R: / / rejection cost is highest 6. Loosen Admission Control [Section 3.3] 7. case Fm : / / DMF cost is highest 8. Degrade Update [Section 3.4.1] 9. Tighten Admission Control [Section 3.3] 10. case Fs : / / DSF cost is highest 11. Upgrade Update [Section 3.4.2] Figure 2. Adaptive Allocation Algorithm
Figure 1. UNIT Feedback Control System or when there is a big drop of USM, that is, when ∆USM is greater than a specified threshold; the threshold is usually 1% of the range of USM. The policy executed by the LBC to decide on what to do (admit more/less user queries or improve/deteriorate the freshness through updates) is described in Adaptive Allocation Algorithm (see Figure 2). The algorithm takes as input the rejection ratio Rr , the DMF ratio Rf m and the DSF ratio Rf s , and triggers a new control signal as the result. The main idea is to reduce the dominant penalty cost at the time a drop in the USM is detected. If Cr , Cf m , and Cf s are all 0, the system will focus only on reducing the failure with highest ratio to maintain a high success gain.
3.3
Query Admission Control (AC)
Query admission control filters out the user queries that have little chance to succeed by transaction deadline check, and those transactions that can significantly hurt the system performance by system USM check. Transaction deadline check We assume the average execution time for each transaction can be determined by the existing monitoring techniques that most database systems are performing for query optimization. These average execution times are used to check how promising a transaction is to finish on time (before it is accepted). More specifically, for each transaction, the system keeps the Earliest-possible Start Time (EST). The system will check if ESTi + qei < qti before accepting the user query qi , where qei is the average execution time of qi and qti is its relative deadline. Moreover, we also bring in a lag ratio Cflex to allow some flexibility to the scheduling; in other words, we check if
Cflex · ESTi + qei < qti . All the transactions pass this test are called promising transactions. System USM check Usually, not all the promising transactions are admitted, since they may overload the system. The system USM check considers the global impact of admitting a query, since the new query may delay the existing transactions, which may lead to DMFs. We compute the consequence to the USM cost, by counting the total DMF cost of the endangered transactions (i.e. the transactions that might miss their deadlines due to the new incoming transaction). If the DMF of endangered transactions is higher than the cost of rejecting the new transaction, the system rejects the incoming transaction. The complexity of the admission control algorithm (transaction deadline check and system USM check) is O(Nrq ) for each transaction, where Nrq is the length of the ready queue. Tighten/Loosen Admission Control The LBC will send TAC/LAC (Tighten/Loosen Admission Control) signals to adjust Cflex when needed. Notice that the larger the Cflex is, the tighter the Admission Control is. The initial value of Cflex is set to 1 and a TAC/LAC signal is to increase/decrease Cflex by 10%.
3.4
Update Frequency Modulation (UM)
We use Update Frequency Modulation (UM) to control the number of updates that are processed in the system by increasing or decreasing the frequency of updates. The reduction of updates is carried out on those data that have relatively little effect on query quality, upon receiving the Upgrade Update control signal from LBC. Conversely, we increase the frequency of all degraded updates to help with the freshness, upon receiving the Degrade Update control signal from LBC.
3.4.1
Degrading Updates
which the ticket value will increase for each update accessing dj is defined as follows:
Next, we answer the following two questions: (1) Which update to degrade? (2) How aggressively to degrade the updates? Which update to degrade? Intuitively, we want to degrade the updates for the data item that the system spends too much time updating, yet only few queries need to access. The probability a data item is chosen depends on its access pattern and update frequency. We use Lottery Scheduling [21] to choose which data item to degrade, that is, whose update to make less frequent. Each data item is associated with a certain ticket value. The larger the ticket value a data item has, the higher the probability it will be chosen as the victim, and its update frequency will be decreased. The ticket value is decided as follows. • Query effect on ticket values: The ticket value of dj is decreased every time there is a query access to dj . The amount of decrease depends on the cpu utilization of the access query. Intuitively, we do not want to degrade those data items which are needed by the queries with high cpu utilization, because if the query’s freshness requirement is not met, there will be less slack time for an additional update transaction to be issued to retrieve the fresh data item. Since the larger the ticket value is, the more chance it has to be degraded, for each query, the amount of decrease should be proportional to the cpu utilization. Formally, the amount by which the value will decrease for each query qi accessing dj is defined as: DTj =
qei qti
(6)
where qei is the average execution time of qi and qti is its relative deadline. • Update effect on ticket values: The system increases the ticket value of dj whenever there is an update on dj . The longer the execution time of the update, the larger the amount of increase on the ticket value. The idea is that we want to degrade those data items that have been updated relatively too often, and given two data items having the same number of updates, we want to obtain as much cpu time saving as possible by degrading the data item with longer update execution time. Among many choices to relate the ticket value to execution time, we use the sigmoid function. Using the information of average execution time among all the updates, the sigmod function smoothly converts the execution time to the (0, 1) range, and it nicely takes care of the effect of outliers. Formally, the amount by
ITj =
1 1 + eueavg −uej
(7)
where ueavg is the average update execution time of all updates in the system, and uej is the average execution time of update uj . Note that the increase of the ticket value is the sigmoid function of the difference between execution time and average execution time. • Forgetting: In order to concentrate on current system status, we apply a forgetting factor Cforget to the computation of ticket values [10]. With Cforget = 1, all historical accesses and updates are effective to the ticket values. The smaller Cforget is, the faster it forgets. We set Cforget = 0.9 in this paper, following the current practice in the literature. • Overall ticket value computation: The overall ticket value for data item dj is computed as described below. ( Tj · Cforget − DTj from query qi Tj = (8) Tj · Cforget + ITj from update uj In order to have non-negative ticket values for the Lottery Scheduling, we subtract the smallest ticket value, Tmin , from all ticket values (i.e., ∀j, Tj = Tj − Tmin ). Then, we use Lottery Scheduling [21] that randomly picks a data item with probability proportional to the ticket value of the data item. The complexity of applying the Lottery Scheduling is O(logNd ) [21], where Nd is the total number of data items. How to degrade the update? Once dj is chosen to be degraded, its current update period pcj is increased with a certain percentage as specified in the following: pcj = pcj · (1 + Cdu )
(9)
In our experiments, Cdu = 0.1; sensitivity analysis in [17] has shown that the exact value of Cdu does not have a significant effect to the average USM. 3.4.2
Upgrading Updates
Upgrading updates needs to be done when degrading updates affects the query freshness and the average DSF cost Fs becomes the leading cost in the USM. The periods of all degraded updates should be decreased gradually as in Equation 10, until they reach the ideal period pij . pcj = min(pij , pcj − Cuu · pij )
(10)
where Cuu = 0.5, in our experiments, to essentially cut the update period by half and quickly converge to the original update period.
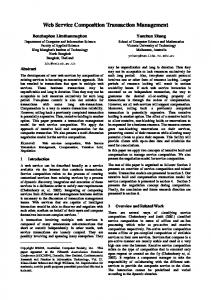
(a) Query distribution over data
(b) Update distribution over data (med-unif trace)
(c) Update distribution over data (med-neg trace)
Figure 3. Distribution of Accesses and Updates (Original vs. Unit Degraded) Over Data
4
Experimental Evaluation Total Num.
We evaluated UNIT by comparing it to different algorithms under various performance metrics and workloads (generated from real traces). Section 4.1 explains the experimental setup as well as the baseline algorithms. Section 4.2 compares UNIT to other algorithms and different workloads by evaluating UNIT’s Update Frequency Modulation. Section 4.3 quantifies the performance gain of UNIT to other algorithms. Section 4.4 evaluates how sensitive the algorithms are to the different weight settings. Finally, Section 4.5 provides further insight into the influence of cost factors over the different algorithms.
4.1
Experimental Setup
User Query Trace We generated user queries based on the HP disk cello99a access trace, which lasts for 3,848,104 seconds and includes 110,035 reads. Each recorded entry in cello99a has its arrival time, response time, and location on the disk. We take the arrival time and response time of reads from the original trace and map their accessed logical block number (lbn) into our data set. The disk location was partitioned into 1024 consecutive regions, where each region represents a data item in our simulation. The deadline for each query was generated randomly and ranged from the average response time to 10 times of the maximal response time. We set freshness requirement for all user queries at 90%. Through the above process, we generate the user queries with each of them containing the arrival time, accessed data, response time (estimated execution time), deadline and freshness requirements. Update Trace Update workloads are classified into low, medium, and high workloads with 6144, 30000, and 61440 total updates, respectively, representing a 15%, 75%, and 150% cpu utilization. In general, we need to specify the spatial distribution (what data item to be accessed or updated) and temporal distribution (at what time it happens) of updates. However, we only have periodic updates, so the
Updates Distribution
Traces
6144 (or 15% workload)
uniform positive correlation negative correlation
low − unif low − pos low − neg
30000 (or 75% workload)
uniform positive correlation negative correlation
med − unif med − pos med − neg
61440 (or 150% workload)
uniform positive correlation negative correlation
high − unif high − pos high − neg
Table 1. Update Traces temporal distribution is fixed. For the spatial distribution we tried uniform, positive correlation and negative correlation (to the query distribution with a coefficient of 0.8) on each update workload. The update traces are listed in Table 1. We generated estimated execution time for updates randomly in the range of the response time of writes in cello99a. Each entry contains an estimated execution time and an update period for a particular data item. Baseline Algorithms We compared our scheme, UNIT, to two baseline algorithms (IMU and ODU) and the current state-of-the-art (QMF [12]). • IMU (Immediate Update): All the updates are executed immediately; No admission control on queries. IMU achieves 100% freshness, but may suffer from low query success ratio for the high update load. • ODU (On-demand Update): updates are executed only when a query finds that a needed data item is stale; No admission control on queries. ODU also achieves 100% freshness, but the additional update issued may also delay the query and lead to missed deadlines. • QMF: [12] uses a feedback control loop to adjust admission control and adaptive update policy. With the CPU underutilized, QMF tries to update more often if
(a) Uniform
(b) Positive correlation
(c) Negative Correlation
Figure 4. Performance Comparison when USM = Success Ratio the target freshness is not met, otherwise admits more transactions. With the CPU overloaded, QMF updates less often if current freshness is higher than target freshness, otherwise drops incoming transactions until the system recovers. The adaptive update policy controls how many updates to be dropped, and whose updates to be dropped (based on the ratio of number of accesses over number of updates on each data).
4.2
data in Figure 3(c), originally the number of updates is very small, i.e., a relative small number of updates is enough to guarantee the freshness of the data. We make the following observations: (1) It is not true that hot accessed data should always get more updates than other data. When the data are inherently stable, a small number of updates is enough. (2) Updates on cold accessed and hot updated data will be dropped more often than those on hot accessed and cold updated data.
Update Frequency Modulation Evaluation 4.3 Naive USM: Quantitative Evaluation
First, we want to verify if our Update Frequency Modulation can intelligently choose to drop updates that contribute little to the user query freshness. We show both the query access distribution over data and the update distribution over data. The results are from user query trace with update trances med-unif and med-neg. Please refer to [17] for experiments on more update traces. Case Study 1: med-unif Updates Figure 3(a) shows the number of queries per data item, illustrating a skewed distribution of requests over data items. Whereas the original update requests are distributed uniformly over all the data as indicated by the grey area in Figure 3(b). Intuitively, the system should cut down the updates on the less frequently queried items when necessary, which is exactly what UNIT does (see black lines in Figure 3(b)). By comparing black lines in Figure 3(a) and Figure 3(b), we can see that UNIT can adaptively follow the query distribution to select the important data items to update. Case Study 2: med-neg Updates The grey area in Figure 3(c) (i.e., the update volume) shows that the number of updates over data is negatively correlated to the query distribution in Figure 3(a). This update trace has two prominent groups: hot updated and cold updated data. As shown in Figure 3(c) with the tiny black dots close to x-axis, more than 95% of the updates are dropped and the updates dropped concentrate on hot updated data which is also the data with less frequent accesses (smaller IDs). What we can also roughly see from the black dots in Figure 3(c) is that the hot accessed data has about the same number of updates than cold accessed data, instead of the big difference in Figure 3(b). The reason is that for the hot accessed
We now quantitatively compare UNIT to other algorithms. In order to be fair, we set all the weights Cr , Cf m , Cf s to 0, which means USM equals to the traditional success ratio in this naive setting. Figure 4 shows the naive USM over 3 different update distributions (unif/pos/neg) and three different update volumes (low/med/high). We can clearly see that UNIT has much higher USM (success ratio) over all of the different settings in Figure 4. Specifically, UNIT outperforms other algorithms ranging from 0.172 to 0.386 improvement in Figure 4(a), from 0.129 to 0.282 improvement in Figure 4(b), and 0.056 to 0.588 improvement in Figure 4(c) in absolute values for USM. These differences translate to a 30%, 50% and 10% minimum relative improvement over the competitor algorithms and multiple orders of magnitude improvement in the best case (since some of the other algorithms produce near zero USM). It is interesting to note that in Figure 4(a), QMF performs even worse than the simple on-demand update scheme (ODU), because QMF is trying to reduce the Miss Ratio (number of deadline misses over number of admitted queries), which makes QMF reject more aggressively to secure the admitted transactions. As a result, QMF has fewer successful transactions than ODU. In Figure 4(b), immediate updates (IMU) performs almost identical to ODU, because the query and update distributions are positively correlated. In Figure 4(c), ODU performs close to UNIT, because most of updates are “irrelevant” under the negative correlation. ODU by itself tries to minimize updates.
(a) Penalties < 1
(b) Penalties > 1
Figure 6. Ratio Distribution
Figure 5. Non-zero Penalty Cost
4.4
Normal USM: Sensitivity Evaluation
With UNIT, it is possible to assign different penalties for different type of failures (i.e., assign different values for Cr , Cf m , Cf s ). In this set of experiments, we evaluate how sensitive UNIT is to the different cost functions. The main result is that UNIT is fairly stable in terms of USM, even when the cost functions change dramatically. Figure 5(a) and 5(b) show the performance (measured as USM) of different methods (under the query trace and update trace med unif ) with penalties less than 1 and greater than 1, respectively. The 3 values along the x-axis (high Cr , high Cf m , high Cf s ) refer to the cases where the corresponding cost factor is higher than the other two costs. The exact weights are shown in Table 2. Figure 5 clearly shows that UNIT performs best in both cases: penalties < 1 and penalties > 1. Some interesting observations are: (1) QMF performs worse with high Cr , because it rejects many queries to favor the miss ratio; (2) IMU and ODU are worse with high Cf m , because they fail to finish many queries on time.
4.5
Insight into behavior of UNIT
After showing the performance gain of UNIT over a variety of settings, we now elaborate on why UNIT gives a better and more stable USM than the other methods. User queries could have four “fortunes”: Success, Rejection, DMF, and DSF. We can collect how many transactions fall into each group by having the number of SucPenalties < 1 high Cr high Cf m high Cf s Penalties > 1 high Cr high Cf m high Cf s
Cs 1 1 1
Cr 0.5 0.1 0.1
Cf m 0.1 0.5 0.1
Cf s 0.1 0.1 0.5
1 1 1
5 1 1
1 5 1
1 1 5
Table 2. USM weights for Figure 5
cess/Rejection/DMF/DSF divided by the total number of queries, denoted as Success/Rejection/DMF/DSF ratio (i.e., Rs /Rr /Rf m /Rf s ). By visualizing the ratio decompositions of the outcome of queries, we can have an insight about the results in the previous sections. Figure 6(a) plots the four ratios for IMU, ODU, and QMF which are insensitive to weight variations, and Figure 6(b) plots the four ratios for UNIT under the same setup of Figure 5(a). We observe the following: (1) Regardless of the penalty settings, UNIT gives a much higher success ratio than the others. (2) The ratio distribution of UNIT changes a lot with different cost setups. With the rejection cost smallest with high Cr setup and DMF cost smallest in the high Cfm setup, it can be explained why the USM for UNIT remains stable along different cost setups: UNIT effectively minimizes the portion that dominates the cost. (3) IMU, ODU and QMF are not affected by the cost parameters and hold the same success ratio. Comparing the three algorithms, we find QMF’s rejection ratio very high. The reason is that when there is a burst of requests, QMF is being conservative and drops many queries to guarantee the admitted transactions to be successfully executed. Although within those admitted transactions, the miss ratio is minimized, the overall success ratio is low too.
5
Related Work
We view our work as being at the intersection of webdatabases, real-time database systems, and stream data management. Web-Databases There is a plethora of papers that focus on improving the performance of user requests to databasedriven web sites, using caching [11, 5, 7, 15] or materialization [13]. These approaches usually provide a best-effort solution in terms of data freshness. In recent work [14], we introduced a framework to balance the trade-off between performance and freshness in web servers, by choosing data items to materialize in the presence of continuous, asynchronous updates. In [19], we emphasized on continuous queries over the dynamic Web and proposed a scheduling policy to improve QoD (freshness) instead of the traditional
performance criteria. However, we did not address userspecified deadlines or perform admission control in order to provide any quality guarantees. Real Time Database Systems There exists a significant amount of research in Real-Time Database Systems that deals with the scheduling of real-time transactions in the presence of deadlines [9, 18]. QMF [12] deals with freshness in addition to deadlines and is the closest to our work in this paper (UNIT). UNIT improves on QMF in that it is user-centric (it optimizes USM, while QMF targets freshness and miss ratio), and it uses Lottery Scheduling for efficiency and fairness. Update frequency modulation has also been addressed in [4], which treated periodic tasks as springs, so the period (and also the workload) can be adjusted by changing the elastic coefficients. This approach is a general overload management technique, while our proposed UNIT scheme is maximizing the user satisfaction metric (USM). Another approach to adjust the update workload has been proposed in [22] through a deferrable schedule for update transactions that minimizes update workload while maintaining freshness (temporal validity) of real-time data. Stream Processing In order to deal with the neverending flood of data and the burstiness of data streams [16, 1], multiple load shedding techniques have been proposed. For example, [3, 6, 8] focus on the accuracy of the query answers, whereas [20] provides a mechanism to optimize on different QoS requirements (including latency, value-based, and loss-tolerance). However, in this paper, we focus on adhoc queries that operate on data being updated periodically, instead of continuous queries. Also, our emphasis is on coordinating query admission control with update frequency modulation, in order to prevent overload (instead of simply reacting to it, as load shedding does).
6
Conclusions
Web-based database systems of today manage timesensitive data and must comply with several requirements such as freshness and deadlines. In this paper, we proposed to combine such requirements into a novel User Satisfaction Metric (USM), and introduced UNIT. UNIT uses a feedback control mechanism and relies on an intelligent admission control algorithm along with a new update frequency modulation scheme in order to maximize USM. Our evaluation showed that UNIT performs better than two baseline algorithms and the current state-of-the-art when tested using workloads generated from real traces. Acknowledgements The authors would like to thank Dr. K. D. Kang for gratiously providing the code for his QMF algorithm, to Jimeng Sun for his help with earlier versions of this paper, and to Mengzhi Wang for providing the cello99a traces.
References [1] D. J. Abadi, D. Carney, U. Cetintemel, M. Cherniack, C. Convey, S. Lee, M. Stonebraker, N. Tatbul, and S. Zdonik. Aurora: a new model and architecture for data stream management. The VLDB Journal, 12(2):120–139, 2003. [2] R. K. Abbott and H. Garcia-Molina. Scheduling real-time transactions: a performance evaluation. In VLDB, 1988. [3] B. Babcock, M. Datar, and R. Motwani. Load shedding for aggregation queries over data streams. In ICDE ’04. [4] G. C. Buttazzo, G. Lipari, M. Caccamo, and L. Abeni. Elastic scheduling for flexible workload management. IEEE Trans. Comput., 51(3):289–302, 2002. [5] J. Challenger, A. Iyengar, K. Witting, C. Ferstat, and P. Reed. A Publishing System for Efficiently Creating Dynamic Web Content. In INFOCOM ’00. [6] A. Das, J. Gehrke, and M. Riedewald. Approximate join processing over data streams. In SIGMOD, 2003. [7] A. Datta et al. Proxy-Based Acceleration of Dynamically Generated Content on the World Wide Web: An Approach and Implementation. In SIGMOD ’02. [8] L. Ding and E. A. Rundensteiner. Evaluating window joins over punctuated streams. In CIKM ’04. [9] J. R. Haritsa, M. Livny, and M. J. Carey. Earliest deadline scheduling for real-time database systems. In RTSS, 1991. [10] S. Haykin. Adaptive Filter Theory. Prentice Hall, 1992. [11] A. Iyengar and J. Challenger. Improving Web Server Performance by Caching Dynamic Data. [12] K.-D. Kang, S. H. Son, and J. A. Stankovic. Managing deadline miss ratio and sensor data freshness in real-time databases. TKDE, 16(10):1200–1216, 2004. [13] A. Labrinidis and N. Roussopoulos. WebView Materialization. In SIGMOD ’00. [14] A. Labrinidis and N. Roussopoulos. Exploring the tradeoff between performance and data freshness in database-driven web servers. The VLDB Journal, 13(3):240–255, 2004. [15] Q. Luo, S. Krishnamurthy, C. Mohan, H. Pirahesh, H. Woo, B. G. Lindsay, and J. F. Naughton. Middle-tier Database Caching for e-Business. In SIGMOD ’02. [16] R. Motwani, J. Widom, A. Arasu, B. Babcock, S. Babu, M. Datar, G. Manku, C. Olston, J. Rosenstein, and R. Varma. Query processing, resource management, and approximation in a data stream management system. In CIDR, 2003. [17] H. Qu, A. Labrinidis, and D. Moss´e. Transaction management in web-database systems. Technical Report PITT/CSD/TR-05-126, November 2005. [18] K. Ramamritham. Real-time databases. Distributed and Parallel Databases, 1(2):199–226, 1993. [19] M. A. Sharaf, A. Labrinidis, P. K. Chrysanthis, and K. Pruhs. Freshness-aware scheduling of continuous queries in the dynamic web. In WebDB, 2005. [20] N. Tatbul, U. Cetintemel, S. B. Zdonik, M. Cherniack, and M. Stonebraker. Load shedding in a data stream manager. In VLDB, 2003. [21] C. A. Waldspurger. Lottery and stride scheduling: Flexible proportional-share resource management. Technical Report MIT/LCS/TR-667, 1995. [22] M. Xiong, S. Han, and K.-Y. Lam. A deferrable scheduling algorithm for real-time transactions maintaining data freshness. In RTSS ’05.