© 1999 by the regents of the university of California
Music Perception Spring 1999, Vol. 16, No. 3, 295-326
TestingModels of Melodic Contour Similarity MARK A. SCHMUCKLER Universityof Torontoat Scarborough In two experiments,descriptionsof melodiccontourstructureand predictionsof perceivedsimilarityrelationsbetweenpairsof contoursproducedby a numberof differentmodelsareexamined.Two of thesemodels, basedon the music-theoreticapproachesof Friedmann(1985) and Marvinand Laprade(1987), characterizecontoursin termsof interval contentor contoursubsetinformation.The remainingtwo approaches quantifythe globalshapeof the contours,throughthe presenceof cyclical information(assessedvia Fourieranalysis)andthe amountof oscillation (e.g., reversalsin direction,pitchdeviations)in the contours.Theoreticalpredictionsfor contoursimilaritygeneratedby thesemodelswere examinedfor 20th century,nontonalmelodies(Experiment1) and simplistic,tonal patterns(Experiment2). Theseexperimentsdemonstrated that similaritybasedon Fourieranalysisproceduresand oscillationmeasurespredicteda derivedmeasureof perceivedsimilarity,with both variables contributingrelativelyindependently;the music-theoreticmodels were inconsistentin their predictivepower.These resultssuggestthat listenersare sensitiveto the presenceof globalshapeinformationin melodic contour,with such informationunderlyingthe perceptionof contour structureand contoursimilarity.
contour (the patternof rising and falling intervalswithin a melody)has long been recognizedas a fundamentalcomponentof musicalperception.Contourhas traditionallybeen a concern in psychological (e.g., Deutsch, 1969; Dowling, 1978) and music-theoretic(e.g., Marvin, 1991, 1995; Morris, 1987, 1993; Narmour,1990; Schoenberg, 1967; Toch, 1948/1977) analysesof musicalstructureand has givenriseto extensivebodiesof researchon melodyidentification(e.g., Deutsch, 1972; Dowling, 1984; Dowling & Hollombe, 1977; Idson & Massaro, 1978; Massaro, Kallman,&cKelly, 1980), memory for musical passages (e.g., Bartlett&cDowling, 1980; Croonen,1994, 1995; Croonen& Kop, 1989; DeWitt& Crowder,1986;Dowling, 1978, 1982, 1991; Dowling& Bartlett, 1981; Dowling & Fujitani,1971; Dowling & Harwood, 1986), and so on. Divisionof LifeSciences,Universityof to MarkA. Schmuckler, Addresscorrespondence Torontoat Scarborough,1265 MilitaryTrail,Scarborough,Ontario,CanadaMIC 1A4. (e-mail:
[email protected]) 295
296
MarkA. Schmuckler
Given that contour is so crucial to melodic processing,a quantitative theoryof contourstructurewould prove an invaluabletool, aidingin music-theoreticanalysesand in determininghow listenersperceive,organize, respondto, and remembermusicalpassages.For example,one significant consequenceof such a theory would be its potential use in determining similarityrelationsbetween musicalpassages.Such an innovationwould have importantimplicationsfor music-theoreticand psychologicalinvestigations of musical structure,providingpredictionsfor theoreticalstructuralsimilarityas well as psychologicaljudgmentsof perceptualsimilarity. Althoughnumerouspsychologistsand music theoristshave evincedan interestin contour, only a few formal descriptionsof contour structure have been proposed. One approachto studyingcontour has been to categorizemelodiesaccordingto featureinformation(Adams,1976; Kolinski, 1965; Seeger,1960;Polansky& Bassein,1992). Forexample,Adams(1976) describesa "melodiccontourtypology"in which contoursaredefinedby a set of boundaryproperties(the initial, final, highest, and lowest pitches within the contour),with threepossiblerelationsexistingbetweenboundary pitches (greaterthan, equal to, and less than). Combinationsof these boundariesand relations are then used to identify primarycontour featuressuchas overallmelodicslope, and secondarycontourfeaturessuchas repetitionsof the highestor lowest pitch (seeAdams,1976). Althoughsuch systemsprovidea thoroughtypologicaldescriptionof a contour,they fall shortas modelsof contourbecausethey ultimatelyresultin a simplelist of melodicfeatures.Whereassuch a list may help in characterizinggroupsof melodies(e.g., how many songs within a corpuscontainfeatureX), it is of limitedutilityin judgingcontourrelatedness. In a similarvein, Morris (1993) describesa model of contour relations in which a givencontouris transformedthroughthe reiterativeapplication of a reducingalgorithminto its fundamentalor primeform.This algorithm repeatedlydeletes notes from the contour, ultimatelyfocusing in on the initial,final, maximum,and minimumpoints of the contour.Accordingto Morris, these primes "play a role analogous to that of the Schenkerian background"(p. 218) and thus function as the underlyingcontour of the phrase in question. Similarityrelationsbetween prime forms of different contourscan then be determinedand used to highlightstructuralequivalence relationsbetweendifferentcontours.Althoughthis approachmoves beyondthe moregenerictaxonomiccategoryschemesof otherapproaches (e.g., Adams, 1976; Kolinski, 1965; Seeger,1960), its notion of contour similarityis restrictedin that it ultimatelylooks only for contour equivalence, with differentcontoursdesignatedas being from eitherthe same or differentcontour class. Unfortunately,this scheme does not contain any explicit or implicitmeans for quantifyingvaryingdegreesof similarity,an intuitivelyimportantpsychologicalaspect of contour.Moreover,because
TestingModelsof MelodicContourSimilarity
297
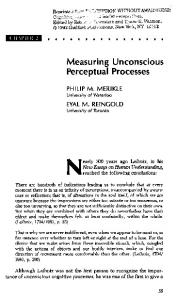
of its reductivenature,this algorithmsacrificesinformationat the musical surfacein delineatingthe underlyingform of the contour at its highest(or deepest)hierarchicallevel. It is unknownwhetherequivalenceon such an abstractbasisfactorsinto listeners'on-lineprocessingof musicalpassages. Accordingly,this approachmay have limited utility in definingperceived similarityrelationsof melodiccontours. A final set of theorieshave definedmore explicit, continuousmeasures of similarityamongmelodiccontours(Friedmann,1985, 1987; Marvin&c Laprade,1987). Thesemodelshaveproposeda set of proceduresfor quantifyingthe contour of short melodicpassages,with specificapplicationto 20th centurymusic. Friedmann(1985, 1987) suggeststwo such analytic tools: the contouradjacencyseries(CAS)and contourclass (CC).The CAS codesthe relativepatternof directionalchanges(e.g., ascendingor descending), althoughit ignoresthe (actualor relative)distancebetweenadjacent notes of a melody,and resultsin a sequenceof +'s and -'s representingthe patternof rises and falls within the contour.This seriesis then succinctly describedin a two-elementcontour adjacencyseries vector (CASV)that summarizesthe total numberof ascendingand descendingintervalsin a givencontour.The top half of Figure1 displaysthe CASand CASVfor two six-notecontoursanalyzedby Friedmann(1985),1takenfromSchoenberg's Fantasyfor Violin and Piano, op. 47, measures1 and 2, and the Trio section of the Minuetfrom the Suite,op. 25, measures1 and 2. Friedmann's(1985) second analytictool, the CC, providesa morecomplete descriptionof contour,describingthe relativepitch relationsbetween all adjacentand nonadjacentelements.In the CC, the lowest pitch is coded as 0, the highest pitch as n - 1, with n equal to the number of unique pitches in the contour.The contour class notations for the melodic fragmentsof Figure1 are also shown. The individualpitch relationswithin the CC define a series of contour intervals(CIs) that describethe relativepitch intervalsbetween adjacent and nonadjacentnotes withinthe CC. Forexample,the CI for the adjacent interval1 - » 2 of the first melody in Figure 1 is +1, the CI for the next adjacentinterval3 - >5 is +2, and the CI for the nonadjacentinterval4 - > 0 is -4. The entire set of CIs for a given contour producesthe contour intervalarray(CIA),which notes the frequencyof each CI, with positive (ascending)and negative(descending)intervalsseparatedby a slash. Similar to the CAS, the CIA can be characterizedby a pair of two-element vectors, the CCVI and the CCVII.The CCVI summarizesthe ascending versusdescendingcharacterof a contour and is producedby multiplying 1. For all theoreticalexplications,it will be assumedthat comparisonsare beingmade betweencontoursof equivalentlengths.Althoughcomparisonsof unequalcontourlengths are possible with these tools, such comparisonsrequiregeneralizationsthat will not be discussedhere.
298
Mark A. Schmuckler
Contour Adjacency Series (CAS) : Contour Adjacency Series Vector (CASV): < 3,2 >
< 3, 2 >
Contour Class (CO: < 1, 2, 3, 5, 4, 0 >
< 1, 4, 2, 3, 5, 0 >
Contour Intervals(C/s) : Positive 1 1-2 2-3 3~4
1
2 1-3 2-4 3-5
3 1-4 2-5
3
2
Positive
Negative 45|t 1-5
i
1-0 5-4
0 I 2
2 2-0
3 3-0
4 4-0
Î
i
Î
5 5-0
1 I 3
Contour Interval Array (CIA) : Contour Class Vectors: CCVI < 19, 16 > CCVII < 9, 6 >
t 1-2 2-3 4j£
2 1-3 3-5
2
Negative
34S|l 1-4 1-5 2-5
2
Ï
1-0 4-3
0| 2
CCVI < 17, 18 > CCVII < 8, 7 >
Similarity Measures: CASV Difference = 0 CCVI Difference = 2 CCVII Difference = 1
Fig. 1. The CAS, CC, CI, CIA, and CCV, as well as the CASV, CCVI, and CCVII difference measures proposed by Friedmann (1985) for two sample contours.
the frequency of each CI by the size of the CI and then adding together all ascending and descending intervals. The CCVII provides a more general assessment of the contour, taking into account frequency and direction of CIs irrespective of size; this measure is produced by adding the frequencies of all ascending and descending intervals. The CASV,the CCVI, and CCVII all assess contour similarity by creating a difference score between corresponding digits of the CASV, CCVI, or CCVII; calculation of these values is also shown in Figure 1. Finally, these equivalence relations are to be calculated with both contours in their original (prime) form, as well as when one contour is in prime form and the other contour has been transformed via inversion, retrograde, or retrograde-inversion operations. Marvin and Laprade (1987) describe an alternative approach to contour analysis. Using Morris's (1987) "contour space" as their starting point, these authors propose a contour-segment (CSEG) representation that orders the elements of a contour from lowest to highest (e.g., 0 to n - 1),
TestingModelsof MelodicContourSimilarity
299
with n again equal to the numberof distinct pitches within the contour. with these subsetsconsistSubsetsof the CSEGare possible (CSUBSEGs), of and of combination contiguous noncontiguouspitches.Figure2 ing any shows the two contoursof Figure1 (herelabeledCSEGs),along with three sample four-elementCSUBSEGs.It should be emphasizedthat although subsetscan be of any length, this figurepresentsfour-elementCSUBSEGs,2 n If is translatedto consist 2 1. the CSUBSEG to from necessary, ranging n this translation 0 to with of integersfrom 1, equivalentto the initial CSUBSEGrepresentation. With this CSEGrepresentation,one can generatea comparisonmatrix (COM-matrix),which is a two-dimensionalarraydisplayingthe resultsof pitch comparisonsbetweenall elementsin the contour.The resultsof the comparisonsare listed as + (secondnote higherin pitch than the first), 0 (second note equal to the first), and - (second note less than the first). Figure2 also displaysthe COM-matricesfor the two contours. So far,therelationbetweenFriedmann's (1985) andMarvinandLaprade's (1987) theoriesis fairly transparent.Marvin and Laprade'sCSEGrepresentationis equivalentto Friedmann'sCC, and the COM-matrixcan easily be usedto generatethe CAS,CASV,and CCVII.The CASappearsimmediatelyto the rightof the centerdiagonalof the COM-matrix,and the CCVII can be calculatedby totalingthe +'s and -'s of the upper-halfof the COMmatrix.The COM-matrixalso gives rise to a uniquemeasureof similarity, called the contour similarityfunction (CSIM).The CSIMis calculatedby countingthe correspondences(foreitherthe upperor lower half matrix)of the positionsof the +'sand-'s betweentwo COM-matrices,with this number dividedby the total numberof positions. As with Friedmann(1985), CSIMvalues can be calculatedbetween contours in prime form and between one primecontourand one transformed(inversion,retrograde,and contour.The CSIMvalue for the two sample conretrograde-inversion) tours is also shown in Figure2. Marvinand Laprade(1987) also suggesta contour similaritymeasure calledthe contourmutuallyembeddingfunction(CMEMB),which counts the numberof CSUBSEGsthat are mutuallyembeddedin two contours, and dividesthis overlapby the total numberof CSUBSEGs.Figure3 presents the calculationof the CMEMBfor the samplecontours,showing all four-elementCSUBSEGsfor these contours, in 0 to n - 1 notation when necessary.The total for each CSUBSEGpatternis then determined,and the number of CSUBSEGsshared by both contours is divided by the total The CMEMBcan be calculatedfor CSUBSEGs numberof CSUBSEGs. vary2. In total thereexist 15 four-elementcontiguousand noncontiguoussubsetsof a sixelementset. The formulafor calculatingthe total numberof subsetsof a givenlength(m)in a largerset (n) is: n\ I ( m\ * (n-m)l ) (Marvin& Laprade,1987; Rahn, 1980).
300
Mark A. Schmuckler
Fig. 2. The CSEG, three sample CSUBSEGs of length 4, the COM-matrix, and the CSIM measure, proposed by Marvin and Laprade (1987) for two sample contours.
ing in length from 2 to n - 1, and for one contour in prime form and a form. secondcontourin prime,retrograde,inversion,or retrograde-inversion Both Friedmann(1985) and Marvinand Laprade(1987) assumethese measuresdefineequivalencerelations,suchthat contourswith comparable structural descriptions are psychologically associated. For example, Friedmann(1985) justifiesthe need for contour descriptionsof 20th centurymusicnot becauseof any paucityof theoriesdescribingpitch and segclass relations (Forte, 1973; Rahn, 1980), but because contour is more readilyperceivedby the majorityof listenersthan pitch class information, and thus is more likely to characterizethe listener'sexperience. Althoughrigorousand systematic,this focus on the intervalcontent or contoursubsetinformationneglectsa crucialaspectof melodiccontournamely,the global shape of the contour.Although global contour shape can be discernedfrom these representations(imaginethe CC or CSEGas line drawings),neither model adequatelycharacterizesthis information. One aspectof global shapethat may be importantis the degreeof oscillation (e.g., up and down movement)in the contour.Forexample,the sample contoursof Figures1-3 aredistinguishablein thatthe secondcontourseems
Testing Models of Melodic Contour Similarity
301
Fig. 3. The CMEMB, proposed by Marvin and Laprade (1987), for two sample contours.
to contain more oscillation than the first. One method of quantifying the degree of oscillation is to simply count the number of reversals in direction in this contour; in this case, the first contour has one reversal (ascend - > descend) whereas the second contour contains three reversals (ascend - > descend - > ascend - > descend). An additional measure is based on the distance in pitch (semitone) space encompassed by these reversals.3 For the first sample contour, the ascending motion encompasses 25 semitones (Bl>3 - > B5), whereas the descending motion covers 28 semitones (B5- » G3). In comparison, the ascending and descending motions of the second contour cover 13, 10, 11, and 15 semitones. Numerous possible quantifications can be derived by using this information; two such measures are the mean pitch interval size and the summed pitch interval size for all intervals in the contour, with these values charac3. It would also be possible to count intervals in contour space, using the same contour coding procedure as that of Friedmann and Marvin and Laprade. In fact, these two methods give highly comparable results.
302
MarkA. Schmuckler
terizingoscillation somewhat differently.Becausemean pitch intervalinformationis normalizedby the numberof contourreversals,it treatseach ascendingand descendingmotion within the contour equally;thus, mean pitch intervalis relatedto individualintervalsize within the contour.In contrast,becausesummedpitch intervalinformationaggregatesacrossall intervals,it providesa global measureof pitch divergencewithin the contour.For both intervalmeasures(as well as for the reversals),similarityis calculatedusing differencescoresfor these values. The distinctionbetweenthe two pitch intervalmeasurescan be appreciatedby consideringthe meanand summedintervalinformationfor the two samplecontours.The first samplecontourhas a mean pitch intervalvalue of 26.5 semitones,whereasthe secondcontourhasa valueof 12.5 semitones. In contrast, the first sample contour has a summedintervalvalue of 53 semitones,whereasthe secondcontourhas a value of 49 semitones.Thus, the summedpitch intervalmeasuresuggestsa greatersimilaritybetween the contoursthan does the mean pitch intervalmeasure. An alternativecharacterizationof the global shapeof a contourinvolves looking for the presenceof repeatedor cyclicalpatterns.For example,the contoursof Figures1-3 are distinguishablein terms of the numberof repeatedpatternsin each.Along these lines,the firstcontouris characterized by a singlerepetitionof an ascendingand descendingmotion, whereasthe secondcontourcontainstwo cyclesof up-downmotions.Again,intuitively it seemsthat this differencecould be importantin one'sperceptionof these contours,as well as being relatedto one's sense of the similaritybetween the contours. One typicalprocedurefor quantifyingcyclicalinformationinvolvesthe applicationof Fourieranalysistechniques.Describedsimply,Fourieranalysis convertsa signal from the temporaldomain into the frequencydomain, providinga mathematicaldecompositionof the signal into a set of harmonicallyrelatedsine waves. Eachof these sine waves is characterizedby an amplitude(strength)and phase (timingrelation)value,with the relative amplitudesand phasesof the sine wave componentsprovidinga quantitative measureof the differentcyclicalpatternswithin the signal. Considering all these frequencycomponents, Fourieranalysis provides a general descriptionof the shape of the contour, taking into account both slow moving, low-frequencymovement such as general trend, as well as any high frequency,point-to-pointfluctuationin the contour. Figure4 displaysthe resultsof Fourieranalyzingthe samplecontoursof Figures1-3, listing the amplitudeand phase spectrafor cyclical components of one, two, and threerepetitionsper pattern.These spectrasupport the qualitativedescriptionsjust provided.Basedon its amplitudespectrum, the firstcontouris characterized stronglyby a singlerepetitionpercycle(Har. 1/RJ, with weakercomponentsfor two and threerepetitionsper cycle. In
Testing Models of Melodic Contour Similarity
303
Fig. 4. The results of Fourier analysis of the two sample contours. Shown are the real (Am), imaginary (B ), amplitude (RJ, and phase (OJ components produced by the Fourieranalysis and the correlations between amplitude and phase spectra.
contrast,the secondcontourconsistsof a strongcomponentof two cyclesper repetition(Har.2/RJ, with weakercomponentsat one and threecycles. Fourieranalysis has a number advantagesfor contour analysis. One strengthis that it providesan obviousmeasureof similarity- contourswith comparablecyclicalstructureare perceivedas relatedby listeners.The degree of association between contours can be assessed in any numberof ways. One procedureinvolvescorrelatingamplitudeand phase spectra.A correlationcoefficientis attractivein that it comparesonly relativepatternsof ups and downs, collapsingacrossabsolutedifferencesin the spectra, and has associatedtablesof statisticalsignificance.It is possible,however,that the magnitudeof differencesin the spectraare meaningful.To capturethis aspect,one can calculatean absolutedifferencescore between correspondingcomponentsof the spectra,with contour similaritybased on the amountof differencebetweenindividualfrequencycomponents,or on an averagedifferencecalculatedacrossall harmonics.Regardlessof the
304
MarkA. Schmuckler
associativemeasureused, the implicationis that the degreeof association betweencontourswill be relatedto the perceptionof contour similarity. A second advantageis that the output of a Fourieranalysis is largely invariantin the face of differenttransformationsof the contour.For example, Fourieranalysisis essentiallyscale independent,such that a contour consistingof largeintervalleaps will producecomparablephase and amplitudespectrato a similarcontourmade up of small steps.In the same vein, the low-frequencycomponentsof the output of a Fourieranalysis will be relativelyinvariantin the face of melodic ornamentation,such as grace notes, passingtones, and neighbortones; higherfrequencycomponents will, however,vary somewhat.In both of these cases, the coding of the input representationbecomesimportant.For scale independence,differentcodingsproduceoutputsthat can varyfrom highlysimilarto identical. As for melodic ornamentation,the degreeof similaritybetween outcontains putswill varydependingon whetheror not the inputrepresentation and both information, rhythmic nonrhythmicinputs although rhythmic shouldproducehighlyrelatedoutputs;furtherconsiderationof rhythmin contouranalysisis taken up in the generaldiscussion.Irrespectiveof these final issues, it seems clearthat Fourieranalysisof contour is a potentially powerfultechnique. ApplyingFourierproceduresto the analysisof melodic contoursis not without some analyticpitfalls,however.One seriousconcernis that Fourieranalysisrequiresa varietyof assumptions,some of which are violated in this application.For example,one importantassumptionis that the series being analyzedvia Fouriertechniquesis an extended sequencethat representsthe samplingof an infinitelyperiodicsignal;in contrast,melodic contoursareshortanddiscrete.Thisconcernhas both theoreticalandpractical implications.Theoretically,the concernis that becausethe seriesto be analyzeddoes not meetthis criterion,the resultsof the analysis,in termsof its ability to forecast future cyclical patterns, is suspect. Practically,the concernis that with a short, discreteseries,a Fourieranalysiswill be disproportionatelyinfluencedby informationat the beginningand endingof the sequence,with such "edgeeffects"distortingthe Fourierspectra,also resultingin decreasedpredictivepower. In defense of the theoreticalviability of this application,it should be rememberedthatthe goal hereis not the typicalpredictiveforecastingcommonly associatedwith time-seriesanalyses (the family of analyticprocedures to which Fourieranalysis belongs). In contrast, Fourieranalysisis being used strictlyas a convenienttool to quantifythe presenceof repetiFourieranalysisis simplya mathtive patternsin a melody.Fundamentally, ematicaldecompositionprocedurethat is applicableto any numericalseries.Althoughcaremustbe takenin interpreting the outputof thisprocedure,
TestingModelsof MelodicContourSimilarity
305
thereis no reasonwhy this techniquecannot be used to providea description of any numericalseries,includinga melodiccontour. As for the practicalconsiderations,one procedureused to control edge effectsinvolvesmathematicallytransformingthe seriesby usingwindowing techniques(e.g., Hammingor Kaiserwindows).Suchwindowsreduceedge effects by weightingthe beginningand ending of a sequenceless than the middleof the sequence.Unfortunately,given the lengthof the seriestested in this work, suchproceduresactuallyalterthe shapeof the contoursthemselves;thus,similaritymeasuresbasedon suchalteredcontoursareof questionable utility.As such, it is ultimatelydifficult to control edge effects, meaningthat the resultsof a Fourieranalysisof contour may be too distorted to characterizethe melody adequately.As indirectsupportfor the viabilityof this approach,Fourieranalysishas proven effectivein analyzing short, discreteseries of tonal and rhythmicinformation(Chiappe& 1987; Cuddy& Thompson,1992; Schmuckler, 1997; Cuddy& Badertscher, Krumhansl,1990; Krumhansl& Schmuckler,1986; Palmer& Krumhansl, 1990; Schmuckler,1990, 1997). It is an open question, though, whether Fourieranalysisprocedureswill also be applicableto melodiccontours. In summary,a numberof proceduresfor quantifyingcontour and predictingcontoursimilarityhave been developed.Two of these approaches, those of Friedmann(1985) and Marvinand Laprade(1987), are relatedin that they grow out of the same music-theoretictradition,adoptingsimilar assumptions.Forexample,thesetheoriesareconcernedwith what Polansky and Bassein(1992) call the "combinatorialcontour,"which consistsof the intervalrelationsbetweenboth contiguousand noncontiguouscontourelements,with all such informationimportantfor determiningsimilarityrelations.Additionally,both approachesacceptthe idea that transformations not of a melody,such as retrograde,inversion,and retrograde-inversion, but can also underlie contour have perceived psychologicalreality only associations.Thus, despite differencesin these theories (see Friedmann, 1987, for a cogentcomparisonof theseapproaches),they sharemanycharacteristics.Two differentapproaches,involving Fourieranalysis and the degreeof oscillation in a contour,have also been developed.Theseideas representa moredramaticdeparturefromthe traditionof Friedmann(1985) andMarvinandLaprade(1987) in thattheyareconcernedwith "linearcontour"(Polansky&cBassein,1992), focusingon an analysisof globalshape. The goal of thesestudieswas to test the abilityof thesemodelsto predict perceivedcontour similarity.Towardthis end, all of these models quantified individualcontoursand predictedsimilarityrelationsbetweenpairsof contours.These similaritymeasureswere then comparedwith a listenergeneratedderivedmeasureof perceivedcontoursimilarity.The decisionto use a derivedmeasureof similarity,as opposedto gatheringdirectsimilar-
MarkA. Schmuckler
306
ity ratings of pairs of melodies, was in large part pragmatic.Pilot work suggestedthat listenershad great difficultyprovidingdirectsimilarityratings for pairs of melodies (using the stimulusmelodies of Experiment1, describedlater),with listenersfrequentlyreportingthat they had forgotten the first melody by the end of the second melody.In keepingwith these reports,there was little intrasubjector intersubjectreliabilityfor contour similarityratings.Thus, an alternativeprocedurefor generatingsimilarity data was used, involvinggatheringcontourratingsof individualmelodies, and then intercorrelatingaggregateratingsto producea derivedsimilarity matrix.This approachis a widely acceptedalternativeto a directsimilarity ratingprocedure(Kruskal& Wish, 1978; Wish & Carroll,1974), having been used successfullyto generateproximitiesfor factoranalysisand multidimensionalscalingapplications(Banks8c Gregg,1965; Guttman,1966; Weisberg& Rusk, 1970). Theseexperimentsalso testedthe generalityof these modelsby examining a range of melodic contours. Experiment1 examined a set of 20th century,nontonalpieces.Whereasboth the Fourieranalysisand oscillation measuresare neutralin terms of the style of music to which they can be applied,the theoriesof Friedmann(1985) and Marvinand Laprade(1987) were developedspecificallyfor the analysisof 20th centurymusic;thus, these stimulirepresentthe most appropriatetest for these models. Experiment 2 provideda subsequenttest of these models by examiningsimple tonal melodicpatterns.Sucha test is criticalin that successfulpredictionof perceivedsimilarityacross the divergentstimulussets of the two experiments establishesthe generalapplicabilityof these models to the analysis of melodic contour per se, as opposed to a more limited applicationto a specificmusicalcorpus. Experiment 1: Similarity of 20th-century Tone Rows METHODS Subjects
Sixteenstudents(meanage, 19.6 years),who eithervolunteeredtheir servicesor were studentsin an introductorypsychologycourseat the Universityof Torontoat Scarborough participatedin this study,receivingeitherextra course creditor $7 for participating.All listenersweremusicallytrained,with a meanof 7.4 yearsof formaltraining,a meanof 3.0 hr per week engagedin music making,and a mean of 18.2 hr per week spentlisteningto music. All listenersreportednormalhearing,and none indicatedthat they were familiar with the passagesof musicplayedduringthe experiment. Experimental Apparatus and Stimuli
Stimuliwere generatedwith a YamahaTX816 synthesizer,controlledby an IBM-compatible286-MHz computer,connectedwith a RolandMPU-401MIDIcontroller.The tim-
TestingModelsof MelodicContourSimilarity
307
breusedby the synthesizerwas harmonicallycomplex,approximatingthe soundof a piano (see Schmuckler,1989). All tones were inputinto a Mackie1202 mixer,and amplifiedand presentedusinga BOSSMA-12 micro-monitor,at a comfortablelisteninglevel. The stimulifor this experimentconsistedof 12-notemelodies,basedon the primerow formof twenty20th-century12-tonepieces(theserows are shown in Figure5). Eachtrial consistedof a presentationof one contour,with the durationof each note equalto 400 ms. On eachtrial,the lowest note of the contourwas set to a randompitchbetweenFl3and F^, with the remainingnotes of the contoursimilarlytransposed.Listenersheardfour repetitions (blocks)of eachcontour,with contourspresentedin a differentrandomorderfor each listener. Procedure
Listenerswere told they were participatingin an experimenton contour perception. They were informedthat on each trial they would hear a 12-note contourand that they shouldratethe complexityof this contour,usinga 9-pointscale,with 1 indicatingnot very complexand 9 indicatingvery complex. Listenerstyped their responseson the computer keyboard,and as soon as their responsewas entered,the computerbegan the next trial. Listenerswerefreeto takebreaksbetweenthe blocksof trials.Subsequentto the finalblock of trials,listenerscompleteda musicalbackgroundquestionnaireand were debriefedas to the purposeof the experiment.The entireexperimentlastedapproximately30-45 min.
Fig. 5. The 20 stimuluscontoursused in Experiment1.
308
Mark A. Schmuckler RESULTS
The first step in the analysisinvolvedquantifyingcontour similarityon the basis of the variousmodels.All of these modelsproducemultiplemeasuresof similarity.Friedmann(1985) providesdifferencesin the CASV,the CCVI,and the CCVII;becausethey are differencescores,these valuesrepresentdissimilarity,with smallnumbersreflectingsimilarityand largenumbersdissimilarity.Marvinand Laprade(1987) measuresimilarityvia CSIM and CMEMBvalues. For both of these theories, measuresare calculated between two contours in prime form, as well as between one contour in primeformand the secondcontourin retrograde,inversion,or retrogradeinversionform. Thus, contour similaritycan be based on similaritybetween any of these forms, or the maximumsimilarityvalue across these forms;in fact, Marvinand Laprade(1987, pp. 237, 245) assumethat contour similarityis a function of this "maximum"value. Fourieranalysis also producesmultiple similaritymeasures,includingcorrelationsof the amplitudeor phasespectrafor pairsof contours,as well as differencescores between the harmoniccomponentsfor the amplitudeand phase spectra. Finally,contouroscillationalsoproducesmultiplesimilarityvalues,involving differencescoresbasedon the numberof contourreversals,the meanpitch interval,and the summedpitch interval.Again, becausethese are differences they produce dissimilarityvalues, and hence should be negatively related to perceivedsimilarity.Table 1 summarizesthese differentmeaTable 1 Summary of Contour Similarity Predictors Predictor Friedmann Prime CASV Retrograde Prime CCVI Retrograde Prime CCVII Retrograde Marvin and Laprade Prime CSIM Retrograde CMEMB Prime Retrograde Fourier Analysis Correlation Amplitude Correlation Phase Oscillation Reversals Average Interval Size Summed Interval Size
ContourForm Inversion Inversion Inversion
Retrograde-Inversion Retrograde-Inversion Retrograde-Inversion
Maximum Maximum Maximum
Inversion Inversion
Retrograde-Inversion Retrograde-Inversion
Maximum Maximum
Difference Score Difference Score
Note- CASV = Contour Adjacency Series Vector, CCVI and CCVII = Contour Class Vectors, CSIM = Contour Similarity Function, CMEMB = Contour Mutually Embedding Function.
309
TestingModelsof MelodicContourSimilarity M01: M12: M16:
11 10 6720195438 95 10 4 11 863 012467 10
1207 11
3598
Friedmann: Diff. Score: CASV CCVI CCVII 1* Contour I MOI MÔÏ M12 I I MOI MOI M12 I I MOI MOI M12 M12 M16 M16 2ndContour M12 M16 M16 M12 M16 M16 5 Prime 0 5 33 165 198 6 32 38 2 2 67 24 14 131 34 8 Retrograde 3 2 24 3 2 131 67 34 14 Inversion 8 Retro-Inver 0 5 5 33 165 198 6 32 38 5 131 165 198 24 Maximum 3 5 32 38 Marvin & Laprade: Contour lrt/2"1 M01/M12 M01/M16 M12/M16
Prime 0.52 0.24 0.42
CSIM 2ndContourForm Retro Inver R-Inv 0.48 0.34 0.55 0.76 0.58 0.42 0.58 0.70 0.30
Max 0.55 0.76 0.70
CMEMB 2ndContourForm Prime Retro Inver R-Inv 0.35 0.27 0.22 0.42 0.20 0.40 0.41 0.18 0.11 0.53 0.44 0.12
Max 0.42 0.41 0.53
Fourier Analysis: MOI fl,