248
IEEE TRANSACTIONS ON INFORMATION TECHNOLOGY IN BIOMEDICINE, VOL. 8, NO. 3, SEPTEMBER 2004
Unobtrusive Monitoring of Computer Interactions to Detect Cognitive Status in Elders Holly Jimison, Member, IEEE, Misha Pavel, Member, IEEE, James McKanna, and Jesse Pavel
Abstract—The U.S. has experienced a rapid growth in the use of computers by elders. E-mail, Web browsing, and computer games are among the most common routine activities for this group of users. In this paper, we describe techniques for unobtrusively monitoring naturally occurring computer interactions to detect sustained changes in cognitive performance. Researchers have demonstrated the importance of the early detection of cognitive decline. Users over the age of 75 are at risk for medically related cognitive problems and confusion, and early detection allows for more effective clinical intervention. In this paper, we present algorithms for inferring a user’s cognitive performance using monitoring data from computer games and psychomotor measurements associated with keyboard entry and mouse movement. The inferences are then used to classify significant performance changes, and additionally, to adapt computer interfaces with tailored hints and assistance when needed. These methods were tested in a group of elders in a residential facility.
mediately remediable causes such as medication complications or unsuspected medical illnesses. Additionally, timely recognition of cognitive impairment provides an opportunity to take advantage of the newer drugs available for the early treatment of dementia. In this study, we explored techniques for unobtrusively monitoring naturally occurring computer interactions to detect sustained changes in a user’s cognitive performance. This work involved a needs assessment with representative elder computer users, the development of sample computer games and monitoring algorithms to test our ability to detect trends in cognitive performance, and an evaluation of the cognitive monitoring system in an elder residential facility.
Index Terms—Cognition, computer games, dementia, home monitoring.
According to a 2004 Pew Internet and American Life survey, 22% of adults 65 and older use the Internet [5]. However, adults 65 and older are participating at faster rates, and that trend is expected to continue. The survey also showed that 93% of seniors with Internet access have sent or received email, and that seniors are more inclined to go online and check email on any given day than any other group of Internet users. The second most common online activity for seniors is researching information, especially health topics. Additionally, over a third of the population of seniors online play computer games. Interestingly, elders play computer games almost as frequently as other groups of people. Thirty-five percent of Internet users age 65 and older have played a game online, compared to 39% of all users. Previous research relating to how computer games and tasks have been used with elders has addressed the issues of what games and activities elders enjoy and what are the effects of performing the computer activities. One of the earliest studies of computer game use by seniors was by Hollander and Plummer [6]. They followed seniors’ use of two computer games over a three-week period. Participants most enjoyed trivia-style games that tested knowledge in sports, history, movies, science, and literature. After the test period, 49% of the participants expressed interest in learning new and more challenging computer tasks. The researchers also found therapeutic benefits of the intervention in seniors’ improved use of leisure time and greater feelings of success and achievement. Other researchers have used computer games to monitor agerelated changes in speed-of-task performance in elders. Clark et al. [7] showed that elders who played videogames were able to improve their scores dramatically over a seven-week period and also demonstrated faster general reaction times compared to controls. Drew and Waters [8] note that perceptual-motor problems of the elderly may be due to lack of practice and exer-
I. INTRODUCTION
I
N MANY countries, the fastest growing segment of the population is people over the age of 65. With an increasing percentage of healthcare resources being spent on the care of the elderly, it is important to develop interventions to assist elders and their caregivers in maintaining quality of life and independence as long as possible. One of the key functional losses at risk with aging is a decline in cognitive abilities. Estimates vary depending on assessment protocols and populations studied, but up to 50% of all individuals over age 85 are found to have measurable decline in cognitive function [1]. These individuals are at high risk for dementia and requiring increasing levels of assisted living. Even mild cognitive declines lead to degraded quality of life. Thus, a major goal of seniors and their families is to optimize their quality of life and remain not only physically, but also mentally fit. Researchers have demonstrated the importance of identifying the declines in cognitive function indicative of imminent functional impairment [2]–[4]. Many of these changes may have im-
Manuscript received December 22, 2003; revised April 5, 2004 and July 7, 2004. This work was supported in part by a grant from the Intel Corporation and in cooperation with Spry Learning, Inc. H. B. Jimison is with the Department of Medical Informatics, Oregon Health and Science University, Portland, OR 97230 USA (e-mail:
[email protected]). M. Pavel and J. McKanna are with the Biomedical Engineering Department, Oregon Health and Science University, Portland, OR 97239 USA (e-mail:
[email protected];
[email protected]). J. Pavel is with Electrika, Inc., Islip Terrace, NY 11752 USA (e-mail:
[email protected]). Digital Object Identifier 10.1109/TITB.2004.835539
II. COMPUTER USAGE BY ELDERS
1089-7771/04$20.00 © 2004 IEEE
Authorized licensed use limited to: Univ of Calif Irvine. Downloaded on April 22, 2009 at 18:41 from IEEE Xplore. Restrictions apply.
JIMISON et al.: UNOBTRUSIVE MONITORING OF COMPUTER INTERACTIONS TO DETECT COGNITIVE STATUS IN ELDERS
249
cise, and that this in turn may have serious effects on all aspects of daily living. Computer games may be a way to remediate or delay this decline. Riddick et al. [9] also used these games to test emotional effects of computer game use by elders. Although in their study the emotional assessments showed a decline in pleasure with an increase in arousal, other studies [10] have shown a trend toward decreased loneliness and depression in elders who started to use computers routinely. Riddick et al. also noted that participation in the intervention served as a social catalyst for the participants. The computer games served as a topic for conversation, joint problem-solving, and a source of friendly competition. Other research has specifically focused on which computer games elders actually play and what aspects they prefer. Weisman [11] studied participants with an average age of 85 and found several games that participants were interested in using repeatedly. Ball et al. [12] studied the effects of specific cognitive training on older adults (over 65 years of age). They focused on three aspects of cognition that related to independent living and the need for care: memory (verbal episodic), reasoning (solving problems with a serial pattern), and speed of processing (visual search and identification). The “speed-of-processing” training used a computer task based on the divided-attention format to train and test search skills and the ability to locate information quickly. The researchers were able to show improvement in the targeted aspects of cognition with their training interventions and also show durability of the effects at two years, although they were not able to detect effects on everyday functioning. Overall, researchers have shown that many elders enjoy computer games and play them routinely [6], [11]. Additionally, these computer games can be used to test various aspects of cognition, such as knowledge, short-term memory, perceptualmotor skills, and attention [6], [12].
(1)
III. NEEDS ASSESSMENT OF ELDERS’ USE OF COMPUTERS In our own work, we felt it was important to start a study in this area with a needs assessment to understand the technology and communication needs and preferences of elders. In a study done with the Spry Learning Company and sponsored by the Intel Corporation, we conducted focus groups with older computer users to provide us with necessary background on existing computing and communications needs, as well as interface preferences. We studied 15 residents (mean age 79.5 8.5) in the Calaroga Terrace retirement facility in Portland, OR. Participants were selected because of their interest and use of computers. Participants identified e-mail, Web browsing, and computer games as the applications they used most often. The most popular computer game played by this group was a variation of the traditional Solitaire card game called FreeCell. The FreeCell computer game is freely available on the Web and also available as an accessory in computers with Windows operating systems. It is a computer game that requires significant strategic planning and corresponds nicely with conventional measurements of executive function and planning abilities. Additionally, the various starting arrangements of cards offer a wide variation in level of difficulty in solving the game, thus allowing us to tailor the game level to the skill level of the user. Based on the feedback
from our focus groups with older computer users, we decided to use the FreeCell computer game as an initial prototype for exploring the use of monitoring user interactions with computers to detect cognitive change. We also decided to monitor keyboard entry speed and mouse trajectories during routine computer use. Our goal in this work was to develop unobtrusive techniques of collecting long-term data that will allow us to detect sustained trends in cognitive performance. Our focus group data also indicated that monitoring incidental computer use, such as game playing, is not seen as invasive. People perceive these activities as beneficial for their cognitive well-being. IV. DEVELOPMENT OF A RESEARCH VERSION OF FREECELL As a preliminary test case for developing computer tasks to detect cognitive change, we adapted the computer game FreeCell to measure a user’s cognitive performance throughout interactions with the game. User interactions were monitored and compared with “standard” performance, as defined by an automated solver. Initially, we used the automated solver developed by Holroyd [13]. This is an ANSI C program that solves FreeCell with near minimal solution. We used this to approximate a standard player. The solver is used in three ways: 1) to provide hints if the player is unable to determine the next move; 2) to define a metric of difficulty throughout each game; and 3) to serve as an efficiency comparison for judging relative user performance. The difficulty metric was defined in terms of an at a given time point additive function where the difficulty of the game is defined by the sum of the difficulties associated with each move between the final solution and the current state of the game, i.e.
where is the number of cards that need to be moved to achieve a standard solution. For simplicity, the current definition of the difficulty metric is based on the number of cards that needed to be moved, with defined as an identity function. The intuitive representation of this definition is that the difficulty corresponds to the number of cards to be moved in order to solve the game. Given the definition of difficulty, it is possible to characterize the cognitive performance of a player on each move by the reduction of the difficulty due to that move (2) This difficulty metric permits the system to assess whether an individual move by a user (or a series of moves) is consistent with winning the game in accordance with the standard player. In particular, each appropriate move should reduce the difficulty of the game by one. Each move away from a solution increases the difficulty of the game and the efficiency of such a move is, therefore, negative. This metric provides a framework for characterizing user performance both for individual moves and for an overall game. An illustration of this move-by-move analysis of a game is shown in Fig. 1. This graph shows a comparison of a typical participant’s performance (upper right line) to the automated
Authorized licensed use limited to: Univ of Calif Irvine. Downloaded on April 22, 2009 at 18:41 from IEEE Xplore. Restrictions apply.
250
IEEE TRANSACTIONS ON INFORMATION TECHNOLOGY IN BIOMEDICINE, VOL. 8, NO. 3, SEPTEMBER 2004
As input to on overall performance measurment, we monitored game difficulty and user performance based on the play-by-play output of the automatic solver. We defined user performance efficiency on a given game in terms of the ratio of the average reduction in the game difficulty, i.e., number of required moves to the number of moves executed by the user. For example, an appropriate move has efficiency of one, but when a user makes a move that increases the game difficulty, the efficiency is negative ( 1). The end of the game, shown at the right of the graph, shows user efficiency being as good as the automated solver because the slope of performance is equal.
Fig. 1. FreeCell performance curve for a sample subject compared to optimal performance.
solver’s performance (lower left line). Game difficulty, plotted on the ordinate, starts high and moves to zero at the end of the game. Note that the slope of the player’s performance indicates the efficiency of his moves; a slope less than 45 reflects a substandard move, whereas, a slope greater than 45 indicates more efficient moves than those of a standard player. Using this definition of a game difficulty metric, we developed a summary cognitive performance metric for each game. The performance on each game is characterized by a number of variables: is the automated solver’s calcula1) Game difficulty tion of the number of moves required to complete game on the th move of the user. 2) Average user efficiency that is defined by the efficiency averaged over all moves during a game. We note that the efficiency of each move is positive if it decreases the difficulty and negative if it increases the difficulty of the game. 3) The outcome of the game, outcome = win if the game was won, quit if the user closes the game while the game is still winnable and there are cards left to play, loss if the game was completed to a state where it was unwinnable. 4) Time to completion of session = this can either be the time elapsed between the start and end of the user session with a particular game , or a smoothed average of time between moves multiplied by the total number of moves . is repreThe resulting user performance on a given game sented by the average efficiency per unit time, i.e. (3) where is the game difficulty, is the total number of the participant’s moves, and is the duration of the th move. These scores then provide the basis for monitoring of cognitive function after appropriate smoothing to remove normal daily variation. The difficulty scores can also be used to characterize learning effects useful for the detection of true long-term sustained trends in cognitive performance.
V. EVALUATION OF COGNITIVE COMPUTER MONITORING To test our cognitive performance assessment algorithms in a real setting, we enrolled nine participants (mean age of 80.2 8.0) in a study to use our research version of FreeCell for a period of three weeks. These participants also received a brief cognitive battery that included tests of verbal memory, language, attention, working memory, and processing speed. Based on pre-established cutoff scores on a test of delayed verbal recall, three of the nine participants were diagnosed with mild cognitive impairment. With the data from the computer game used by the participants in the study, we were able to collect cognitive performance statistics on over 2000 games. This provided us with a teaching and testing data set for developing algorithms for detecting sustained cognitive changes against a background of normal daily variation in performance and independent of learning effects. In addition, the metrics of user efficiency and game difficulty allowed us to develop an algorithm for automated user assistance (hints) and an algorithm for determining the best level of game difficulty to present to users. Our method for determining game level difficulty was based on keeping the games sufficiently challenging but not so difficult as to be discouraging (approximately a 70% win rate). We based the optimal game level difficulty on a win rate that would provide us with the most sensitive measure of user performance. This is also optimal at a mid-range win rate. We were also able to test refinements of the user interface in this study. We first tested a new “hint” function that allowed users to receive a suggestion for a move if there had been a delay of more than 30 seconds. The hints were based on the first move from an automated solver we had integrated into our research version of the FreeCell game. This hint feature allowed new users to learn to play the game independently and also allowed users to continue to play a game as long as possible, giving us more opportunities for performance measurement. Our usability testing showed that people often waited longer than 30 seconds before making a move and that they found it disruptive to be asked if they wanted a hint (our pop-up window initially covered some of the cards). The participants much preferred to select the hint option from a toolbar menu on their own initiative. The advantage to offering the tailored difficulty setting and hint features in an elder population is that these types of games and tasks will be more accessible to a majority of elders with
Authorized licensed use limited to: Univ of Calif Irvine. Downloaded on April 22, 2009 at 18:41 from IEEE Xplore. Restrictions apply.
JIMISON et al.: UNOBTRUSIVE MONITORING OF COMPUTER INTERACTIONS TO DETECT COGNITIVE STATUS IN ELDERS
251
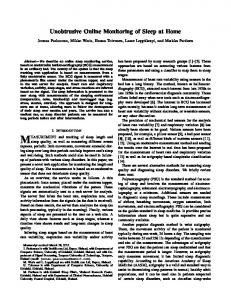
TABLE I PERFORMANCE SCORES FOR NORMALS VERSUS MCI
(a)
(b) Fig. 2. (a) Game performance over time for a subject with mild cognitive impairment. (b) Game performance over time for a subject without cognitive impairment.
varying skills and cognitive abilities. The tailored interface is more likely to keep them engaged, and thereby monitored. VI. RESULTS The study participants played the computer game quite frequently during the three-week period (median of 150 games each, ranging from 23 to 660 games) and reported that they enjoyed the activity. We also continued to follow their natural use of the computer game in the subsequent six months. We judged game difficulty and user performance based on the play-by-play output of the automatic solver. Using our performance metric of average game efficiency (performance slope, as illustrated in Fig. 1), we were able to use a threshold of 0.4 to separate subjects with mild cognitive impairment from the group with no cognitive impairment. However, daily performance variation within subjects was quite high. For days where subjects played at least three games, the deviation for average daily score was 0.30 0.14 for subjects with mild cognitive impairment, and 0.22 0.13 for subjects without impairment. Fig. 2(a) and (b) shows performance scores over time for a representative subject with mild cognitive impairment and a representative healthy control. Multiple measures of performance over time are required for robust cognitive classification. We currently use a Gaussian window filter with a standard deviation of approximately seven days to smooth the data in preparation for trend detection. However, given our early results, score variability itself appears to be a useful feature in distinguishing normals from those with mild cognitive impairment. The variability in scores is higher for patients with mild cognitive impairment. Sensitivity to game difficulty and varying performance scores (compared to normals) are indicative of cognitive impairment. Although the primary benefit of this approach to cognitive assessment and monitoring is to be able to detect changes in performance using subjects as their own controls, we also investigated the relationship between the performance scores and
results from standard cognitive assessments. Table I shows how the average performance metric in a three-week period distinguished between elders with and without mild cognitive impairment. We averaged each individual’s performance score across games and then reported the average of the individuals’ average scores in Column 1. Column 2 shows the standard deviation for the individuals’ averages, although this is difficult to interpret with the small number of patients with mild cognitive impairment in our study. Finally, Column 3 shows the average within subject variability in scores over time. VII. DISCUSSION The computer game performance metric based on efficiency of moving toward a solution provides a framework for characterizing user performance both for individual moves and overall games. These scores then provide the basis for the monitoring of cognitive function after appropriate smoothing to remove normal daily variation. The goal of this approach to cognitive assessment and monitoring is to detect long-term sustained trends in cognitive performance in hopes of providing early detection of cognitive decline. Our early work with a small number of subjects shows promising results in distinguishing between cognitively health elders and those with mild cognitive impairment. Although the study period and sample size were not large enough to test within-subject cognitive changes, we were able to use the data to characterize daily variation and noise in our measurements. This is an important input for our trend analysis to detect sustained performance changes. Our model for characterizing the variability in performance scores includes variability due to learning as well as normal daily variation. Our development work on this study of the use of computer games to monitor and detect changes in cognitive performance of elder computer uses has shown the feasibility of the following: 1) obtaining a measure of a user’s cognitive performance through unobtrusive monitoring of computer interactions; 2) characterizing normal variations in user performance and task learning; 3) detecting sustained trends in cognitive performance; 4) using measures of cognitive performance and task difficulty to adapt the user interface and future computer interactions. Important future work in cognitive assessment and trend detection through monitoring user–computer interactions include incorporating additional metrics to enhance the sensitivity and
Authorized licensed use limited to: Univ of Calif Irvine. Downloaded on April 22, 2009 at 18:41 from IEEE Xplore. Restrictions apply.
252
IEEE TRANSACTIONS ON INFORMATION TECHNOLOGY IN BIOMEDICINE, VOL. 8, NO. 3, SEPTEMBER 2004
specificity of this measurement. Measures of psychomotor interactions and additional dimensions of cognition, such as attention and memory, will improve the usefulness of this technique. ACKNOWLEDGMENT The authors would like to acknowledge the Spry Learning Company for working with them on recruiting, teaching, and interviewing the participants. The authors would especially like to thank the residents of Calaroga Terrace in Portland, OR who enthusiastically participated in this study and provided them with invaluable feedback. REFERENCES [1] R. N. Anderson, “Method for constructing complete annual U. S. life tables,” in Vital and Health Stat, ser. 2. Hyattsville, MD: National Center for Health Statistics, 1999, no. 129. [2] P. Erickson, R. Wilson, and I. Shannon, Years of Healthy Life. Hyattsville, MD: National Center for Health Statistics, 1995, Statistical Notes, no. 7. [3] L. Boise, D. L. Morgan, J. Kaye, and R. Camicioli, “Delays in the diagnosis of dementia: Perspectives of family caregivers,” Amer. J. Alzheimer’s Disease, vol. 14, no. 1, pp. 20–26, 1999. [4] P. Glascock and D. M. Kutzik, “Behavioral telemedicine: A new approach to the continuous nonintrusive monitoring of activities of daily living,” Telemedicine, vol. 6, no. 1, pp. 33–44, 2000. [5] (2004, Mar.) Older Americans and the Internet. Pew Internet and American Life Project. [Online]. Available: www.pewinternet.org [6] E. K. Hollander and H. R. Plummer, “An innovative therapy an enrichment program for senior adults utilizing the personal computer,” Activities, Adaptations and Aging, vol. 8, no. 1, pp. 59–68, 1986. [7] J. E. Clark, A. K. Lanphear, and C. C. Riddick, “The effects of video game playing on the response selection of elderly adults,” J. Gerontology, vol. 42, no. 1, pp. 82–85, 1987. [8] B. Drew and J. Waters, “Video games: Utilization of a novel strategy to improve perceptual motor skills and cognitive functioning in the noninstitutionalized elderly,” Cognitive Rehab., vol. 4, no. 2, pp. 25–34, 1986. [9] C. C. Riddick, E. B. Drogin, and S. G. Spector, “The impact of videogame play on the emotional states of senior center participants,” Practice Concepts, vol. 27, no. 4, pp. 425–427, 1987. [10] H. White, E. McConnell, E. Clipp, L. G. Branch, R. Sloane, C. Pieper, and T. L. Box, “A randomized controlled trial of the psychosocial impact of providing internet training and access to older adults,” Aging and Mental Health, vol. 6, no. 3, pp. 213–221, 2002. [11] S. Weisman, “Computer games for the frail elderly,” Gerontologist, vol. 23, no. 4, pp. 361–363, 1983. [12] K. Ball and D. B. Berch, “Effects of cognitive training interventions with older adults,” J. Amer. Med. Assoc., vol. 288, no. 18, pp. 2271–2281, 2002. [13] T. Holroyd. (2004, Mar.) Software Archive: PatSolve. [Online]. Available: http://members.tripod.com/professor_tom/archives [14] R. Marks, J. P. Allegrante, C. R. MacKenzie, and J. M. Lane, “Hip fractures among the elderly: causes, consequences and control,” Aging Res. Reviews, vol. 2, no. 1, pp. 57–93, 2003. [15] P. McCormack, “Undernutrition in the elderly population living at home in the community: A review of the literature,” J. Advanced Nursing, vol. 26, no. 5, pp. 856–863, 1997.
[16] T. T. Fulmer, P. H. Feldman, T. S. Kim, and B. Carty, “An intervention study to enhance medication compliance in community-dwelling elderly individuals,” J. Gerontological Nursing, vol. 25, no. 8, pp. 6–14, 1999. [17] D. Evans, H. Funkenstein, M. Albert, P. Scherr, N. Cook, M. Chown, N. C. Hebert, C. Hennekens, and J. Taylor, “Prevalence of Alzheimer’s disease in a community population of older persons: higher than previously reported,” J. Amer. Med. Assoc., vol. 262, pp. 2251–2556, 1989. [18] V. Riefler and E. Larson, “Excess disability in demented elderly outpatients: the rule of halves,” J. Amer. Geriatrics Soc., vol. 47, pp. 1065–1072, 1988. [19] L. Gwyther, “Family issues in dementia: Finding a new normal,” Neurologic Clinics, vol. 18, pp. 993–1010, 2000.
Holly Jimison (M’81) received the B.S. degree in mathematics from the University of Illinois, Urbana, in 1973, and the Ph.D. degree in medical information sciences from Stanford University, Stanford, CA, in 1990. She is an Assistant Professor in the Department of Medical Informatics and Clinical Epidemiology at Oregon Health and Science University, Portland. Her research interests include user models for the presentation of consumer health information, risk communication, and the use of computers for unobtrusive assessment of cognitive function. Dr. Jimison is a member of the AMIA, HIMSS, and the Society for Medical Decision Making.
Misha Pavel (M’67) received the M.S. degree in electrical engineering from Stanford University, Stanford, CA, in 1971, and the Ph.D. degree in experimental psychology from New York University, New York, in 1980. He is a Professor and Interim Chair of the Department of Biomedical Engineering at Oregon Health and Science University, Portland. His interests include augmented cognition, robust pattern recognition, and information fusion. Dr. Pavel is a member of Sigma Xi, ACM, the Psychonomics Society, and the Society for Medical Decision Making.
James McKanna received the B.S. degree in neuroscience, psychology, and computer science from Macalester College, St. Paul, MN, in 2003. He is a Research Assistant in the Department of Biomedical Engineering at Oregon Health and Science University, Portland. His research is focused on techniques for monitoring human–computer interactions to infer cognitive performance. Mr. McKanna is a member of Psi Chi (National Honor Society in Psychology) and Upsilon Pi Epsilon (National Honor Society in Computer Science).
Jesse Pavel received the B.S. and M.S. degrees in computer science from Massachusetts Institute of Technology, Cambridge, in 2002. He is the CEO of Eletrika, Inc. in Islip Terrace, NY. He specializes in algorithms and infrastructure for advanced biomedical instrumentation.
Authorized licensed use limited to: Univ of Calif Irvine. Downloaded on April 22, 2009 at 18:41 from IEEE Xplore. Restrictions apply.