Unsupervised Learning of Visual Taxonomies - Computational Vision
Recommend Documents
Dec 29, 2016 - presently it relies on Python in order to use Keras and scikit- learn for feature learning and t-SNE. The software behind this work is also ...
California Institute of Technology, Pasadena, CA 91125. E-mail: [email protected]. Manuscript received ?? ?? ????; revised ?? ???? ????; accepted 21 Mar ...
Feb 22, 2018 - Heidelberg Collaboratory for Image Processing and Interdisciplinary Center for Scientific Computing, Heidelberg University, Germany. Abstract.
â School of Mathematical Sciences, Dalian University of Technology. â¯Key Lab. of Machine .... tuition, SSC finds the sparsest representation coefficients. Z = [[Z]1, [Z]2, ··· , [Z]n] ..... Figure 4. Examples of the FRGC-Caltech data set. The t
Abstract. Learning rich visual representations often require training on datasets of millions of manually annotated examples. This substan- tially limits the ...
Sep 20, 2016 - Automated discovery of early visual concepts from raw image data is a major open challenge in AI .... B:
Texture is one example of a monocular depth cue — evidence for depth based
on ... object being trained and the training of monocular depth cues happens as a
...
Yang Song, Luis Goncalves, and Pietro Perona. California Institute of Technology, 136-93, Pasadena, CA 9112 5, USA. {yangs,luis,perona}@vision.caltech.edu.
Unsupervised Learning of Stereo Vision with Monocular Cues. David McAllester
and Hoang Trinh. Toyota Technological Institute at Chicago (TTI-Chicago) ...
Unsupervised Learning of Stereo Vision with Monocular Cues. Hoang Trinh and
David McAllester. {ntrinh,mcallester}@tti-c.org. The Toyota Technological ...
tomatically learn different classes of actions present in the data and to apply the learned model to perform action cate- gorization and localization in the new ...
tailed labeled data. Our method is .... permits to learn object classes from images with no label ..... Choose the mixing proportions of the action categories:.
Why not just minimizing the training error? ⢠Never select a classifier using the test set! - e.g., don't report the a
EXPERIMENTS on the TWO-THIRDS POWER LAW for DRAWING MOVEMENTS. ⦠We analysed the validity of the Two-Thirds power law on videos of drawing ...
Abstract. A novel method for unsupervised acquisition of knowledge for taxonomies of concepts from raw Wikipedia text is presented. We assume that the ...
computational learning theory of supervised learning or by information theoretic compression ... 11 ICA Mixture Models for Unsupervised Classification of Non- .... Unsupervised learning algorithms are designed to extract structure from data.
Abstract. This study addresses the problem of choosing the most suitable probabilistic model selection criterion for unsupervised learning of visual context of a ...
Jun 26, 2016 - arXiv:1603.09246v2 [cs.CV] 26 Jun 2016 ..... We call this architecture the context-free network (CFN) because the data flow of each patch is ...
present TRIPPER - a rule induction algorithm that extends RIPPER, a widely ... formance of TRIPPER with that of RIPPER on benchmark datasets from the.
fier restrictions (e. g. most birds build nests), parts of the instances of ... building [8]. .... Aircraft. TitleConcept be T. T use TitleConcept. T build TitleConcept. Boat.
Nov 13, 2015 - Human excel when given larger context and ability to reason about object presence [47]. 1. arXiv:1511.04166v1 [cs.CV] 13 Nov 2015 ...
Unsupervised Learning for Computational ... - arXiv.org › publication › fulltext › Unsupervi... › publication › fulltext › Unsupervi...by C Hodapp · 2016 · Cited by 4 · Related articlesDec 29, 2016 — .csv.gz files (that is, comma-separated values,
Camera miniaturization and mobile computing now make it feasible to capture and .... camera with a fisheye lens that is worn, with continuous low levels of back-.
Gain control / normalization ... Increase in tolerance to position. Local max .... memory. Wallis & Bulthoff '01 but
Unsupervised Learning of Visual Taxonomies - Computational Vision
Each visual word is a cluster of visually similar image patches. The visual dictionary is the set of all visual words used by the model. Typically, this dictionary is ...
Unsupervised Learning of Visual Taxonomies Evgeniy Bart Caltech Pasadena, CA 91125
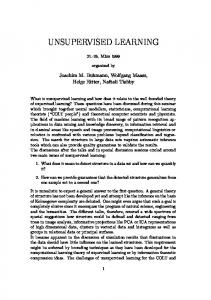
Figure 1. Top: an example taxonomy learned without supervision from 300 pictures (collections 14000, 144000, and 157000) from the Corel dataset. Images are represented using ‘space-color histograms’ (section 4.1). Each node shows a synthetically generated ‘quilt’ – an icon that represents that node’s model of images. As can be seen, common colors (such as black) are represented at top nodes and therefore are shared among multiple images. Bottom: an example image from each leaf node is shown below each leaf.
Abstract
1. Introduction
As more images and categories become available, organizing them becomes crucial. We present a novel statistical method for organizing a collection of images into a treeshaped hierarchy. The method employs a non-parametric Bayesian model and is completely unsupervised. Each image is associated with a path through a tree. Similar images share initial segments of their paths and therefore have a smaller distance from each other. Each internal node in the hierarchy represents information that is common to images whose paths pass through that node, thus providing a compact image representation. Our experiments show that a disorganized collection of images will be organized into an intuitive taxonomy. Furthermore, we find that the taxonomy allows good image categorization and, in this respect, is superior to the popular LDA model.
Recent progress in visual recognition has been breathtaking, with recent experiments dealing with up to 256 categories [8]. One challenge that has been, so far, overlooked, is how to organize the space of categories. Our current organization is an unordered ‘laundry list’ of names and associated category models. However, as everyone knows, some categories are similar and other categories are different. For example, we find many similarities between cats and dogs, and none between cell-phones and dogs, while cell-phones and personal organizers look quite similar. This suggests that we should, at least, attempt to organize categories by some similarity metric in an appropriate space [7, 11]. However, there may be stronger organizing principles. In botany and zoology, species of living creatures are organized according to a much more stringent structure: a tree. This tree describes not only the ‘atomic’ 1
categories (the species), but also higher-level and broader categories: genera, classes, orders, families, phila etc., in a hierarchical fashion. This organization is justified by philogenesis: the hierarchy is a family tree. However, earlier attempts at biological taxonomies (e. g. the work of Linnaeus) were not based on this principle and rather relied on inspection of visual properties. Similarly, man-made objects may often also be grouped into hierarchies (e.g. vehicles, including wheeled vehicles, aircraft and boats, each one of which is further subdivided into finer categories). Therefore it is reasonable to wonder whether visual properties alone would allow us to organize the categories of our visual world into hierarchical structures. The purpose of the present study is to explore mechanisms by which visual taxonomies, i. e. tree-like hierarchical organizations of visual categories, may be discovered from unorganized collections of images. We do not know whether a tree is the correct structure, but it is of interest to experiment with a number of datasets in order to gain insight into the problem. Why worry about taxonomies? There are many reasons for this. First, depending on our task, we may need to detect/recognize visual categories at different levels of resolution: if I am about to go for a walk I will be looking for my dog Fido, a very specific search task, while if I am looking for dinner, any mammal will do; this is a much more general detection task. Second, depending on our exposure to a certain class of images, we may be able to make more or less subtle distinctions: a ‘bird’ seen by a casual stroller may be a snipe to a trained bird-watcher. Third, given the image of an object, a tree structure may lead to quicker identification than simply going down a list, as currently done. There are other reasons as well, including sharing visual descriptors between similar categories [17], and forming appropriate priors for learning new categories. This discussion highlights properties we may want our taxonomy to have: (a) allow categorization both of coarse-categories and finecategories, (b) grow incrementally without supervision, and form new categories as new evidence becomes available, (c) support efficient categorization, (d) similar categories should share features, thus further decreasing the computational load, (e) allow to form priors for efficient one-shot learning.
2. The generative model for visual taxonomies We approach the problem of taxonomy learning as one of generative modeling. In our model, images are generated by descending down the branches of a tree. The shape of the tree is estimated directly from a collection of training images. Thus, model fitting produces a taxonomy for a given collection of images. The main contribution is that this process can be performed completely without supervision, but a simple extension (section 4.2) also allows supervised inference.
The model (called TAX) is summarized in Figure 2. Images are represented as bags of visual words. Visual words are the basic units in this representation. Each visual word is a cluster of visually similar image patches. The visual dictionary is the set of all visual words used by the model. Typically, this dictionary is learned from training data (section 4). Similarly to LDA [2, 15, 5], distinctive patterns of cooccurence of visual words are represented by ‘topics’. A topic is a multinomial distribution over the visual dictionary. Typically, this distribution is sparse, so that only a subset of visual words have substantial probability in a given topic. Thus, a topic represents a set of words that tend to co-occur in images. Typically, this corresponds to a coherent visual structure, such as skies or sand [5]. We denote the total number of topics in the model by T . Each topic φt has a uniform Dirichlet prior with parameter ǫ (Figure 2). A category is represented as a multinomial distribution over the T topics. The distribution for category c is denoted by πc and has a uniform Dirichlet prior with parameter α. For example, a ‘beach scenes’ category might have high probability for the ‘sea’, ‘sand’, and ‘skies’ topics. Categories are organized hierarchically, as in Figure 1. For simplicity, we assume that the hierarchy has a fixed depth L (this assumption can be easily relaxed). Each node c in the hierarchy represents a category, and is therefore associated with a distribution over topics πc . Figure 2 describes the complete generative process. Recall that our criterion for a useful taxonomy is that shared information is represented at nodes which are higher up in the tree and are shared among many images. The generative process described in Figure 2 is naturally suited to this criterion. The nodes higher up in the taxonomy are used by many paths; the information they represent is therefore shared by many images. For instance, the root node is necessarily used by all paths and therefore will model very general topics that exist in all images. Conversely, the lower a node is in the taxonomy, the fewer images traverse it, and the more image-specific the information at that node is. Next, we describe how the tree that represents the taxonomy is generated. A nonparametric prior over tree structures of depth L, known as the ‘nested Chinese restaurant process’ (NCRP) is used [3]. This prior is flexible enough to allow learning an arbitrary taxonomy, but also allows for efficient inference. See [3] for details. Compared to the original NCRP model [3], the proposed TAX model allows to represent several topics at each node in the taxonomy. In addition, it makes all topics available at every node. Although NCRP has been used successfully in text modeling [3], we found that these changes were necessary to infer visual taxonomies (experiments not shown due to lack of space).
Figure 2. Left: the generative model. Right: an illustration of the generative process. An image i is generated as follows. First, a complete path from the root to a leaf through the hierarchy is sampled. Since the hierarchy depth is fixed, this path has length L. The ℓ’th node on this path is denoted ci,ℓ (see plate diagram on the left). Then, for every detection in the image, we sample ℓi,d – a level in the taxonomy – from a uniform multinomial distribution over the L nodes on this path. The node from which this detection is generated is then c = ci,ℓi,d . We then pick a topic zi,d from πc – the distribution over topics at that node. Finally, we pick a visual word from the multinomial distribution φzi,d , associated with topic zi,d . The conditional distributions in the generative process are: Tree ∼ NCRP(γ), πc ∼ DirT [α], φt ∼ DirW [ε]. ℓi,d ∼ Mult(1/L), zi,d ∼ Mult(πci,ℓi,d ), wi,d ∼ Mult(φzi,d )
3. Inference Below, we describe the inference technique that was used in our experiments. The goal of inference is to learn the structure of the taxonomy and to estimate the parameters of the model (such as πc ). The overall approach is to use Gibbs sampling, which allows drawing samples from the posterior distribution of the model’s parameters given the data. Taxonomy structure and other parameters of interest can then be estimated from these samples. Compared to the sampling scheme used for NCRP [3], we augmented Gibbs sampling with several additional steps to improve convergence. The details are given below, but the remainder of this section may be skipped on first reading. To speed up inference, we marginalize out the variables πc and φt . Gibbs sampling then produces a collapsed posterior distribution over the variables ℓi,d , ci,. , and zi,d given the observations. To perform sampling, we calculate the conditional distributions p(ℓi,d = ℓ|rest) (the probability of sampling a level ℓ for detection d in image i given values of all other variables), p(zi,d = z|rest) (the probability of sampling a topic z for detection d in image i) and p(ci,. |rest) (the probability of sampling a path for image i through the current taxonomy; note that this includes the possibility to follow an existing path, as well as to create a new path). These conditional distributions, as usual, are expressed in terms of count
values. The necessary counts are described next. Ni,ℓ is the number of detections in image i assigned to level ℓ. Ni,l,t is the number of detections in image i assigned to level ℓ and ¬(i,d) topic t. Nt,w is the number of detections whose visual word is w assigned to topic t across all images, excluding the current detection d in image i. As usual, a dot in place ¬(i,d) of an index indicates summation over that index, so Nt,. is the total number of detections assigned to topic t (excluding the current detection d in image i). m¬i c is the number of images that go through node c in the tree, excluding the ¬(i,d) current image i. Nc,t is the number of detections assigned to node c and topic t, excluding the current detection ¬i (i, d). Nc,t is the number of detections assigned to node c and topic t, excluding all detections in the current image i. ¬(i,d) Finally, Nc,. is the total number of detections assigned ¬i to node c, excluding the current detection (i, d), and Nc,. is the total number of detections assigned to node c excluding all detections in image i. In terms of these counts we can derive the following conditional distributions: ¬(i,d)
1 2 3 4 5 6 7 8 9 Figure 3. The taxonomy learned from 300 pictures (collections 14000, 144000, and 157000) from the Corel dataset. Top: the entire taxonomy shown as a tree (see also Figure 1). The area of each node is proportional to the number of images using that node. There are two main groups (A and B), which at the next level split into nine smaller subgroups (1 – 9). Each of these splits into very small groups of less than 10 images each at the last level; these are omitted from the figure for clarity. Below the tree, the top row of images (marked 1) shows the information represented in the leaf node 1. The first three pictures are the three images in that node to which the model assigns the highest probability. The next picture is a ‘quilt’ that shows schematically the image model learned at that node. Intuitively, it represents the node’s ‘understanding’ of what images look like (see Appendix for details). As can be seen, green-yellow hues are dominant in this node. Indeed, the images assigned to the node have green-yellow as dominant colors. Finally, on the right, either the single most prominent topic in that node is shown (if the probability of that topic in the node is above 80%), or (if the top topic takes up less than 80% of the probability mass), the two most probable topics are shown. Each topic is a distribution over words, and the display for each topic shows the visual words in the order of decreasing probability. First five words are shown. The images at the bottom represent the visual words. Each is divided into four quadrants (according to the number of spatial bins used). Three out of four quadrants are cross-hatched, while the quandrant that represents the correct spatial bin for the given word is filled with the corresponding color. The height of the vertical bar above each word is proportional to the frequency of the word in the current topic. The most popular topic indeed represents green-yellow colors. Rows 2–9 show information for the other leaves in a similar format. Nodes R, A, and B are shown in Figure 4.
where I[·] is the indicator function. The first two equations have obvious intuitive meaning. For example, eq. (2) consists of two terms. The first term ¬(i,d) is (up to a constant α) proportional to Nci,ℓi,d ,z . Here c = ci,ℓi,d is simply the category node to which the detection in question (namely, detection d in image i) is cur¬(i,d) is just the number of other rently assigned. Thus, Nc,z detections already assigned to topic z. The topics thus have a clustering property: the more detections are already in a topic, the more likely another detection is to be assigned to the same topic. The second term in eq. (2) is (again, up to the prior ǫ) the fraction which the current visual word (e. g. visual word 3 if wi,d = 3) takes in the topic z. This term encourages detections which are highly probable under topic z, and penalizes those which are improbable. Overall, eq. (2) is quite similar to the Gibbs sampling equation in starndard LDA [2, 15, 5]. The last equation (eq. (3)) is harder to understand, but it’s quite similar to the corresponding equation in NCRP [3]. The first term represents the prior probability of generating path c in the tree given all other paths for all other images according to the NCRP prior. Note that this prior is exchangeable: changing the order in which the paths were created does not change the total probability [3]. Therefore, we can assume that the current path is the last to be generated, which makes computing the first term efficient. The second term represents how likely the detections in image i are under the path c. A final detail in the inference is that the probability of a path for an image, p(ci,. = c|rest), is significantly affected by the level assignments of the detections in that image (i. e., by the values of li,. variables). The reason is that at early stages in sampling, multiple paths may contain essentially the same mixture of topics, but at different levels. These paths would have a high probability of merging if the image were allowed to re-assign its detections according to the distribution of topics in levels on each path. To improve convergence, we therefore perform several (20 in our experiments) sweeps of re-sampling ℓi,d for all detections in the current image before computing the second term in eq. (3). Note that this re-assignment of ℓ’s is tentative, used only to compute the likelihood. Once a path is sampled, the level assignments are restored to their original values. This sampling scheme works well in practice, but formally it violates properties of Gibbs sampling or MCMC (namely, the detailed balance property), and therefore convergence is
R
×
Y ℓ
t
Figure 4. Information shared at the top levels of the Corel taxonomy. Rows A and B represent corresponding intermediate nodes from Figure 3. Row R corresponds to the root. Each row shows the quilt image for the node (left), and then one or two most popular topics associated with the node. As can be seen, node A represents green-brownish hues. Indeed, these seem to be shared among the six child subgroups (rows 1–6 in Figure 3). Node B represents light blue colors in the top part of the image and darker blue in the bottom part. Indeed, its three subgroups (rows 7–9 in Figure 3) share these color distributions. Finally, the root represents mostly black, which is common to all images in the collection.
not guaranteed. To restore detailed balance, we only use the proposed sampling method to initialize the model. After a specified number of iterations (typically, 300), we revert to the proper Gibbs sampling scheme, which is guaranteed to converge to the correct posterior distribution.
4. Experiments In this section, we evaluate the proposed model experimentally.
4.1. Experiment I: Corel Color is easily perceived by human observers, making color-based taxonomies easy to analyze and interpret. Our first experiment is therefore a toy experiment based on color. Experiments on a more realistic dataset are reported below. A subset of 300 color images from the Corel dataset (collections 14000, 144000, and 157000, selected arbitrarily) was used. The images were rescaled to have 150 rows, preserving the aspect ratio. The visual words were pre-defined to represent images using ‘space-color histograms’. Two spatial bins in the horizontal and two bins in the vertical directions were used to coarsely represent the position of the word, and eight bins for each of the three color channels were used. This resulted in a total of 8 · 8 · 8 · 2 · 2 = 2048 visual words, where each word represents a particular color (quantized into 512 bins) in one out of four quadrants of the image. 500 pixels were sampled uniformly from each image and encoded using the space-color histograms. The proposed TAX model was then fitted to the data. We used four levels
for the taxonomy and 40 topics. The remaining parameters were set as follows: γ = 0.01, ε = 0.01, α = 1. These values were chosen manually, but in the future we plan to explore ways of setting the values automatically [4, 14]. Gibbs sampling was run for 300 iterations, where an iteration corresponds to resampling all variables once. The number 300 was selected by monitoring training set perplexity to determine convergence. The resulting taxonomy is shown in Figure 3. The main conclusions are that the images are combined into coherent groups at the leaves, and that the topics learned by the leaves represent colors that are dominant in the corresponding groups. Figure 4 shows information represented by the intermediate nodes of the taxonomy. This information is therefore shared by the subgroups at the bottom levels. The main conclusions are that each intermediate node learned to represent information shared by that node’s subgroups, and, conversely, that subdivisions into groups and subgroups arise based on sharing of common properties. To make it easier to visualize what is represented by the taxonomy, Figure 1 shows the same taxonomy as in Figure 3, but with quilt image shown at every level.
4.2. Experiment II: 13 scenes In this section we describe an experiment carried out on a more challenging dataset of 13 scene categories [5]. We used 100 examples per category to train a taxonomy model. The size of the images was roughly 250 × 350 pixels. From each image we extracted 500 patches of size 20×20 by sampling their location uniformly at random. This resulted in 650 000 patches from which 100 000 were randomly selected. For these 100 000 patches SIFT descriptors [12] were computed and clustered by running k-means for 100 iterations with 1000 clusters. The centroids of these 1000 clusters defined the visual words of our visual vocabulary. The 500 patches for each image (again, represented as SIFT descriptors) were subsequently assigned to the closest visual word in the vocabulary. The proposed TAX model was then fitted to the data by running Gibbs sampling for 300 iterations. We used four levels for the taxonomy and 40 topics. The remaining parameters were set as follows: γ = 100, ε = 0.01, α = 1. The taxonomy is shown in Figure 5. It is desirable to have a quantitative estimate of the quality of the learned taxonomy. In order to provide such a quantitative assessment, we used the taxonomy to define affinity between images, and used it to perform categorization. Categorization performance is reported below. The categorization was performed as follows. First, the taxonomy was trained in an unsupervised manner. Then, p(j|i), the probability of a new test image j given a training image i was computed. For this, the parameters pertaining to the
LDA TAX
Unsupervised – 58%
Supervised 64% [5] 68%
Table 1. Categorization performance on the 13 scenes dataset. Top row: LDA. Bottom: the proposed TAX model. Left column: unsupervised. Right column: supervised. Higher values indicate better performance. As can be seen, supervised TAX outperforms supervised LDA (see section 6 for discussion).
training image i were estimated as follows: ǫ + Nt,w α + Ni,ℓ,t φ¯t,w = ,π ¯i,l,t = ǫW + Nt,. αT + Ni,ℓ
(4)
The first expression estimates the means of the corresponding model parameters φt . The second expression is the estimate of the distribution over topics, πc , at level l in the path for image i, using only the detections in image i. In terms of these expressions, p(j|i) can be computed as follows: YX p(j|i) = φ¯t,wj,d π ¯i,ℓ,t (5) d
ℓ,t
The product is over all detections d in the test image j, and the sum is over ℓ and t, all possible level and topic assignments for each detection. We used these probabilities to determine similarity between a test image and all training images. Seven training images most similar to a test image were retrieved, and majority vote was used among these seven images to categorize the test image. Using this method, the categorization was correct 58% of the time (chance performance would be about 8%). For comparison, 64% average performance was obtained in [5] using a supervised LDA model, which is also based on the bag-of-words representation. Notice that the method in [5] uses supervision to train the model. Adding supervision to the proposed TAX model is trivial: in Gibbs sampling, we simply disallow images of different classes to be in the same path. With this modification, a supervised taxonomy is produced, which achieves 68% correct recognition (again, compare to 64% correct in [5]). These results are summarized in Table 1. The current state-of-the-art is 81% [11] on an extension of the 13 scenes dataset, using a representation much more powerful than bag-of-words.
5. Related work NCRP was introduced in [3], but never applied to visual data. In computer vision literature, mostly supervised taxonomies were studied [6, 5, 18]. In addition, in [6] the taxonomy was constructed manually, while in [5, 18] the taxonomy was never used for image representation or categorization. In contrast, TAX represents images hierarchically, and we show that this representation improves categorization performance.
A Figure 5. Unsupervised taxonomy learned on the 13 scenes data set. Top: the entire taxonomy shown as a tree. Each category is color-coded according to the legend on the right. The proportion of a given color in a node corresponds to the proportion of images of the corresponding category. Note that this category information was not used when inferring the taxonomy. There are three large groups, marked A, B, and C. Roughly, group C contains natural scenes, such as forest and mountains. Group A contains cluttered man-made scenes, such as tall buildings and city scenes. Group B contains man-made scenes that are less cluttered, such as highways. These groups split into finer sub-groups at the third level. Each of the third-level groups splits into several tens of fourth-level subgroups, typically with 10 or less images in each. These are omitted from the figure for clarity. Below the tree, the top row shows the information represented in leaf 1 (the leftmost leaf). Two categories most frequent in that node were selected, and two most probable images from each category are shown. The most probable topic in the node is also displayed. For that topic, six most probable visual words are shown. The display for each visual word has two parts. First, in the top left corner the pixel-wise average of all image patches assigned to that visual word is shown. It gives a rough idea of the overall structure of the visual word. For example, in the topic for leaf 1, the visual words seem to represent vertical edges. Second, six patches assigned to that visual word were selected at random. These are shown at the bottom of each visual word, on a 2 × 3 grid. Next, information for node 2 is shown in a similar format. Finally, the bottom row shows the top two topics from node A, which is shared between leaves 1 and 2. Both leaves have clutter (topic 1) and horizontal bars (topic 2), and these are represented at the shared node.
In [1], a taxonomy of object parts was learned. In contrast, we learn a taxonomy of object categories. Finally, the original NCRP model was independently applied to image data in a concurrent publication [16]. The differences between TAX and NCRP are summarized in section 2. In addition, [16] uses different sets of visual words at different levels of the taxonomy. This encourages the taxonomy to learn different representations at different levels. The disadvantage is that the sets had to be manually
defined, and without this NCRP performed poorly. In contrast, in TAX the same set of visual words is used throughout the taxonomy, and different representations at different levels emerge completely automatically.
6. Discussion We presented TAX, a nonparametric probabilistic model for learning visual taxonomies. In the context of computer
vision, it is the first fully unsupervised model that can organize images into a hierarchy of categories. Our experiments in section 4.1 show that an intuitive hierarchical representation emerges which groups the images into intuitively related subsets. In section 4.2, a comparison of a supervised version of TAX with a supervised LDA model is presented. The two models are very similar overall; in particular, both use bag-of-words image representation, both learn a set of topics, etc. The fact that supervised TAX outperforms supervised LDA therefore suggests that a hierarchical organization better fits the natural structure of image patches and provides a better overall representation, compared to a flat, unstructured organization. Below, we discuss a few limitations of our current implementation and directions for future research. One of the main limitations of TAX is the speed of training. For example, with 1300 training images, learning took about 24 hours. Our ultimate goal is to learn taxonomies for thousands of categories based on millions of images. To achieve learning models on that scale we clearly need significant progress in computational efficiency. Variational methods [10] appear promising to achieve this speedup. Another challenge is the many local modes that are expected to be present in the posterior distribution. Once the Gibbs sampler is trapped into one of these modes it is unlikely to mix out of it. Many modes may represent reasonable taxonomies, but it would clearly be preferable to introduce large moves in the sampler that could merge or split branches in search of better taxonomies [9, 13].
A. Computing the ‘quilt’ image Recall that each node represents a distribution over topics, and each topic is itself a distribution over words. The quilt represents this pictorially, and is generated from the generative model learned at that node. We start with a crosshatched image. A topic is sampled from the node-specific topic distribution. Then a word is sampled from that topic. This process is repeated 1000 times, to obtain 1000 word samples. Recall that a word represents a particular spatial bin and a particular color. So next, for every word a location in the corresponding spatial bin of the ‘quilt’ is sampled uniformly at random. That location is then painted with the corresponding color (in practice, a 5 × 5 pixels patch is painted to make colors more visible). The initial quilt is filled with cross-hatched pattern, rather than with a uniform color, to distinguish areas that were filled with some color from areas that weren’t filled at all. The quilt basically shows what the model ‘thinks’ images look like.
Acknowledgments This material is based upon work supported by the National Science Foundation under Grants No. 0447903,
No. 0535278 and IIS-0535292, and by ONR MURI grant 00014-06-1-0734.
References [1] N. Ahuja and S. Todorovic. Learning the taxonomy and models of categories present in arbitrary images. In ICCV, 2007. 7 [2] D. Blei, A. Ng, and M. Jordan. Latent dirichlet allocation. J. Machine Learning Research, 3:993–1022, 2003. 2, 5 [3] D. M. Blei, T. L. Griffiths, M. I. Jordan, and J. B. Tenenbaum. Hierarchical topic models and the nested chinese restaurant process. In NIPS, 2004. 2, 3, 5, 6 [4] M. D. Escobar and M. West. Bayesian density estimation and inference using mixtures. Journal of the American Statistical Association, 90(430):577–588, 1995. 6 [5] L. Fei-Fei and P. Perona. A bayesian hierarchical model for learning natural scene categories. In CVPR, 2005. 2, 5, 6 [6] S. Gangaputra and D. Geman. A design principle for coarseto-fine classification. In CVPR, 2006. 6 [7] K. Grauman and T. Darrell. The pyramid match kernel: Discriminative classification with sets of image features. In ICCV, pages 1458–1465, 2005. 1 [8] G. Griffin, A. Holub, and P. Perona. Caltech-256 object category dataset. Technical Report 7694, California Institute of Technology, 2007. 1 [9] S. Jain and R. Neal. A split-merge markov chain monte carlo procedure for the dirichlet process mixture model. Journal of Computational and Graphical Statistics, 2000. 8 [10] K. Kurihara, M. Welling, and N. Vlassis. Accelerated variational dp mixture models. In NIPS, 2006. 8 [11] S. Lazebnik, C. Schmid, and J. Ponce. Beyond bags of features: Spatial pyramid matching for recognizing natural scene categories. In CVPR, 2006. 1, 6 [12] D. G. Lowe. Distinctive image features from scale-invariant keypoints. IJCV, 60(2):91–110, 2004. 6 [13] E. Meeds. Nonparametric Bayesian methods for extracting structure from data. PhD thesis, University of Toronto, 2008. 8 [14] T. P. Minka. Estimating a Dirichlet distribution. Technical report, MSR, 2000. 6 [15] J. Sivic, B. C. Russell, A. A. Efros, A. Zisserman, and W. T. Freeman. Discovering object categories in image collections. Technical Report AIM-2005-005, MIT, February 2005. 2, 5 [16] J. Sivic, B. C. Russell, A. Zisserman, W. T. Freeman, and A. A. Efros. Unsupervised discovery of visual object class hierarchies. In CVPR, 2008. 7 [17] A. Torralba, K. P. Murphy, and W. T. Freeman. Shared features for multiclass object detection. In Toward CategoryLevel Object Recognition, pages 345–361, 2006. 2 [18] G. Wang, Y. Zhang, and L. Fei-Fei. Using dependent regions for object categorization in a generative framework. In CVPR, 2006. 6