Dec 17, 2014 - A Gaussian process (GP) prior is often selected for the model discrepancy ... calibrate the simulator to experimental data, and upscale the joint ...
Upscaling Uncertainty with Dynamic Discrepancy for a Multi-scale Carbon Capture System K. Sham Bhat, David S. Mebane, Curtis B. Storlie, and Priyadarshi Mahapatra
arXiv:1411.2578v2 [stat.ME] 17 Dec 2014
Abstract Uncertainties from model parameters and model discrepancy from small-scale models impact the accuracy and reliability of predictions of large-scale systems. Inadequate representation of these uncertainties may result in inaccurate and overconfident predictions during scale-up to larger models. Hence multiscale modeling efforts must quantify the effect of the propagation of uncertainties during upscaling. Using a Bayesian approach, we calibrate a small-scale solid sorbent model to Thermogravimetric (TGA) data on a functional profile using chemistry-based priors. Crucial to this effort is the representation of model discrepancy, which uses a Bayesian Smoothing Splines (BSSANOVA) framework. We use an intrusive uncertainty quantification (UQ) approach by including the discrepancy function within the chemical rate expressions; resulting in a set of stochastic differential equations. Such an approach allows for easily propagating uncertainty by propagating the joint model parameter and discrepancy posterior into the larger-scale system of rate expressions. The broad UQ framework presented here may have far-reaching impact into virtually all areas of science where multiscale modeling is used.
Keywords: extrapolation, propagation of uncertainty, computer model calibration, Bayesian hierarchical modeling, BSS-ANOVA, functional data. Short Title: Upscaling Uncertainty for a Carbon Capture System
1
Introduction
The Carbon Capture Simulation Initiative (CCSI) sponsored by the U.S. Department of Energy is focused on accelerating the adoption of new carbon capture technology using modeling and simulation to reduce the amount of physical testing required for development of larger-scale power plants. This effort increases the reliance on computer models for upscaling. These carbon capture systems involve phenomena at the quantum scale up through to the industrial macroscale which are analyzed using complex computer models. The multi-scale uncertainty quantification effort in this article is illustrated on a simple carbon capture process for a “bubbling fluidized bed” absorber (Lee and Miller, 2012), which is built using Aspen Custom Modeler (Aspen, 2011). The major driver of the uncertainty in the system is the chemical sorbent model, characterized by one (or more) chemical reactions, dependent on several chemical parameters which describe the equilibrium and kinetic facets of the reactions. In addition, there are certain system conditions (or physical inputs e.g. 1
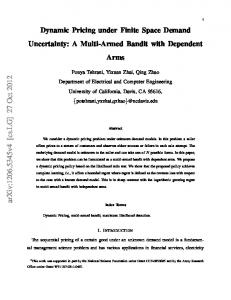
Figure 1: Functional input (temperature) in green, functional output (sorbent weight gain) in blue. 10
385
350
5
Temperature (K)
% weight increase
370
330 % weight increase Temperature 0
0
5,000 5000
10,000
15,000
20,000
25,000 Time (s)
30,000
35,000
40,000
45,000
310 50,000
temperature and partial pressure) that affect the behavior of the system. The small-scale model takes in temperature and pressure inputs (describing possible system conditions) and a set of chemistry model parameters and outputs the sorbent weight gain; experimental data are collected using Thermogravimetric Analysis (TGA) with the same inputs and outputs. In Figure 1, an input (temperature) and output (sorbent weight gain) from the small-scale sorbent model are shown; note that both the inputs and outputs to the model are functional (in time). Both the small-scale sorbent model, isolated to only a chemical reaction with no fluid dynamics (small-scale), and the fully coupled model for a process system (large-scale) are governed by the solution of one or more rate-based differential equations. Complex computer models are widely used by scientists and engineers to understand and predict the behavior of complex physical processes (e.g., climate change, nuclear reactor performance, fluid transport, and carbon capture systems) when direct experimentation is difficult, expensive, or impossible. While these computer models are often grounded in scientific theory, they will still have various forms of uncertainty that must be accounted for when used to predict the behavior of the physical process. These uncertainties may come from many sources; for example, incomplete information about physical constants and/or inadequate quantitative models to describe the physical behavior. Hence, uncertainty quantification (UQ) is widely recognized as essential to analysis of complex computer models. (Higdon et al., 2008; Kennedy and O’Hagan, 2001; Oakley and O’Hagan, 2004; Storlie et al., 2009). Many of these uncertainties arise in a multi-scale system context, and uncertainties at a small scale may greatly impact the accuracy and reliability of large system predictions. Therefore, it is crucial that this small-scale uncertainty be appropriately represented. Two major sources of uncertainty in predictions from computer models are parameter uncertainty and model form discrepancy; statistical calibration of the model to experimental (or field) data provides a means to formally quantify these uncertainties. Kennedy and O’Hagan (2001) developed a framework for calibration of computer models, which includes a 2
model discrepancy term describing the deviation from the model to reality. Failure to properly account for model discrepancy can lead to overfitting of the model parameters (Bayarri et al., 2007), and hence inaccurate predictions. Constructing the model form discrepancy using expert scientific knowledge about how the model does not to conform to reality will improve inference and resulting model predictions (Brynjarsd´ottir and OHagan, 2012) as well as confounding issues between the parameters and discrepancy (Liu et al., 2009). Furthermore, such an approach provides a theoretical or empirical representation of how the model is flawed, which could be useful for how to improve the model. In this paper, we propose an efficient means to propagate forward the uncertainty in model form discrepancy, along with parameter uncertainty, resulting from model calibration at small scale, when making predictions at scale. Upscaling uncertainty for a multi-scale system via forward propagation of both the model parameter and discrepancy sources of uncertainty presents a major challenge. Many current approaches for forward uncertainty propagation to a new system (e.g. large scale) include only the uncertainty from the calibrated model parameters. This may be problematic since the calibrated model output, even at the “true” parameters, may not be an accurate representation of the system as it ignores the effect of model form discrepancy. The typical approach to include model discrepancy is to use a fully non-intrusive “black-box” approach for calibration, i.e. obtain a joint distribution of the model parameters and discrepancy, and propagate that distribution to the large-scale system. However, this approach is not always feasible in practice. The estimated model discrepancy at small-scale may not be relevant to that at large scale. For instance, often the inputs and even the quantity of interest are not comparable from the calibration data to prediction. We propose a novel approach to describe the dynamic discrepancy between the small-scale model and reality, which has a clear scientific interpretation about the model failings and is efficient for both calibration and upscaling. Our approach uses an intrusive uncertainty quantification (UQ) approach by including the stochastic discrepancy function within the small-scale sorbent model equations, resulting in a stochastic differential equation(s) (SDE). In addition, the discrepancy terms may interpreted as a ”correction” for a specific physical or chemical deficiency in the small-scale sorbent model (e.g. deviation from the ideal gas assumption). Model form discrepancy here is represented using a Gaussian Process with a Bayesian Smoothing Spline (BSS)-ANOVA covariance. The BSS-ANOVA framework has many advantages within this context; it provides an approximate parametric form which is very convenient for both calibration and upscaling, accounts for the uncertainty due to extrapolation while upscaling, and provides substantial computational gains requiring only
3
O(N ) computational time by eschewing matrix inversions. Using a Bayesian approach, we calibrate the small-scale sorbent model to data; resulting in a joint sample-based distribution of both model parameters and discrepancy basis function coefficients. The uncertainty in model parameters and discrepancy are then easily propagated to scale by passing these posterior samples into the large-scale system of rate expressions and solving them in a Monte Carlo fashion. The output from the large-scale system provides both a quantity of interest (such as the proportion of CO2 captured) as well as a functional profile of the system conditions (which may also be seen as inputs to the small-scale sorbent model). To the best of our knowledge, there is not an uncertainty quantification approach which simultaneously incorporates a stochastic discrepancy in a calibration framework with functional inputs and forward propagates both parameter and model form uncertainty across scales in an efficient manner. The rest of this paper is organized as follows. In Section 2, we give a broad overview of our framework to upscale uncertainty with dynamic discrepancy, and we discuss the details of our calibration, dynamic discrepancy, and upscaling approach in Section 3. We demonstrate our methodology on a small carbon capture system with a chemical kinetics sorbent model in Section 4. Finally, we conclude with a discussion, caveats, and avenues for future research in Section 5.
2
Uncertainty Quantification for a Multi-scale System
This section contains a broad overview of our approach to upscaling uncertainty in a multiscale system. The goal is to quantify uncertainty of a large-scale system, with many smallscale physical processes embedded in it; where the behavior of both the large-scale system and the small-scale processes are simulated with deterministic computer models. In this paper a single small-scale model is used for the ease of demonstration. The small-scale sorbent model and the large-scale carbon capture process system are discussed in Section 2.1 and 2.2, respectively. In Section 2.3, we provide an overview of the proposed Bayesian dynamic discrepancy approach used for UQ analysis, which has several advantages in this particular framework; incorporation of functional inputs, convenience in propagating information across scales, and the inclusion of a dynamic discrepancy function to describe shortcomings of the model.
4
Table 1: Summary of Inputs, Outputs, and small-scale sorbent parameters. Experimental Outputs and State Variables (a function of time) y: y : Weight fraction of sorbent. w. Functional Input Profile (potential system conditions) ζ(t): ζ 1 : Temperature T ∈ [310, 380] K ζ 2 : Partial pressure of CO2 , p ∈ [0, 100]% Sorbent Model Parameters θ: θ1 : Reaction Enthaply ∆H ∈ [−120, −30] kJ/mol θ2 : Reaction Entropy ∆S ∈ [−450, −200] J/mol-K θ3 : Activation Energy (kinetic) ∆H ‡ ∈ [−150, −50] kJ/mol θ4 : Kinetic entropy plus other parameters γ ∈ [0, 10] θ5 : Amine site density nv ∈ [1000, 2351] mol/m3
2.1
Basic Chemical Kinetics Model
The basic chemistry model describes the adsorption of CO2 by a solid Amine based sorbent. It was determined in the course of an ab initio study documented in reference (Mebane et al., 2013) that this adsorption of CO2 takes place through the formation of carbamic acid according to the reaction: 2R2 NH + CO2 (g) R2 NCOOH : R2 NH
(1)
A summary of the inputs and outputs may be found in Table 1. There are five model parameters to be estimated: θ = [∆H, ∆S, ∆H ‡ , γ, nv ]. The equilibrium parameters are ∆H, ∆S and nv and the kinetic parameters are ∆H ‡ and γ. The rate equations of this sorbent model in Equation (2) are solved on a temporal grid; potential system conditions, temperature (T ) and partial pressure (p) of CO2 , are functional inputs over time (see Figure 1 for an example temperature input), resulting in a functional response w(t) (the weight increase of the sorbent). � � ∂x = k (1 − 2x)2 p − x2 /κ ∂t w = M nv x/ρ κE = exp (∆S/R) exp (−∆H/RT )/P κK = γT exp (−∆H ‡ /RT )
5
(2)
The response w(t) is a multiple of the chemical state x, or the fraction of amine sites occupied by carbamic acid. Additional constants within the model are M is the molar weight of CO2 , ρ is the sorbent density, R is the ideal gas constant, and P is the total pressure. The equilibrium constant κE is a function of ∆S and ∆H, while the reaction rate constant κK is a function of γ and ∆H ‡ . As can be seen from Figure 1, as temperature decreases there is an increase in sorbent uptake of CO2 resulting is an increase in the weight of the sorbent. Similarly, as pressure increases, there is an an increase in sorbent uptake of CO2 and in the weight of the sorbent. The experimental apparatus used to obtain the data here requires that the partial pressure remain constant over time, so the functional pressure input is a constant line in these data. However, several time series observations are collected at different (constant over time) partial pressures.
2.2
Overview of Large-Scale Model
The coupled large-scale system is introduced here with a single quantity of interest x; this framework may be easily extended to the multivariate case. The system conditions are ζ(t) = [ζ1 (t), . . . , ζq (t)], where ζi (t) represents the curve for the ith condition at time t. The function space for these system conditions is very large as it must include any physically feasible curve. Figure 2: Process model for simple carbon cap- A general rate equation describing the smallscale model is provided below in Equation ture system. (3) for convenience, where x represents a state variable and fs (x, ζ(t); θ) is the chemical rate function. ∂x = fs (x, ζ(t); θ) ∂t
(3)
A simple carbon capture process model is shown in Figure 2. The large-scale system may be generally expressed as a set of differential equations below in Equations (4)-(6);
!
6
these equations are solved on a one-dimensional spatial grid (denoted by the variable z). ∂x = fs (x, ζ(t); θ) ∂z g1 (x, ζ(z); θ) = 0 .. .
(4) (5)
gq (x, ζ(z); θ) = 0;
(6)
The outputs from the large-scale system are functional curves (as a function of z) of the quantity of interest x and the system conditions ζ. For direct comparison with the inputs and outputs to the small-scale sorbent model, it is convenient to represent these functional curves as a function of time, which is accomplished using a conversion along the flow-velocity field. The details of this conversion are provided in the Supplementary Material.
2.3
Framework for Upscaling Uncertainty Figure 3: Overview of the upscaling process. Prior Distribution
θ1
θp
A road map for the upscaling methodology is provided here. As
δ (ζ )
shown in the top half of Figure 3, the small-scale model is Functional Inputs
Functional Response
calibrated to experimental data
Z ,w
(see Section 3). The small-scale
Experimental Data & Small Scale Model
ζ (t)
model inputs and outputs are Posterior Distribution
θ1
θp
Ω(θ , δ)
functional in nature and experi-
δ (ζ )
mental data observations are usually only available at a handful of different profiles. Thus, the func-
Large Scale System
tional input space will typically be only sparsely covered by the
Π(ζ) System Conditions and Response Condition 1
Condition k
Response
Distribution for Outputs of Interest
Output 1
Output m
experimental design. When the results from the small-scale calibration are upscaled, the system conditions experienced at scale
may be far different that those from the small-scale experiments. Thus, it may become important to limit the amount this extrapolation to the extent possible. A Bayesian calibration approach following the Kennedy-O’Hagan framework (Kennedy and O’Hagan, 2001) is
7
employed to calibrate the small-scale model to data (see Section 3) with prior distributions (using domain expertise and previous results whenever possible) on the uncertain model parameters and a prior form on the discrepancy (usually a Gaussian Process (GP)). It is infeasible to use the conventional approach to model discrepancy for forward propagation, in this case, due to the functional inputs and an entirely different fully coupled system at large scale. Therefore, we introduce a dynamic discrepancy approach in Section 3.2 where the discrepancy is embedded within the rate equations (i.e. Equation (3)) of the small-scale model. The end result from calibration is a joint sample-based distribution representing the model parameters and the discrepancy; which is then propagated to the large-scale system, as seen in the bottom half of Figure 3. For each sample, the large-scale system model simultaneously solves for the rate equations (e.g. Equations (4)-(6)) describing the system response and system conditions at each time step, resulting in functional curves for both the system conditions and response. The collection of these solutions (from the samplebased distribution) provide a set of probabilistic predictions of the system conditions and response, while incorporating uncertainty. Aggregated output quantities of interest (such as % CO2 captured by the system) may then be then derived from the response, resulting in probabilistic predictions characterizing the uncertainty of the output quantities of interest.
3 3.1
Calibration with Dynamic Discrepancy Computer Model Calibration for Functional Data
Computer model calibration is often used to constrain the computer model to be consistent with experimental data. Hence, the primary goal of calibration is to find a set of model parameter values that best reproduce the reality of experimental (or field) data. In the traditional computer model calibration (i.e., inverse problem) setup (Kennedy and O’Hagan, 2001), an output y from the physical system is observed (with observational error) at several (N ) locations of a “controllable” vector of inputs ζ = [ζ1 , . . . , ζq ]. This physical reality can be approximated by a simulator (i.e., a computer model), η(ζ, θ), where θ = [θ1 , . . . , θP ] is a vector of model parameters. If fixed at an appropriate (unknown) value of θ = θ ∗ , then η(ζ, θ) will approximate the reality at ζ. Our framework also includes a model form discrepancy function δ that admits the possibility of model bias (from reality). Therefore a general model for the experimental data is
8
Yn = ρη(ζ n , θ ∗ ) + δ(ζ n ) + �n ,
(7)
n = 1, . . . , N , where Yn , ζ n , �n are the model output, inputs, and observation error for the n-th observation, respectively, and ρ is a regression parameter, representing multiplicative bias. Due to identifiability issues, ρ =1 will be assumed here. The goal is to estimate θ ∗ (which for ease of notation we refer to as θ from now on) and the discrepancy function δ. This is typically done within a Bayesian framework (Higdon et al., 2004), where a prior distribution is placed on θ and δ and then updated by conditioning on the experimental data. A Gaussian process (GP) prior is often selected for the model discrepancy δ (Kennedy and O’Hagan, 2001), which we will discuss in more detail in the next section. For the work in this paper, both the inputs ζ n and the output Yn are functional in nature. For ease of exposition, the domain of the functional input/output space consists of a single variable, time. This framework can be easily extended when the domain is multivariate. Hence the inputs are written as ζ n (t) = [ζn1 (t), . . . , ζnq (t)], i.e. ζ ni represents the entire input curve for the ith input and n-th observation. In practice, t = [t1 · · · tTn∗ ], is discretized over time. The output functional curve(s) is expressed as Yn (t), t ∈ [0, tTn∗ ], The simulator output at model parameters θ, inputs ζ n , and time t can be expressed as η(t; ζ n , θ). The calibration framework can now be written below: Yn (t) = η(t; ζ n , θ) + δ(t; ζ n ) + �n (t), t ∈ [0, Tn∗ ]
(8)
It should be noted that in general η n (t) and δ n (t) are dependent on the entire input curves ζ n , not just the inputs at time t. The observation error, represented by �(t), is assumed to be a white noise process with variance σ 2 . Independence is assumed a priori between δ, η, and � are assumed.
3.2
Dynamic Discrepancy
Model discrepancy is considered here in the context of propagation of uncertainty while including the effect of upstream model shortfall in a large-scale system, i.e., not merely for model parameter inference. For this effort, the discrepancy must incorporate scientific understanding of the deficiencies of the model as well as flexibility to be applicable for a wide range of functional responses and account for extrapolation. Due to the functional nature of the inputs, discrepancy function δ(t; ζ) is a function of the entire input curve ζ. The immediate approach would be to construct an appropriate discrepancy function, calibrate the simulator to experimental data, and upscale the joint posterior distribution
9
π(θ, δ) to the large-scale system. Bhat et al. (2012) developed such an approach; a smallscale sorbent model was calibrated to data using the framework in Equation (8). The model discrepancy represents deficiencies in the sorbent model for both equilibrium and kinetic behavior. The development of this discrepancy assumed a concurrent functional model (see Ramsay, 2006, pp. 280-293) to deal with the functional nature of the input/output, which was overly simplistic. The joint posterior π(θ, δ) was then upscaled by differentiating the posterior realizations of δ w.r.t time, smoothed, and included in the rate equations of the large-scale process model (see Equations (4)-(6)). However, the differentiated posterior discrepancy realizations were very noisy and required heavy smoothing to avoid solver failures. We now present a novel alternative approach that alleviates the issues mentioned above. The main idea is to include the discrepancy δ within the rate equation of the small-scale model in Equation (3) as shown below in Equation (9). We refer to this δ as a dynamic discrepancy since it allows the dynamic system to change its path depending on the value of δ. Note here that
∂x ∂t
is directly a function of ζ(t), and not the entire curve ζ. Implementing
the discrepancy in the rate equation allows us to naturally use a concurrent functional model, and sidestepping the complications with including the entire functional input. ∂x = fs (x, θ, ζ(t)) + δ(x, ζ(t); β), ∂t
(9)
As a GP prior is usually placed on δ, and Equation (9) is a stochastic differential equation (SDE). If δ were a traditional GP then, even for a fixed θ and β (denoting the hyperparameters of the GP), Equation (9) would result in an SDE. To avoid these complications, we use a BSS-ANOVA GP (which is discussed in more detail in Section 3.3) prior on δ, which among other things, has the advantage of admitting a convenient, approximate parametric form, thus containing its entire stochasticity in its parameters β. In other words, when β is fixed, δ is entirely specified, and the SDE in Equation (9) becomes an ODE. In a Bayesian calibration framework, the SDE can be easily integrated within the MCMC routine as follows: at each iteration we propose a set of model and discrepancy parameters, obtain a solution of the state variable(s) from the ODE, evaluate the likelihood, and accept/reject the sample. This framework provides an avenue to estimate the joint posterior distribution π(θ, δ) of model parameters and discrepancy, and allows for the forward propagation of uncertainty in the usual sample based manner. Furthermore, such an approach is generalizable to a broad class of problems.
10
3.3
BSS-ANOVA Model
The discrepancy function δ is formulated using the BSS-ANOVA GP model (Reich et al., 2009); utilizing a covariance function that directly uses the functional components from a functional ANOVA decomposition (Gu, 2002). This approach has two very useful properties in the context of upscaling uncertainty: (i) it provides a convenient parametric form which allows to reduce the SDE in Equation (9) to a ODE providing for easy calibration and uncertainty propagation, and (ii) improves computational efficiency substantially, scaling linearly with the number of data points, as opposed to O(N 3 ) for a traditional GP. In this section we detail the facets of the BSS-ANOVA model necessary to formulate the discrepancy, and further details about the BSS-ANOVA model may be found in the Supplementary Material. We again denote the inputs to the computer model as ζ with dimension P . The discrepancy may then be represented as: δ(ζ) = β0 +
R X
δ r (ζr ) +
R X
δ r,r0 (ζr , ζr0 ) + · · ·
(10)
r