The International Archives of the Photogrammetry, Remote Sensing and Spatial Information Sciences, Volume XL-8, 2014 ISPRS Technical Commission VIII Symposium, 09 – 12 December 2014, Hyderabad, India
URBAN MAPPING AND GROWTH PREDICTION USING REMOTE SENSING AND GIS TECHNIQUES, PUNE, INDIA Sivakumar V. Spatial Sciences and Disaster Management Group, C-DAC, Pune, India,
[email protected]
ISPRS Technical Commission VIII Symposium, Operational RS Applications: Opportunities, Progress and Challenges
KEY WORDS: Remote Sensing, GIS, land use, Markov Chain model, Urban
ABSTRACT: This study aims to map the urban area in and around Pune region between the year 1991 and 2010, and predict its probable future growth using remote sensing and GIS techniques. The Landsat TM and ETM+ satellite images of 1991, 2001 and 2010 were used for analyzing urban land use class. Urban class was extracted / mapped using supervised classification technique with maximum likelihood classifier. The accuracy assessment was carried out for classified maps. The achieved overall accuracy and Kappa statistics were 86.33% & 0.76 respectively. Transition probability matrix and area change were obtained using different classified images. A plug-in was developed in QGIS software (open source) based on Markov Chain model algorithm for predicting probable urban growth for the future year 2021. Based on available data set, the result shows that urban area is expected to grow much higher in the year 2021 when compared to 2010. This study provides an insight into understanding of urban growth and aids in subsequent infrastructure planning, management and decision-making.
1.
INTRODUCTION
The land use change in urban area is a composite process. Several factors influence this process, including both physical aspects and human aspects. Accelerated urban expansion is usually associated with the social-economic factors. For substantial development, municipal authorities need tools to monitor how the land is currently used and assess future demand. the understanding of urban land change is important for decision makers and planners. Recent years, urbanization is a major trend in big cities all around the world. The main change of land use in these areas can be described as other type of land use converting into urban land. Unfortunately, the conventional survey and mapping techniques are expensive and time consuming for the estimation of urban expansion and such information is not available for most of the urban centres, especially in developing countries. As a result, increased research interest is being directed to the monitoring of urban growth using GIS and remote sensing techniques. Remote sensing is increasingly used for identifying and analysis of urban expansion since it is cost effective and technologically efficient. In recent years, these methods have progressed and have been widely used in management of natural resource and urban planning. In this paper, plateau region of Pune City as a case study to understand the urban dynamic. Remotely sensed satellite data (Landsat TM and Landsat ETM images) of three years (1991, 2001 and 2010) were used for mapping land use/land cover change from 1991 to 2010 (Three periods:1991-2001,20012010, 1991-2010) and to predicted the phases of urban expansion in Pune. 2. STUDY AREA Pune district is in the western region of Maharashtra, India. It lies in the Western Ghats or Sahyadri mountain range and it extends on to the Deccan Plateau on the east. Pune is at an
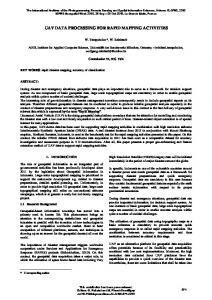
altitude of 559 m (1863 ft.) from sea level. Pimpri-Chinchwad is located at the West of Pune city, touching the Pune- Mumbai National highway. The corporation covers the area of Nigdi, Akurdi, Pimpri-Chinchwad and Bhosari. Pune city lies near the convergence point of rivers Mula and Mutha. The northwestern outskirt of Pune’s urban area serves as the crossway for two other rivers, namely Pavana and Indrayani. The southern boundary of the urban area is formed by the Simhagad-KatrajDive ghat range. The whole administrative area is governed by Pune Municipal Corporation (PMC) and Pimpri-Chinchawad Municipal Corporation (PCMC). This paper mainly focuses on the region of Pune district that lies between 18d 22'26.7042"N to 18d49'08.7726"N latitude and 73d34'26.9177"E to 74d04'11.6946"E longitude. 3. MATERIAL AND METHODS The images were obtained from usgs (earthexplorer.usgs.gov) for the year 1991, 2001 and 2010 for February, March, July and November, respectively. Satellite data of equivalent season (date) for the different year interval images could not obtained due to cloud cover. The satellite images obtained are as shown in Figure. 1, 2 and 3. Table 1 shows the details of the images used. Fist, all required satellite images were downloaded and stacked. The extents upper left: 73d34'26.9177"E Longitude 18d49'08.7726"N Latitude and lower right: 74d04'11.6946"E Longitude 18d22'26.7042"N Latitude used for clipping study area and clipped all the images. Different time series images were classified using ssupervised classification with maximum likelihood classifier algorithm. The obtained classified results used for analysing and predicting land use and land cover. The software used for this purpose was PCI Geomatica. The classes which were considered for classification are no-vegetation cover, urban with vegetation, healthy vegetation, sparse vegetation, lakes and river. We aggregated the number of classes in to four categories: urban,
This contribution has been peer-reviewed. doi:10.5194/isprsarchives-XL-8-967-2014
967
The International Archives of the Photogrammetry, Remote Sensing and Spatial Information Sciences, Volume XL-8, 2014 ISPRS Technical Commission VIII Symposium, 09 – 12 December 2014, Hyderabad, India
water body, No-Vegetation cover and vegetation. Detailed methodology is given in the Figure 4.
Satellite Data
Spatial Resolution (m)
Landsat 5 TM Landsat 7 ETM+ Landsat 5 TM
30 30
Date of Acquired Data 01/02/1991 24/03/2001
inter-annotator agreement for qualitative (categorical) items or in simple words it states how much the classified map diverges from reality. Using Molusce tool which is a plugin in Quantum GIS, Land use transition matrix was obtained to understand the changes (Table 4, 5 and 6). The land use and land cover changes were predicted for the year 2021 by using arithmetic progression. The Table 7 shows the classes and the area covered by them for the year 1991, 2001, 2010 and 2021.
30 25/03/2010 Table 1. Satellite images
Figure.3. Standard FCC image of year 2010 Figure.1. Standard FCC image of year 1991
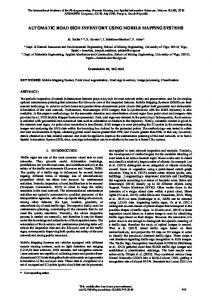
Figure.2. Standard FCC image of year 2001 Figure 4. Methodology of the study After performing supervised classification, obtained the classification report for all the three images and is as shown in Table 2. 4. RESULT AND ANALYSIS Figure 5, 6 and 7 shows classified output of 1991, 2001 and 2010 time periods data. Land use land cover area statistical information and classification accuracy assessment is shown in the table 2 and 3 respectively. Kappa statistic or Kappa coefficient is a statistical measure of inter-rater agreement or
The urban area is increasing and vegetation is decreasing and no-vegetation cover is increasing this study area. *The change in vegetation and no-vegetation cover is difficult to map, predict and conclude the causes for the changes due to temporal and spatial resolutions of satellite data. However, this present effort is not paying much attention on other then urban class.
This contribution has been peer-reviewed. doi:10.5194/isprsarchives-XL-8-967-2014
968
The International Archives of the Photogrammetry, Remote Sensing and Spatial Information Sciences, Volume XL-8, 2014 ISPRS Technical Commission VIII Symposium, 09 – 12 December 2014, Hyderabad, India
Land Cover Class
Year 1991
Year 2001
Year 2010
Urban
42.15
133.41
271.04
Water Body
25.55
26.60
38.33
1131.44
1173.38
1241.97
1333.67
1204.06
994.42
45.35
40.72
32.40
No-vegetation cover Vegetation Null Total
Fig.4. Classified Map of year 1991(barren land = novegetation cover)
2578.18 2578.18 Table 2. Classification report
2578.18
Year 1991
Year 2010
Year 2010
Overall Accuracy
85.00%
86.00%
88.00%
Kappa Statistic
0.718
0.751
0.806
Table 3. Classification accuracy assessment 1991 2001 Null Urban Water Body Vegetation No Vegetation cover
Null
Urban
Water Body
Vegetation
0.109 0.047
0.220 0.691
0.045 0.001
0.255 0.223
NoVegetation cover 0.368 0.036
0.083
0.002
0.772
0.137
0.003
0.013
0.038
0.002
0.705
0.239
0.011
0.037
0.000
0.211
0.739
Table 4. Transition matrix for 1991-2001 2001 2010
Fig.5. Classified Map of year 2001(barren land = novegetation cover)
Null Urban Water Body Vegetation No Vegetation cover
Null
Urban
Water Body
Vegetation
0.097 0.017
0.333 0.731
0.082 0.001
0.259 0.131
NoVegetation cover 0.227 0.118
0.040
0.009
0.923
0.025
0.001
0.012
0.070
0.006
0.650
0.260
0.008
0.064
0.002
0.154
0.769
Table 5. Transition matrix for 2001-2010 1991 2010 Null Urban Water Body Vegetation No Vegetation cover
Null
Urban
Water Body
Vegetatio n
0.045 0.022
0.316 0.798
0.053 0.001
0.201 0.145
NoVegetation cover 0.383 0.031
0.041
0.013
0.884
0.059
0.000
0.012
0.091
0.007
0.596
0.291
0.010
0.088
0.002
0.160
0.737
Table 6. Transition matrix for 1991- 2010 Land Cover Class Urban Water Body Vegetation
Fig.6. Classified Map of year 2010 (barren land = novegetation cover)
1991 (sq. km.) 42.16 25.55 1333.68
2001 (sq. km.) 133.42 26.61 1204.07
2010 (sq. km.) 271.04 38.33 994.43
2021 (sq. km.) 455.02 60.71 704.76*
No1131.45 1173.39 1241.97 1337.19* vegetation cover Table 7. Area covered by land cover classes. Year 2021 is predicted area for different classes.
This contribution has been peer-reviewed. doi:10.5194/isprsarchives-XL-8-967-2014
969
The International Archives of the Photogrammetry, Remote Sensing and Spatial Information Sciences, Volume XL-8, 2014 ISPRS Technical Commission VIII Symposium, 09 – 12 December 2014, Hyderabad, India
5. CONCLUSION
Satellite remote sensing and GIS technology are useful for understanding the land use and land cover change dynamics. Therefore, this kind of study would be time and cost effective methods for urban planners and decision makers. There is a consistent increase in the urban area of Pune from 1991 to 2010. According to this study the urban class in and around Pune is predicted to grow much higher in year 2021 as compared to 2010. Industrialization and increased population growth would be major driving forces for the change in land use during the past 19 years. The temporal and spatial resolution of the satellite imagery and absence of ground truth information are the few limitations to obtain better result. The present study is encouraging to carry out further analysis on how this change would be affecting the exiting land cover.
Photogrammetric Engineering & Remote Sensing Vol. 69, No. 9, September 2003, pp. 1003–1010.
ACKNOWLEDGEMENTS Thanks to Bhushan Gawde, Sagar Taneja, Harshit Gaekwad, Namrata Kambli and Preeti Bakshi, CDAC-ACTS, Pune, India for their valuable support for carrying out this study. REFERENCES Belal A.A., F.S. Moghanm, “Detecting urban growth using remote sensing and GIS techniques in Al Gharbiya governorate, Egypt,” The Egyptian Journal of Remote Sensing and Space Sciences (2011) 14, 73–79. Samereh Falahatkar, Ali Reza Soffianian, Sayed Jamaleddin Khajeddin, HamidReza Ziaee, Mozhgan Ahmadi Nadoushan, “Integration of Remote Sensing data and GIS for prediction of land cover map,” International journal of Geomatics and Geosciences Volume 1, No 4, 2011. Wenli Huang, Huiping Liu, Qingzu Luan, Qingxiang Jiang, Junping Liu, Hua Liu, “Detection and prediction of land use change in Beijing based on remote sensing and GIS,” The International Archives of the Photogrammetry, Remote Sensing and Spatial Information Sciences. Vol. XXXVII. Part B6b. Beijing 2008 Fei Yuan, Kali E. Sawaya, Brian C. Loeffelholz, Marvin E. Bauer, “Land cover classification and change analysis of the Twin Cities (Minnesota) Metropolitan Area by multitemporal Landsat remote sensing,” Remote Sensing of Environment 98 (2005) 317 – 328. Keith C. Clarke and Leonard J. Gaydos, “Loose-coupling a cellular automaton model and GIS:long-term urban growth prediction for San Francisco and Washington/Baltimore,” International Journal of Geographical Information Science, 12:7, 699-714, 06 Aug 2010. Manonmani R., G.Mary Divya Suganya, “Remote Sensing and GIS application in change detection study in urban zone using multi temporal Satellite,” International Journal of Geomatics and Geosciences Volume 1, No 1, 2010. Limin Yang, George Xian, Jacqueline M. Klaver, Brian Deal, “Urban land-cover change detection through sub-Pixel imperviousness mapping using remotely sensed data,”
This contribution has been peer-reviewed. doi:10.5194/isprsarchives-XL-8-967-2014
970