The city is surrounded by the Holy River Kshipra. The river also has many changes in its spread of flow path. A very intense increase has been observed in the ...
International Journal of Scientific & Engineering Research Volume 9, Issue 4, April-2018 ISSN 2229-5518
591
Urbanization and Change Detection of Land Use Land Cover of the Holy City Ujjain 1
Manoj Patley , Rishabh Tripathi1, Patel Lokesh2
Abstract: The Ujjain city has its own importance in state of Madhya Pradesh as many of the religious places are situated within the city. Land use Land Cover of the city is nowadays a major concern for various aspects. As the city is having many temples with vital religious importance, the
IJSER
crowd comes forward at intense. A proper use of land is therefore very important to manage the space as well as the utilities in the city at time of religious occasions. A proper development plan for the urban area of the city is needed very much. Here in this study a try has been made to evaluate the changes in the land use land cover pattern of the city, mainly concerned over the urbanization of the city. The changes occurred in the urbanization of the city over a time period of one decade from the year 2005 up to the year 2015 have been tried to be evaluated. For the change detection, the land use land cover (LULC) maps are prepared separately for the year 2005 and 2015. Landsat imageries at a resolution of 30m have been used to prepare the LULC maps of the city for mentioned years. Erdas Imagine software used for extracting ground information from the satellite imageries. The changes occurred during 2005 to 2015 have been evaluated using the ArcMap software, using the tool Overlay Analysis the changes have been quantified. The city is surrounded by the Holy River Kshipra. The river also has many changes in its spread of flow path. A very intense increase has been observed in the urbanization of the city during a period of one decade. The results of the study may help the city action plan at a considerable state. Keyword:LULC, Landsat, Overlay Analysis.
IJSER © 2018 http://www.ijser.org
International Journal of Scientific & Engineering Research Volume 9, Issue 4, April-2018 ISSN 2229-5518
592
INTRODUCTION
Land use/land cover (LULC) changes have direct impacts on the hydrological cycle and stream water quality, and furthermore, there are also indirect impacts on climate and the related impacts of the altered climate on the hydrology of an area (Weng, 2001). Therefore, LULC changes have been treated as one of the most crucial and sensitive factors for global environmental change. Urbanization is the major force that is driving LULC changes. Although urbanization due to urban sprawl provides social and economic benefits to the community, the detrimental consequences of the urbanization to the urban environment are widespread, especially in most emerging countries. Increased impervious surface in the urbanized areas can reduce the time to peak and increase the peak discharges, resulting in large and more frequent incidents of flooding (Weng, 2001; Li and Wang 2009). In addition, because of the pollutants in runoff and sediments, the increase of impervious surfaces also degrades stream quality (Li and Wang, 2009). Therefore, urbanized areas would become more susceptible to flood hazard under conditions of high precipitation intensity (Shi et al., 2007).
IJSER
In recent decades, with a constantly accelerating increase of urban population, urbanization has become a significant urban environmental and ecological concern, especially in most developing countries. Therefore, it is of great significance to accurately map LULC changes in urbanized areas and to evaluate its impacts on surface runoff and stream quality for urban planning policy makers and water/land resource management. Due to their relatively low cost and suitability for large area mapping, satellite remote sensing (RS) images have been widely applied for detecting urban growth and accurately and timely mapping LULC changes over a long period (Yang et al., 2003). Furthermore, RS-based LULC changes mapping also allows for a rapid assessment of its impacts on surface runoff and water quality (Li and Wang, 2009). In India, rapid urban sprawl has had a profound influence on runoff and results in larger and more frequent incidents of flooding in many urban areas. Over the past three decades, Bhopal, the capital of Madhya Pradesh, India, is one of the fastest growing urban areas in Madhya Pradesh, and has undergone intense urbanization which has impacted the urban surface runoff. The objective of this paper is to derive LULC classification maps and further quantitatively assess the effects of LULC change on surface runoff in Ujjain city and along its periphery comprising of the urban-rural fringe areas. The LULC maps are derived from LANDSAT TM/ETM+ imagery (2005 and 2015) using unsupervised classification method.
IJSER © 2018 http://www.ijser.org
International Journal of Scientific & Engineering Research Volume 9, Issue 4, April-2018 ISSN 2229-5518
593
STUDY AREA The study area is a part of Ujjain district of Madhya Pradesh, India and covers an area of 158.74 sq. km. Ujjain is one of the ancient cities of India, situated on the eastern bank of the Kshipra River. In central India, on the Malwa Plateau, Ujjain was the most prominent city for much of its history. Around 600 BCE, in central India, Ujjain emerged as the Political Centre. Ujjain is located in the west-central part of India, and is north of the upper limit of the Vindhya mountain ranges. It is higher than the north Indian plains and the land rises towards the Vindhya mountain range to the south. Ujjain's co-ordinates are23o 10’ N and 75o 46’ E with average elevation of 494 meters (1620 ft.). According to the 2011 census Ujjain has a population of 515,215 of which male are 264,871 and female are 250,344 respectively with sex ratio is 945 per 1000 males and child sex ratio of girls is 929 per 1000 boys. The city has children between (0-6) are 58,972 and There were 30,573 boys while 28,399 are girls which forms 11.45% of total population of City. As literacy wise, total literates
IJSER
in city are 385,193 of which 210,075 are males while 175,118 are females and average literacy rate of city is 84.43 percent of which male and female literacy was 89.66 and 78.90 percent.The Government of Madhya Pradesh has allotted 1,200 acres for the development of an industrial area on the Dewas-Ujjain Road near Narwar village. The area was envisaged as an educational hub, originally named "Vikramaditya Knowledge City". But due to diminished investment prospects, it was renamed to "VikramUdyogNagari" ("Vikram Industrial City"). As of 2014, the government has conceptualised it as a half-industrial, half-educational area. The stakeholders in the project include the state government and the Delhi Mumbai Industrial Corridor (DMIC) Trust.
IJSER © 2018 http://www.ijser.org
International Journal of Scientific & Engineering Research Volume 9, Issue 4, April-2018 ISSN 2229-5518
594
IJSER Figure 1. The map showing the location of the study area
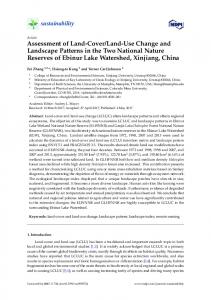
METHODOLOGY
The LULC classification maps were derived from LANDSAT TM/ETM+ imagery. Figure 2 shows the data processing framework of research on LULC changes. The figure 2 depicts the data processing for LULC classification and change detection, unsupervised classification used to prepare LULC maps and spatial intersection (overlay analysis) used to evaluate the temporal change of LULC in study area. Unsupervised Classification Visual interpretation technique was used for the mapping of land use/land cover. Prior to interpretation of multi-date satellite data, a reconnaissance survey of the study area was done to develop a classification scheme based on local knowledge and ancillary information. An interpretation key was also developed based on standard Photo-elements like tone,texture, size, shape, association, pattern, location etc. to identify and map different classes. With the help of interpretation key onscreen preliminary interpretation of satellite data was done using ERDAS IMAGINE 2011 software.
IJSER © 2018 http://www.ijser.org
International Journal of Scientific & Engineering Research Volume 9, Issue 4, April-2018 ISSN 2229-5518
595
Ground Truth Verification Entire study area was visited to get an acquaintance of different ground feature and cover type with respect to satellite data. The doubtful area on preliminary interpreted maps from satellite data were carefully verified in the field. After verification, these areas were reconciled on the maps and corrections were made to obtain final maps.
IJSER Figure 2. Framework of research on LULC changes.
Overlay analysis, Final Map Preparation and Area Statistics Generation The spatial intersection method has been used for performing the overlay analysis using Arc info software. The final maps were prepared after reconciliation of doubtful areas observed in preliminary maps. The final maps were prepared/ composed and area statistics were generated using Arc Map 10.0 Software. RESULTS AND ANALYSIS In the present study land use/land cover of Ujjain and its peripheral area was mapped for the years2005 and 2015. In order to monitor the changes in land use/land cover, proper care was taken in the selection of cloud free temporal data. It was not possible to obtain the ground truth pertaining to older datasets i.e. LANDSAT 2005, therefore a novice approach to overcome the same was followed by mapping for 2015 and using it as template for the analyses of 2005 dataset.
IJSER © 2018 http://www.ijser.org
International Journal of Scientific & Engineering Research Volume 9, Issue 4, April-2018 ISSN 2229-5518
596
The major land use/land cover categories identified in the study area are river & waterbodies, town-city (urban), barren rocky, fallow, kharif, double crop, rabi, land with or without scrub and villages (rural) and their areal extent. The details of the various land use classes and the observed changes are presented in Table 1 and Figure 3, 4 & 5. In general major area was occupied by rabi crop followed by fallow land, double crop, land with or without scrub, town-city (urban), kharif crop, villages (rural), river & waterbodies and barren rocky in the year 2005. In the year 2015, town-city (urban) has increased. The town-city (urban) area identified in the study area was mainly city settlements. The total town-city (urban) area of 16.17 sqkm in 2005 increased to 24.62 sqkm in 2015. This accounted 10.24% and 5.60% of the total geographical area during 2005 and 2015 respectively. The overall increase was 0.52% of total geographical area with annual increment of 0.85 sqkm/year.
Fallow land was observed mainly on plain lands and uplands and accounted 25.69 sqkm and 17.82 sqkm during 2005 and 2015 respectively and the rate of decrease in the fallow land area was -0.79 sqkm/year.
IJSER
Kharif crop was observed to be 8.27 sqkm and 8.00 sqkm during 2005 and 2015 respectively with a rate of decrease of -0.03 sqkm/year. Rabi crop was 52.40 sqkm in the year 2005 while 60.27 sqkm in the year 2015 which got an increase with the rate of 0.79 sqkm/year. Double crop estimated 24.96 sqkm in 2005 while 22.35 sqkm in 2015. It has decrease at the rate of -0.26sqkm/year. The land with or without scrub has significant change during 2005 to 2015. It has been observed 21.18 sqkm in 2005 while decreased to 15.61 sqkm in 2015 at the rate of -0.56 sqkm/year. However the LULC classes viz. river & waterbodies, barren rocky and villages (rural) areas did not experienced any significant changes over the time duration taken for this study.
The transformation of a particular land use/land cover category into different categories was derived by spatial intersection of 2005-2015. The results have been encased in tabular form and presented in table 1 & 2. One may expect such change in the study area on account of increase in population over a period of almost a decade.
IJSER © 2018 http://www.ijser.org
International Journal of Scientific & Engineering Research Volume 9, Issue 4, April-2018 ISSN 2229-5518
597
Table 1. Area statistics of land use/land cover distribution in Study area during 2005 & 2015. Sl.
LULC Classes
2005
2005
2015
2015
Change
Area
No
AREA
AREA
AREA
AREA
2005-2015
per
.
(sqkm)
(%)
(sqkm)
(%)
(%)
(sqkm)
2.53
3.99
2.53
0.00
0.00
10.24
24.62
15.60
0.52
0.85
0.05
0.03
0.05
0.03
0.00
0.00
1
& 3.99
RIVER
Change year
WATERBODIES 2
TOWN
CITY 16.17
-
(URBAN) 3
BARREN ROCKY
4
FALLOW
25.69
16.27
17.82
11.29
-0.31
-0.79
5
KHARIF
8.27
5.24
8.00
5.07
-0.03
-0.03
6
DOUBLE CROP
24.96
15.81
22.35
14.16
-0.10
-0.26
7
LAND WITH OR 21.18
13.42
15.61
9.89
-0.26
-0.56
52.40
33.19
60.27
38.18
0.15
0.79
5.16
3.27
5.16
3.27
0.00
0.00
157.87
100.00
157.87
100.00
IJSER
WITHOUT SCRUB 8
RABI
9
VILLAGES (RURAL)
Total Area
Table 2. Transformation of LULC classes from the year 2005 to 2015.
2005→ 2015↓
RIVER & WATERBODIES TOWN - CITY (URBAN) BARREN ROCKY FALLOW KHARIF DOUBLE CROP LAND WITH OR WITHOUT SCRUB RABI VILLAGES (RURAL)
Total
3.99 -
TOWN CITY (URBAN) 16.17 -
-
-
-
-
-
-
15.61
-
-
-
-
-
7.87 -
-
-
-
52.40 -
5.16
3.99
16.17
0.05
25.69
8.27
24.96
21.18
52.40
5.16
RIVER & WATERBODIES
LAND WITH BARREN DOUBLE VILLAGES FALLOW KHARIF OR WITHOUT RABI ROCKY CROP (RURAL) SCRUB 0.27 2.61 5.57 0.05 17.82 8.00 22.35 -
IJSER © 2018 http://www.ijser.org
Total 3.99 24.62 0.05 17.82 8.00 22.35 15.61 60.27 5.16
157.87
International Journal of Scientific & Engineering Research Volume 9, Issue 4, April-2018 ISSN 2229-5518
IJSER
Figure 3. LULC map of study area in 2005.
Figure 4. LULC map of study area in 2015.
Figure 5. LULC change detection and transformations during 2005-2015 IJSER © 2018 http://www.ijser.org
598
International Journal of Scientific & Engineering Research Volume 9, Issue 4, April-2018 ISSN 2229-5518
599
CONCLUSIONS This paper presents a case study to investigate the decadal impacts on LULC change especially on urbanization of the Ujjain city. The LULC maps were derived from LANDSAT TM/ETM+ imagery (acquired in 2005 and 2015 respectively) using support unsupervised classification. The long-term impacts of urbanization on the city were then assessed. Results indicated that the selected study area experienced rapid urbanization from 2005 to 2015. The overall increase in settlements in town-city urban area was 0.52% during 2005 to 2015. The increase in urban area was due to transformation of agriculture and land with or without scrub. As a direct result of the urbanization from 2005 to 2015, the long-term surface runoff will be increased for the whole area. This study may serve a simple method for developmental activities for policy makers to take actions in planning of the Ujjain city. References Dabbs, D.L. and Gentle, G.C., (1974). Landscape classification and plan succession Trends in Peace Athabasca Delta Can. Wildlife Service Rep. SER: pp 32-34.
IJSER
Gautam, N.C., and Narayan, L.R.A., (1983). Landsat MSS data for land use/land cover inventory. Harbor, J. M., M. Grove, B. Bhaduri, and M. Minner, 1998. Long-term hydrologic impact assessment (LTHIA) GIS, Public Works, 129:52–54. Karwariya.S. and Goyal S., (2011). Land use and Land Cover mapping using digital classification technique in Tikamgarh district, Madhya Pradesh, India using Remote Sensing. Li, Y., and C. Wang, 2009. Impacts of urbanization on surface runoff of the Dardenne Creek watershed, St. Charles County, Missouri, Physical Geography, 30(6): 556–573. Shi, P., Y. Yuan, J. Zheng, J. Wang, Y. Ge, and G. Qiu, 2007. The effect of land use/cover change on surface runoff in Shenzhen region, China, Catena, 69: 31-35. Wang, Y., C. Woonsup, and M. D. Brian, 2005. Long-term impacts of land-use change on non-point source pollutant loads for the St. Louis metropolitan area, USA, Environmental Management, 35(2): 194205. Weng, Q., 2001. Modeling urban growth effects on surface runoff with the integration of remote sensing and GIS, Environmental Management, 28(6): 737-748. Yang, L., G. Xian, J. M. Klaver and B. Deal, 2003. Urban land-cover change detection through subpixelimperviousness mapping using remotely sensed data, Photogrammetric Engineering and Remote Sensing,69(9): 1003-1010. Zhongchang Sun, Effect Of Lulc Change On Surface Runoff In Urbanization Area, ASPRS 2011 Annual Conference Milwaukee, Wisconsin,May 1-5, 2011
IJSER © 2018 http://www.ijser.org