Usability Evaluation of Virtual Museums’ Interfaces Visualization Technologies Stella Sylaiou, Vassilis Killintzis, Ioannis Paliokas, Katerina Mania, and Petros Patias School of Social Sciences, Hellenic Open University Lab or Medical Informatics, Aristotle University of Thessaloniki, Greece Democritus University of Thrace, Greece Laboratory of Photogrammetry and Remote Sensing, Aristotle University of Thessaloniki, Greece
[email protected],
[email protected],
[email protected],
[email protected]
Abstract. This paper reports on a user-centered formative usability evaluation of diverse visualization technologies used in Virtual Museums. It initially presents the selection criteria and the five museum websites involved in the analysis. Then, it describes the evaluation process, in which a group of subjects explored the museums’ on-line resources and answered in two usability questions concerning overall reaction to the website and the subjective satisfaction of the users. After user testing, quantitative and qualitative data have been collected and statistically analysed. However, much research remains to be done on future research in terms of larger sample, different methodologies and varied contexts. Keywords: history and culture, digital humanitis, cultural informatics.
1
Introduction
The London Charter encourages virtual museums to promote rigorous design of digital heritage visualization however; it suggests that virtual museums should ensure that embedded visualization paradigms follow a human-centric design so that they promote the study and interpretation of cultural heritage assets. The Principle 2 of the London Charter states that computer-based visual media should be employed when they provide added value for the study of cultural assets compared to other methods. It stresses that in order to determine the suitability of each technologically-driven visualization method, a systematic evaluation of such methods should be carried out based on specific evaluation criteria. Relevant research sources utilized should be identified and evaluated in a structured and documented way taking into account best practice within communities of practice. The London Charter’s main goal is to encourage dissemination of computer-based visualization so that significant relationships between cultural elements can be determined by visitors. Such dissemination should target to strengthen the study, interpretation and preservation of cultural heritage. R. Shumaker and S. Lackey (Eds.): VAMR 2014, Part II, LNCS 8526, pp. 124–133, 2014. © Springer International Publishing Switzerland 2014
Usability Evaluation of Virtual Museums’ Interfaces Visualization Technologies
125
Various researches have evaluated museum websites using design patterns [1], usability of virtual museum websites [2,3], utilizing both empirical and expert-based methods combining quantitative and qualitative research methods [4, 5], explored the relationship between the sense of Presence, previous user experience and enjoyment [6], the effect of various visualisation technologies to the sense of Presence [7], have developed guidelines concerning issues ranging from design considerations to project philosophies [8], exploring requirements for online art exhibitions [9]. The main goal of this paper is to explore the usability parameters that can be used as reference for evaluating virtual museums, which often incorporate varied technological elements. After a short introduction to virtual museums and the selected cases for the purposes of research and the usability evaluation, the participants, the experimental procedure and the methods used for the statistical analysis are presented. In the last section of the paper, the research results are analysed and discussed.
2
Virtual Museums
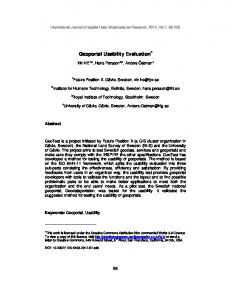
A virtual museum [10] is a complex environment that according to the choices of the design team, determines the visitors' final experience and subsequent attitudes towards the use of digital media in museums. In order to cluster the wide range of existing museum websites into specific representative categories, a team of four scientists experienced in interactive design and the use of Information and Communication Technologies in culture and education, was assembled. Museum online resources were divided according to the presentation method employed for their visualization and grouped/ classified according to that in five technologically-oriented categories of museum sites mainly including: Panoramic images (QTVR), (2) Scalable images with text, (3) Searchable databases, (4) 3D environments, (5) Videos. The experts shared a preselected pool of museum websites and worked independently to extract within these categories the factors that may influence the user's experience according to their personal understanding and recent research literature on evaluation strategies for virtual museums. Subsequently, the factors were merged into a set of five qualities or capacities: imageability, interactivity, navigability, virtual spatiality and narration as explained in Table 1. Of the five representative cases of virtual museums as presented below, four serve as extensions to existing physical museums, while one is totally imaginary. Imageability: Panoramic Images. Imageability is defined as the “quality in a physical object that gives it a high probability of evoking a strong image in any given observer. It is shape, colour, or arrangement, which facilitate making of vividly identified, powerfully structured, highly useful mental images of the environment” [11, p. 9]. In VEs of high imageability, users can experience the real museum space through panoramic images that can be manipulated thanks to a set of interactive tools, such as rotate and pan, zoom in and out, and even navigate. The case selected for this study, labeled as M1, is the "Virtual Exhibition Tours" (http://www.nga.gov/onlinetours/index.shtm) of the National Gallery of Art in Washington. In this online environment, visitors can
126
S. Sylaiou et al.
select specific works of art for larger image views, close-up details, streaming audio commentary, and information about the object (Figure 1). Table 1. Qualities of museum online resources. Quality 1. Imageability
Definition Perceptual quality of a VE that makes it memorable
2. Interactivity
The HCI functionality that makes a VE able to communicate with its visitors
3. Navigability
The degree to which navigation capabilities are perceived from structural elements of the VE
4. Virtual Spatiality
The extension of physical museum space and the metaphors of architecture to virtual space
5. Narration
Narration via a collection of videos that engages the virtual visitors providing them the opportunity to investigate a theme in a variety of ways and construct their own meaning
Fig. 1. Screenshot of the Van Gogh Virtual Exhibition Tour at the National Gallery of Art
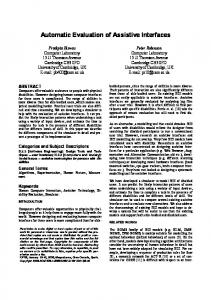
Interactivity with Scalable Images and Texts. Image scalability provides the opportunity to examine museum artifacts or parts of them in detail by applying zoom tools over high resolution images. These zoom-on-demand features allow viewing aspects of photos that are not visible to the naked eye because of their small size or because of the museums' spatial proximity restrictions. Image exploration tools make VEs highly interactive and enhance museum experience [6]. The selected case for this study, labeled as M2, is the Metropolitan Museum of New York (http://www. metmuseum.org/) (Figure 2).
Usability Evaluation of Virtual Museums’ Interfaces Visualization Technologies
127
Fig. 2. Snapshot of an object contained in the section of Greek and Roman Art of the Metropolitan Museum of Art
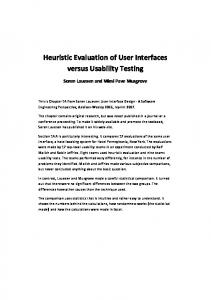
Navigability: Searching Utility for Images and Texts. This type of online museum environments offers multiple search options and enhanced image manipulation. Searchable databases typically contain 2D representations in the form of photos and flat scans of objects along with their corresponding metadata, which are uploaded to the museum’s online database. The hallmark of these sites is a search engine, which allows searching by content, concept, or metadata, thanks to an entry point usually consisting of a text area in which visitors enter search criteria based on keywords. The case selected for this study, labeled as M3, is the Museum of Modern Art (http://www.moma.org/explore/collection/index). Through its database, visitors can navigate the various thematic areas of the museum, and search its collections by artist, work or keyword. It also has an advanced search that allows adding refinement criteria such as period or object management status (Figure 3).
Fig. 3. The advanced search engine of the Museum of Modern Art online database
128
S. Sylaiou et al.
Virtual Spaciality: Simulation of a 3D Reconstructed Museum Space. Since place and space have been inseparable in our experience of the real world until now, when we experience the Web’s placeness, we assume that it must also have the usual attributes of spatiality [Weinberger 2002, p. 56 after 12]. In this type of online resource allows ‘free’ and interactive real-time navigation in a 3D space that reproduces more or less realistically the museum galleries. This kind of online resources usually seeks to reproduce as realistically as possible the experience of the visit, with the added value of the multimedia information, the hypertext/spatial navigation, and the possibility to manipulate (zooming, rotation) objects. The case selected for this study, labeled as M4, is the Van Gogh Virtual Museum (http://www.vangoghmuseum.nl/), which constitutes of a typical example of a 3D reconstruction of a museum setting using computer-aided design tools and gaming technologies (figure 4).
Fig. 4. Snapshot of the Van Gogh Virtual Museum
Narrative Videos. The last category corresponds to Virtual Museum websites containing narrative embedded videos. The selected case for this study, labeled as M5, is the Virtual Silver Screen of the Library and Archives Canada (http://www.collectionscanada.ca/ silverscreen/). The website uses Flash technologies to present different Canadian films of the early 20th century, which are perceived as historic documents organized by themes that the user can select for visualization (Figure 5).
Fig. 5. Snapshot of the Home page of the Virtual Screen Silver
Usability Evaluation of Virtual Museums’ Interfaces Visualization Technologies
3
129
Usability Evaluation
According to ISO-9241 describing the ‘Ergonomic requirements for office work with visual display terminals’ (ISO, 1998) standard, usability of a system is defined as the ability to function effectively and efficiently, while providing subjective satisfaction to its users. Usability of an interface is usually associated with five parameters (ISO, 1998; Nielsen, 1993), derived directly from this definition: An interface (a) is easy to learn, (b) is efficient to use, (c) is easy to remember, (d) produces few errors, (e) is pleasant to use. The QUIS (Questionnaire for User Interaction Satisfaction) questionnaire (Schneiderman and Plaisant, 2005) assessed museum participants’ contentment, while interacting with the virtual museums. This questionnaire was used as the main instrument recording their subjective assessments. The QUIS questionnaire consists of 7 parts. Part 1 concerning the general experience with ICT (Information and Communication Technologies) is often omitted. Part 2 assesses the overall user reactions as regards to the evaluated system, Part 3 concerns the windows layout of the system, Part 4 the terminology used, Part 5 the learnability of the interface (how easy it is to learn) and Part 6 the system capabilities. For this research needs we have selected the parts of the questionnaire that concern the overall reaction to the website and the subjective satisfaction of the users.
4
Materials and Methods
Due to technical restrictions not all Virtual Museum websites were able to run on tablets, smartphones and other portable media. Thus, the experiment have been conducted in a HP workstation with two 2.4GHz Xeon processors, 2048 MB memory and 19’ inches screen to secure the same testing conditions for all. 4.1
Participants
A total of one-hundred sixty-four (164) volunteers (males and females, aged 19-37), mainly undergraduate and postgraduate students from the Aristotle University of Thessaloniki, Greece, participated in the experiment. Virtual visits for academic or professional research are considered the most demanding kind of visits in a virtual museum because they are targeted, have defined learning requirements and time constraints. Random or unintended visits could contribute less to this study. Also, returning (physical and virtual) visitors would have been inconsistent because of their previous experience and knowledge. All participants reported to have at least basic knowledge of computers and good knowledge of the English language. All students selected had never visited the virtual museum websites before. Participants in all conditions were naive as to the purpose of the experiment.
130
4.2
S. Sylaiou et al.
Experimental Procedure
The premise of the proposed research is that different visualisation methods -with their specific associated capacities- serve different aims, connected with usability, presence, motivation and learning outcomes. The evaluation methodology proposed is based on questionnaires assessing such aspects of the virtual museum experience, administered after navigating the selected virtual museums presented in Section 3. The results will be used for a comparable evaluation of various approaches regarding the presentation and interaction methods used for museum artefacts. The evaluation and the interviews took place at the laboratory of Photogrammetry and Remote Sensing of the Aristotle University of Thessaloniki, Greece. The interviews have taken place in laboratory-like conditions, where no visitors were allowed, so as the users can be concentrated to the completion of the questionnaires. The evaluation involved only one participant at a time and assistants instructed the end-users if they needed help. Tracking of user errors while navigating as well as the time needed to complete the tasks were not recorded, because it was not our intention to test the users’ performance, but the websites’ performance. The evaluation used cued testing, which involves explaining to the users the purpose of the project and asking them to perform specific tasks or to answer questions. Four steps were undertaken: 1. Goal setting: users start with a plan of the tasks to be accomplished. 2. Exploration: users explore the interface and discover useful actions. 3. Selection: users select the most appropriate actions for accomplishing their task. 4. Assessment: users interpret the system’s responses and assess its progression). The participants were allowed to select the virtual exhibitions and exhibits they preferred in order to feel they had the control over their own learning. The same procedure was repeated for each of the five museums with only one participant at a time. Each participant experienced all websites and the order of the websites was established randomly. The questionnaires were completed directly after the exploration of the Virtual Museums websites. 4.3
Statistical Analysis
The questions administered were subsequently subject to statistical analysis, which was divided in two parts. An initial prediction stipulated that the Virtual Museum M4 would be the most suitable for learning. According to previously aforementioned researches on constructivistic learning/serious games, the reason would be that it simulates a real visit (emotional component) and allows self-controlled navigation in a reconstructed space as well as interaction with objects. The first part of the analysis sought to verify whether the Virtual Museum (M4) provided the most efficient and engaging experience. The answers to the virtual museum questions were tested for normality before performing the analyses using the Shapiro-Wilk test and the onesample Kolmogorov–Smirnov test. We proceed with non parametric test KruskalWallis for each question to reject the null hypothesis that all scores are similar for all museums. The hypothesis is rejected on sig. (P) adjusted p=0.11). A significance level of 0.05 was maintained (p must be