Computers & Education 45 (2005) 399–416 www.elsevier.com/locate/compedu
Usability, quality, value and e-learning continuance decisions Chao-Min Chiu a,*, Meng-Hsiang Hsu b, Szu-Yuan Sun b, Tung-Ching Lin c, Pei-Chen Sun d a
Department of Information Management, National Central University, No. 300, Jungda Road, Jhongli City, Taoyuan 320, Taiwan, ROC b Department of Information Management, National Kaohsiung First University of Science and Technology, 1, University Road, Yenchao, Kaohsiung 824, Taiwan, ROC c Department of Information Management, National Sun Yat-sen University, 70 Lien-Hai Road, Kaohsiung 804, Taiwan, ROC d National Kaohsiung Normal University, 116 Ho-Ping First Road, Kaohsiung 802, Taiwan, ROC Received 10 March 2004; accepted 11 June 2004
Abstract Previous research suggests that an eventual information technology (IT) success depend on both its initial adoption (acceptance) and subsequent continued usage (continuance). Expectancy disconfirmation theory (EDT) has been successfully used to predict usersÕ intention to continue using information technologies. This study proposed a decomposed EDT model to examine cognitive beliefs and affect that influence usersÕ continuance decision in the context of e-learning service. The proposed model extended EDT by decomposing the perceived performance component into usability, quality, and value. Research hypotheses derived from this model are empirically validated using the responses to a survey on e-learning usage among 183 users. The results suggest that usersÕ continuance intention is determined by satisfaction, which in turn is jointly determined by perceived usability, perceived quality, perceived value, and usability disconfirmation. Ó 2004 Elsevier Ltd. All rights reserved. Keywords: Continuance; E-learning; Expectancy disconfirmation theory; Usability; Quality; Value
*
Corresponding author. Tel.: +886 3 426 7251; fax: +886 3 425 4604. E-mail address:
[email protected] (C.-M. Chiu).
0360-1315/$ - see front matter Ó 2004 Elsevier Ltd. All rights reserved. doi:10.1016/j.compedu.2004.06.001
400
C.-M. Chiu et al. / Computers & Education 45 (2005) 399–416
1. Introduction The explosive growth of the World Wide Web (WWW) has made it a popular platform for providing electronic services (e-service), e.g., electronic learning (e-learning) service. UsersÕ intention to continue using an e-learning service is considered as a major determinant of the e-learning success. While initial use (acceptance) of the e-learning service is the important first step toward realizing e-learning success, an eventual e-learning success further depends on its continued use or ‘‘continuance’’ (in contrast to initial use or ‘‘acceptance’’) after initial use. Clearly, understanding the factors influencing the userÕs intention to continue using the e-learning service is a critical issue for researchers and practitioners. A critical factor for establishing long-term client relationships is satisfaction (Patterson, Johnson, & Spreng, 1997), which is the core component of the expectancy disconfirmation theory (EDT). EDT theorizes that repurchase intention is determined by satisfaction, which is jointly determined by two post-usage factors (i.e., perceived performance and disconfirmation) and one pre-usage factor, namely expectation. Some studies have begun to apply EDT to examine variables that motivate individuals to continue using an information technology (IT) (e.g., Bhattacherjee, 2001b; McKinney, Yoon, & Zahedi, 2002). In an application of EDT to the study of drivers of consumersÕ intention to continue using e-commerce services, Bhattacherjee (2001b) used perceived usefulness to operationalize the perceived performance construct. McKinney et al. (2002) proposed a measurement of Web-customer satisfaction in which perceived performance was measured in terms of quality, including information quality and system quality. DeLone and McLean (1992) proposed an information systems (IS) success model in which system quality and information quality are depicted as affecting user satisfaction and IS use. In a respecification of the DeLone and McLeanÕs IS success model, Seddon (1997) modeled system quality, information quality and perceived usefulness as the major determinants of user satisfaction. Rai, Lang, and Welker (2002) proposed an amended Seddon model in which perceived ease of use, perceived usefulness, and information quality are modeled as the antecedents of satisfaction. Some studies in the consumer behavior domain have also identified perceived value as an important determinant of user satisfaction, e.g., Fornell, Johnson, Anderson, Cha, and Bryant (1996), McDougall and Levesque (2000), and Patterson and Spreng (1997). By synthesizing the EDT paradigm with empirical theories in user satisfaction and IS success, we suggest modeling the determinants of satisfaction from three perspectives, i.e., usability, quality, and value. This study contributes a decomposed EDT model of e-learning continuance in which EDT is adapted from the consumer behavior literature and integrated with theoretical findings from prior IS usage and success research. Using questionnaire data, we employ structural equation modeling (LISREL) to assess the accuracy of the decomposed EDT model and to test the research hypothesis.
2. Theoretical background and the research model 2.1. Expectancy disconfirmation theory Expectancy disconfirmation theory or disconfirmation of expectation theory is a consumer behavior model that has gained widespread acceptance in the research of explaining and predict-
C.-M. Chiu et al. / Computers & Education 45 (2005) 399–416
401
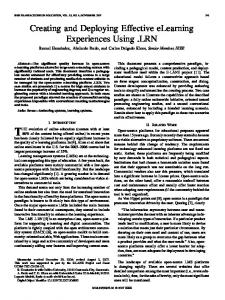
ing consumer satisfaction and the repurchase intention. The EDT model originally developed by Oliver (1980) theorizes that consumersÕ intention to repurchase a product or reuse a service is determined primarily by their satisfaction with prior use of that product or service. Satisfaction is jointly determined by disconfirmation and expectation. In this model disconfirmation is the most immediate influence on satisfaction. Churchill and Surprenant (1982) extended the model to explicitly include perceived performance as an antecedent of satisfaction and include effects of expectations and perceived performance on disconfirmation and effects of expectations on perceived performance. Fig. 1 illustrates key constructs and posited relationships among them in EDT. The EDT model assumes that consumersÕ degree of satisfaction is an outcome of a five-step process (Oliver, 1980). First, consumers form an initial expectation of a specific product or service prior to purchase. Second, they accept and use that product or service. Following a period of initial consumption, they form perceptions about its performance on the salient attributes. Third, they compare these perceptions of performance with their prior expectation levels and determine the extent to which their expectations are confirmed. Expectations could be positively disconfirmed (perceived performance exceeds expectations), confirmed (perceived performance equals expectations), or negatively disconfirmed (perceived performance falls short of expectations). Fourth, they form a feeling of satisfaction or dissatisfaction based on their disconfirmation level. A moderate satisfaction level will be maintained by confirmation, enhanced by the delight of positive disconfirmation, and decreased by the disappointment of negative disconfirmation. Finally, satisfied consumers form intentions to reuse the product or service in the future, while dissatisfied users discontinue its subsequent use. The predictive ability of the EDT has been demonstrated over a wide range of consumer satisfaction and product or service continuance contexts, including restaurant service (Swan & Trawick, 1981), health care options (Gilbert, Lumpkin, & Dant, 1992), automobile repurchase (Oliver, 1993; Yoon & Kim, 2000), camcorder usage (Spreng, MacKenzie, & Olshavsky, 1996), business-to-business professional service usage (Patterson & Spreng, 1997), financial service usage (Montfort, Masurel, & Rijn, 2000), and vacation destination revisiting (Petrick, Morais, & Norman, 2001). EDT is also used in the IS literature to study IS continuance intention, electronic commerce service continuance, and Web customer satisfaction. Bhattacherjee (2001b) applied EDT to examine cognitive belief and affect influencing an individualÕs intention to continue using
+ Expectation (t1)
-
+
Disconfirmation
(t2) Perceived Performance (t2)
+
Satisfaction (t2)
+
Repurchase intention (t2)
+ +
Fig. 1. Expectancy disconfirmation theory. Note: t1 = pre-consumption variable; t2 = post-consumption variable.
402
C.-M. Chiu et al. / Computers & Education 45 (2005) 399–416
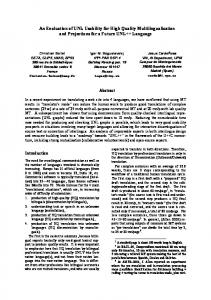
information systems. Bhattacherjee (2001a) applied EDT, Technology Acceptance Model (TAM) and agency theory to examine key drivers of consumersÕ intention to continue using business-tocustomer (B2C) e-commerce services in the online brokerage context. 2.2. Development of the research model This study proposes a decomposed expectancy disconfirmation theory (DEDT) model for e-learning continuance (see Fig. 2). The decomposed EDT model is adapted from the EDT and consumer behavior literature and integrated with theoretical findings from prior IS usage and success research. Two major post-usage constructs of EDT are perceived performance and disconfirmation. Perceived performance is defined as customersÕ perception of how product performance fulfills their needs, wants, and desires (Cadotte, Woodruff, & Jenkins, 1987). Spreng et al. (1996) defined perceived performance as ‘‘beliefs regarding the product attributes, levels of attributes, or outcomes’’. Prior work in the IT domain has represented perceived performance as perceived usefulness (Davis, 1989), perceived ease of use (Davis, 1989), and perceived compatibility (Taylor & Todd, 1995). McKinney et al. (2002) synthesized perspectives from the user-satisfaction literature in IS and customer-satisfaction literature in marketing to develop constructs for measuring perceived performance and disconfirmation in terms of information quality and system quality. Some studies (Hsu, Chen, & Chiu, 2003; Khalifa & Liu, 2002) interpreted perceived performance from the aspects of information quality, system quality, and service quality. McDougall and Levesque (2000) modeled service quality and perceived value as contributing factor to satisfaction. The American Customer Satisfaction Index (ACSI) model identifies perceived quality and perceived value as two distinct constructs for operationalizing perceived performance (Fornell et al.,
Perceived Usability
H7 Usability Disconfirmation Perceived Quality
H8 Quality Disconfirmation Perceived Value
H1
H4 H2 Satisfaction
H5
H10
E-Learning Continuance Intention
H3
H6
H9 Value Disconfirmation
Fig. 2. Research model for e-learning continuance.
C.-M. Chiu et al. / Computers & Education 45 (2005) 399–416
403
1996). Therefore, this study proposes to decompose the perceived performance construct of the EDT model into three components: usability, quality, and value. The proposed model suggests that usability, quality and, value are interrelated but can be conceptualized and measured as three distinct constructs. Their distinctness can be verified through discriminant validity analysis. A number of prior studies have provided empirical support for the relationships among these three constructs. For example, Patterson and Spreng (1997) found that perceived performance, similar to the perceived usability component of our model, is significantly associated with perceived value, while de Ruyter, Bloemer, and Peeters (1997) found that perceived performance (usability) is significantly associated with perceived quality. Researchers assert that perceived quality has a positive effect on perceived value. This is both intuitively true (Fornell et al., 1996) and demonstrated in prior studies (Cronin, Brady, & Hult, 2000; Dodds, Monroe, & Grewal, 1991; Sweeney, Soutar, & Johnson, 1997). However, this study focuses on examining the effects of usability, quality and value on their disconfirmations and satisfaction. The basic assumption is that e-learning continuance intention is determined by satisfaction, which is in turn jointly determined by perceived usability, perceived quality, perceived value, usability disconfirmation, quality disconfirmation, and value disconfirmation. Perceived usability refers to the extent to which a product or service can be used by specified users to achieve specified goals with effectiveness, efficiency and satisfaction in a specified context of use (ISO 9241-11, 1998). In this study, there are three key factors in usability: usefulness, ease of use, and compatibility. Davis, Bagozzi, and Warshaw (1989) theorized that people build positive attitudes toward using computer systems based largely on a cognitive appraisal of how it will improve their performance. Bhattacherjee (2001b) applied EDT to examine cognitive belief and affect influencing an individualÕs intention to continue using online banking services. The results suggested that perceived usefulness was a significant determinant of user satisfaction. Rai et al. (2002) empirically assessed the Seddon IS success model (Seddon, 1997) in a quasi-voluntary IS usage context and found significant paths from perceived usefulness and perceived ease of use to user satisfaction. Drawing on three established frameworks, namely TAM, Transaction Cost Analysis, and Service Quality (SERVQUAL), Devaraj, Fan, and Kohli (2002) conducted a study to examine consumer satisfaction with the e-commerce channel and found support for perceived usefulness and perceived ease of use as significant determinants of consumer satisfaction. Therefore, the following hypothesis is proposed: H1. Perceived usability is positively related to user satisfaction. Prior research has studied the effect of perceived quality on satisfaction from three dimensions: information quality, system quality, and service quality. Information quality is concerned with timeliness, relevance, and accuracy of information generated by an information system (Bailey & Pearson, 1983; DeLone & McLean, 1992; McKinney et al., 2002). Chae and Kim (2001) proposed a model of information quality to identify the important dimensions of information quality in increasing user satisfaction and customer loyalty for mobile Internet services. Results indicated that information quality had a significant effect on user satisfaction, which in turn, was significantly related to customer loyalty. Seddon and Kiew (1994) partially tested DeLone and McLeanÕs model of IS success. They found that there was strong support for the positive relationship between information quality and user satisfaction.
404
C.-M. Chiu et al. / Computers & Education 45 (2005) 399–416
System Quality is concerned with whether or not there are ‘‘bugs’’ in the system, the consistency of the user interface, ease of use, response rates in interactive systems, quality documentation, and sometimes, quality and maintainability of the program code (Seddon, 1997). Seddon and Kiew (1994) partially tested DeLone and McLeanÕs model of IS Success. The result indicated that system quality positively affected user satisfaction. Rai et al. (2002) empirically assessed the Seddon IS success model (Seddon, 1997) in a quasi-voluntary IS usage context and found a significant path from system quality to user satisfaction. Parasuraman, Zeithaml, and Berry (1985) suggested that service quality is derived from the comparison between what the customer feels should be offered and what is provided. In recognition of the expanded role of IS department and the importance of information systems (IS) and e-commerce (EC), researchers have begun to include service quality as a measure of IS satisfaction/success in recent years. The Service Quality (SERVQUAL) scale has been used in the measurement of IS service quality (Kettinger & Lee, 1994; Kettinger & Lee, 1997; Myers, Kappelman, & Prybutok, 1997; Pitt, Watson, & Kavan, 1995; Van Dyke, Kappelman, & Prybutok, 1997). The SERVQUAL scale contains five dimensions: tangibles, reliability, responsiveness, assurance, and empathy. Devaraj et al. (2002) found empirical support for the assurance as determinant in EC channel satisfaction. In a study of the impact of information technology (IT) on service quality in consumer-banking sector, Zhu, Wymer, and Chen (2002) found that customer perceived service quality had a significant effect on customer satisfaction. H2. Perceived quality is positively related to user satisfaction. Value is an abstract concept with meanings that vary according to context. In terms of personal value, value refers to ‘‘an enduring belief that a specific mode of conduct or end-state of existence is personally or socially preferable to an opposite or converse mode of conduct’’ (Rokeach, 1973). In consumer behavior, perceived value has been defined as ‘‘the consumerÕs overall assessment of the utility of a product based on perceptions of what is received and what is given’’ (Zeithaml, 1988). Rokeach (1973) classified values into two categories: terminal and instrumental. Terminal values are concerned with preferred end states (goals), for example, happiness and a comfortable life, while instrumental values are related to the ways of behaving to obtain goals, such as broadminded and capable. Kahle (1983) proposed a List of Value (LOV) inventory that contains nine values relevant to consumer behavior, including self-fulfillment, excitement, being well respected, sense of accomplishment, self-respect, sense of belonging, security, fun and enjoyment, and warm relationships with others. Bojanic (1996) suggested that high levels of perceived value result in purchase and ultimately higher levels of customer satisfaction. Spreng, Dixon, and Olshavsky (1993) argued that value should be a direct antecedent of satisfaction. Patterson and Spreng (1997) empirically examined the relationships between perceived value, satisfaction, and repurchase intention in the context of business-to-business professional services. They found that perceived value had a significant effect on customer satisfaction, which in turn had a significant effect on repurchase intentions. McDougall and Levesque (2000) examined the contribution of service quality and perceived value towards customer satisfaction and future intentions across four services. The results indicated that service quality and perceived value were significant determinants of customer satisfaction.
C.-M. Chiu et al. / Computers & Education 45 (2005) 399–416
405
H3. Perceived value is positively related to user satisfaction. Disconfirmation refers to the discrepancy between an individualÕs perceptions of a product or serviceÕs performance and his or her expectation levels (Oliver, 1980; Olson & Dover, 1979; Tse & Wilton, 1988). In this study, we define usability (quality and value) disconfirmation as an individualÕs perceptions of an e-learning serviceÕs usability (quality and value) and his or her expectation levels. In an application of EDT to the study of a retail service usage, Swan and Trawick (1981) found that disconfirmation had a significant effect on satisfaction. Oliver (1993) integrated EDT with affect augmentation to form an expanded attribute-based satisfaction model and applied it to the studies of automobile satisfaction and satisfaction with course instruction. He found that disconfirmation emerged as a major satisfaction influence for both automobile and course instruction studies. Spreng et al. (1996) indicated that expectation congruency (disconfirmation) had significant effects on attribute satisfaction and information satisfaction, which in turn had significant effects on overall satisfaction. Montfort et al. (2000) indicated that disconfirmation played a significant role in the prediction of satisfaction of a consumer of financial services. Some IS researches have provided empirical support for the relationship between disconfirmation and satisfaction. Bhattacherjee (2001b) found that performance (usability) disconfirmation is an important determinant of user satisfaction with the online banking system. In an application of EDT to the study of satisfaction with Internet-based services, Khalifa and Liu (2002) found that disconfirmation is significantly associated with satisfaction. By synthesizing the above findings, we propose the following hypotheses: H4. Usability disconfirmation is positively associated with user satisfaction. H5. Quality disconfirmation is positively associated with user satisfaction. H6. Value disconfirmation is positively associated with user satisfaction. According to EDT, disconfirmation is determined by the combination of the expectation and perceived performance. Positive disconfirmation arises when the perceived performance exceed oneÕs expectations. In other words, all things being equal, the higher an individualÕs perceptions of a product or serviceÕs performance, the more likely that perceived performance can exceed expectation levels, resulting in a positive relationship between perceived performance and disconfirmation (Patterson et al., 1997). In a study of determinants of consumer satisfaction, Spreng et al. (1996) found that perceived performance was positively related to expectation congruency (disconfirmation) for camcorder usage. In a study of users satisfaction with Internet-based services, Khalifa and Liu (2002) found that perceived performance exerted a strong effect on disconfirmation. Therefore, the following hypotheses are proposed: H7. Perceived usability is positively associated with usability disconfirmation. H8. Perceived quality is positively associated with quality disconfirmation. H9. Perceived value is positively associated with value disconfirmation. Satisfaction is an individualÕs feelings of pleasure or disappointment resulting from comparing a productÕs perceived performance (or outcome) in relation to his or her expectations. Oliver (1980) theorizes that satisfaction is positively correlated with future intention, both directly and
406
C.-M. Chiu et al. / Computers & Education 45 (2005) 399–416
indirectly via its impact on attitude. In the final step of satisfaction formation processes, satisfaction determines intentions to patronize or not to patronize the store in the future (Swan & Trawick, 1981). Swan and Trawick (1981) found a significant satisfaction-intentions correlation within a retail service context. Patterson and Spreng (1997) found a strong link between satisfaction and repurchase intentions in the context of business-to-business professional services. Bhattacherjee (2001b) indicated that satisfaction was a significant predictor of IS continuance in the context of online banking services. Van Riel, Liljander, and Jurriens (2001) found a strong positive effect of satisfaction on the intention to continue using a portal site. Therefore, the following hypothesis is proposed: H10. User satisfaction is positively associated with continuance intention.
3. Research methodology 3.1. Sample, setting, and procedures The sample for the study was taken from 10 class sections that were conducted using an e-learning service in the continuing education program of a university in Taiwan. Electronic learning may be delivered via blend of asynchronous and synchronous technologies. Synchronous e-learning service consists of real-time interaction between learners and instructors, facilitated by technological tools such as videoconferencing, teleconferencing, chat rooms, etc. Asynchronous e-learning service is a self-study that may be supplemented by non-real time interaction with the instructor, for instance through email, voice mail, message boards, forums, and threaded discussions. The e-learning service of this study is an asynchronous Web-based learning system, supplemented by non-real time interaction with the instructor through email, message boards, and forums. A total of 500 surveys were distributed to individuals who at least took one course offered by the e-learning service. A total of 189 surveys were returned. The exclusion of responses from incomplete questionnaires resulted in a total of 183 usable questionnaires (a net response rate of 36.6%). Among the respondents, 54% had taken one online course, 38% had taken two or three online courses, and 8% had taken at least four online courses. On average, the respondents were 32 years old and had 5.1 years of experience in using the WWW to browse information. A pretest of the questionnaire (including all constructs) was conducted using six experts in the IS research area to assess logical consistencies, ease of understanding, sequence of items, and task relevance. Overall, the experts indicated that the questionnaire was relatively clear and easy to complete. A number of suggestions were made concerning the wording of several items and the overall structure of the questionnaire, and these suggestions were incorporated into the revised instrument. Furthermore, a pilot study involving 30 part-time master students who had taken an on-line course was also conducted. The purpose of the pilot study was to gain additional feedback about the questionnaire instrument. Respondents were asked to provide any comments on the questionnaire content and structure. For the main study, the questionnaires were distributed to the selected subjects with a cover letter indicating the purpose and importance of the study. All respondents were guaranteed
C.-M. Chiu et al. / Computers & Education 45 (2005) 399–416
407
confidentiality of individual responses. In order to maximize the response rate, a small gift was provided with the survey, and follow-up mails were made to individuals not having responded after three weeks. 3.2. Instrument Table 1 lists the instrument for the research construct. Items measuring continuance intention were adapted from prior work by Bhattacherjee (2001b) and Mathieson (1991). Items related to satisfaction were adapted from prior work by Oliver (1980) and Spreng et al. (1996). Items for perceived usability sampled the dimensions of perceived usefulness, perceived ease of use, and perceived compatibility. Items for perceived usefulness and perceived ease of use were adapted from prior work by Davis (1989). Items for measuring perceived compatibility were adapted from prior work by Taylor and Todd (1995). Items for perceived quality sampled the dimensions of the service quality, information quality, and system quality. Items for information quality and system quality were adapted from McKinney et al. (2002), whereas items for service quality was derived from Kettinger and Lee (1994, 1997). Items for measuring perceived value were adapted from the List of Value (LOV) (1983) and the Rokeach Value Survey (RVS) (1973). For the aforementioned measures, a 7-point Likert type was used, with anchors ranging from strongly disagree (1) to strongly agree (7). There are two main approaches to measuring disconfirmation: inferred and perceived (Swan & Trawick, 1981). The inferred (subtractive) disconfirmation approach, deriving from comparison level theory, assumes that disconfirmation can be expressed as a function of the algebraic difference between the perceived performance and expectation (Tse & Wilton, 1988). The perceived (subjective) disconfirmation represents a subjective evaluation of the discrepancies between the perceived performance and expectation (Tse & Wilton, 1988); that is, the userÕs perception that the perceived performance is better or worse than expected (Swan & Trawick, 1981). Oliver (1980) argues that subtractive disconfirmation is a comparative process that may lead to an immediate satisfaction judgment, whereas ‘‘subjective disconfirmation represents an intervening distinct cognitive state resulting from the comparison process and preceding a satisfaction judgment’’ (p. 460). Tse and Wilton (1988) suggest using the subjective disconfirmation approach under the condition that the model theorizes direct relationships between satisfaction and perceived performance, expectation and disconfirmation simultaneously, since expressing disconfirmation as ‘‘a subtractive function of the remaining two independent variables will induce overspecification of the customer satisfaction or dissatisfaction (CS/D) model’’. Subjective disconfirmation, as an independent construct that influences consumer satisfaction, is free of such confounding (Tse & Wilton, 1988). Most of the studies concerning user satisfaction use the subjective disconfirmation approach (Bhattacherjee, 2001b; Churchill & Surprenant, 1982; McKinney et al., 2002; Oliver, 1980; Spreng et al., 1996; Wirtz & Bateson, 1999), considering disconfirmation as a distinct evaluative construct. Therefore, this study employed subjective approach to measuring disconfirmation. Items for measuring usability disconfirmation, quality disconfirmation, and value disconfirmation with the e-learning service were adapted from Oliver (1980) ‘‘better than expected/worse than expected’’ scale. For this measure, a 7-point Likert type was used, with anchors ranging from strongly disagree (1) to strongly agree (7).
408
C.-M. Chiu et al. / Computers & Education 45 (2005) 399–416
Table 1 Summary of measurement scales Construct
Measure
Mean
Standard deviation
Loading
5.69
1.12
0.70
5.71
1.05
0.70
5.43
1.10
0.68
5.97
0.98
0.71
5.30
1.11
0.83
5.53
1.03
0.77
5.38
1.01
0.73
5.5
0.96
0.72
5.19
1.05
0.84
5.77
0.97
0.68
5.24
1.03
0.91
5.33
1.04
0.85
5.34
0.88
0.70
5.49 5.21 5.44
1.03 1.03 0.93
0.77 0.81 0.78
5.10
1.15
Perceived usability (PU) Composite reliability = 0.90 PU1 PU2 PU3 PU4 PU5 PP6
Learning to operate the e-learning service is easy for me It is easy for me to become skillful at using the e-learning service Using the e-learning service can improve my learning performance Using the e-learning service can simplify the learning process Using the e-learning service fits well with the way I learn The setup of the e-learning service is compatible with the way I learn
Usability disconfirmation (UD) Composite reliability = 0.88 UD1
UD2
UD3
UD4
UD5 UD6
The e-learning serviceÕs performance that learning to operate the e-learning service is easy was better than expected The e-learning serviceÕs performance that is easy to become skillful at using the service was better than expected The e-learning serviceÕs performance that can improve my learning performance was better than expected The e-learning serviceÕs performance that can simplify the learning process was better than expected The e-learning serviceÕs performance that fits with the way I learn was better than expected The e-learning serviceÕs performance that the setup of the e-learning service is compatible with the way I learn was better than expected
Perceived quality (PQ) Composite reliability = 0.88 PQ1 PQ2 PQ3 PQ4 PQ5
The layout and user interface design of the e-learning Web site is friendly It is easy to navigate the e-learning Web site The e-learning Web site provides the service I need I feel comfortable in using the functions and services provided by the e-learning Web site The e-learning Web site provides complete information
0.78 (continued on next page)
C.-M. Chiu et al. / Computers & Education 45 (2005) 399–416
409
Table 1 (continued) Construct
Measure
Mean
Standard deviation
Loading
PQ6
The e-learning Web site provides information that is easy to comprehend
5.06
1.06
0.74
5.04
1.12
0.73
5.13
1.11
0.71
4.89
1.17
0.85
5.14
1.10
0.82
4.93
1.10
0.79
4.98
1.09
0.79
5.15
1.08
0.84
5.13
1.12
0.88
5.51
1.05
0.74
5.45
1.06
0.80
4.92 5.32
1.32 1.05
0.73 0.72
5.06
1.11
0.89
5.07
1.17
0.94
5.32
1.14
0.81
5.26
1.08
0.85
Quality disconfirmation (QD) Composite reliability = 0.89 QD1
QD2 QD3 QD4
QD5 QD6
The e-learning serviceÕs quality that the layout and user interface design of the Web site is friendly was better than expected The e-learning serviceÕs quality that is easy to navigate the Web site was better than expected The e-learning serviceÕs quality that provides the service I need was better than expected The e-learning serviceÕs quality that makes me feel comfortable in using the functions and services was better than expected The e-learning serviceÕs quality that provides complete information was better than expected The e-learning serviceÕs quality that provides information that is easy to comprehend was better than expected
Perceived value (PV) Composite reliability = 0.90 PV1 PV2 PV3 PV4 PV5 PV6
Using the e-learning service would give me a sense of accomplishment Using the e-learning service would give me a sense of selffulfillment Using the e-learning service would give me a sense of following the trend Using the e-learning service would give me a sense of fun and enjoyment Using the e-learning service would give me a sense of intelligence Using the e-learning service would give me a sense of independence
Value disconfirmation (VD) Composite reliability = 0.93 VD1 VD2 VD3 VD4
The e-learning serviceÕs value that gives me a sense of accomplishment was better than expected The e-learning serviceÕs value that gives me a sense of self-fulfillment was better than expected The e-learning serviceÕs value that gives me a sense of following the trend was better than expected The e-learning serviceÕs value that gives me a sense of fun and enjoyment was better than expected
(continued on next page)
410
C.-M. Chiu et al. / Computers & Education 45 (2005) 399–416
Table 1 (continued) Construct
Measure
Mean
Standard deviation
Loading
VD5
The e-learning serviceÕs value that gives me a sense of intelligence was better than expected The e-learning serviceÕs value that gives me a sense of independence was better than expected
4.90
1.23
0.83
5.18
1.18
0.81
5.33 5.51 5.39
0.95 0.88 1.04
0.84 0.83 0.93
5.49 5.44 5.35
1.01 1.06 1.07
0.94 0.97 0.89
VD6
User satisfaction (US) Composite reliability = 0.90 US1 US2 US3
I am satisfied with the performance of e-learning service I am pleased with the experience of using the e-learning service My decision to use the e-learning service was a wise one
Continuance intention (CI) Composite reliability = 0.94 CI1 CI2 CI3
I intend to continue using the e-learning service in the future I will continue using the e-learning service in the future I will regularly use the e-learning service in the future
4. Data analysis 4.1. Measurement model The measurement model was first evaluated in terms of reliability, convergent validity, and discriminant validity. Reliability was examined using the CronbachÕs alpha values. As shown in Table 1, all were above 0.7; this indicates a commonly acceptable level for explanatory research. Table 2 Correlations and AVE Construct
AVE
PU UD PQ QD PV VD US CI
0.54 0.63 0.58 0.61 0.62 0.73 0.76 0.87
Construct PU
UD
PQ
QD
PV
VD
US
CI
0.74 0.71 0.54 0.51 0.53 0.47 0.55 0.52
0.80 0.57 0.61 0.62 0.57 0.66 0.60
0.76 0.73 0.60 0.57 0.55 0.50
0.78 0.57 0.58 0.56 0.48
0.79 0.75 0.68 0.64
0.85 0.68 0.63
0.87 0.83
0.93
Note: diagonal elements (in bold) represent the square root of the average variance extracted (AVE). Off-diagonal elements represent the correlations among constructs. For discriminant validity, diagonal elements should be larger than off-diagonal elements. PU, perceived usability; UD, usability disconfirmation; PQ, perceived quality; QD, quality disconfirmation; PV, perceived value; QD, value disconfirmation; US, user satisfaction; CI, continuance intention.
C.-M. Chiu et al. / Computers & Education 45 (2005) 399–416
411
Convergent validity was evaluated for the measurement scales using two criteria suggested by Fornell and Larcker (1981): (1) all indicator factor loadings should be significant and exceed 0.70 and (2) average variance extracted (AVE) for each construct should exceed the variance due to measurement error for that construct (i.e., should exceed 0.50). As shown in Table 1, most items exhibited loading higher than 0.7 on their respective constructs, providing evidence of acceptable item convergence on the intended constructs. Two exceptions were the third item of the perceived usability scale and the fourth item of the usability disconfirmation scale, which loadings were slightly below 0.7. AVE ranged from 0.54 to 0.87 (see Table 2), greater than variance due to measurement error. Hence, all two conditions for convergent validity were met. For satisfactory discriminant validity, the square root of the AVE from the construct should be greater than the correlation shared between the construct and other constructs in the model (Fornell & Larcker, 1981). Table 2 lists the correlations among constructs, with the square root of the AVE on the diagonal. The diagonal values exceed the inter-construct correlations; hence the test of discriminant validity was acceptable. Therefore we conclude that the measure for each construct satisfies construct validity. 4.2. Model testing results The research model was tested using LISREL 8.50. Using sample covariance matrices, the overall fit and the explanatory power of research model were examined, together with the relative strengths of the individual causal path. Six common model-fit measures were used to assess the modelÕs overall goodness-of-fit: normed chi-square (chi-square divided by degrees of freedom: v2/df), goodness-of-fit index (GFI), normed fit index (NFI), non-normed fit index (NNFI), and comparative fit index (CFI). The v2 value indicates the degree of correspondence, or the ‘‘goodness-of-fit’’, between a proposed model and the empirical data. This statistic is sensitive to sample size, and thus the normed chi-square is an alternative measure of model fit. The GFI is analogous to a squared multiple correlation; it indicates the proportion of the observed covariance explained by the model covariance (Kenny, 1998). The NFI indicates the proportion in the improvement of the overall fit of the researcherÕs model relative to a null model, typically the ‘‘independence’’ model. The NNFI is the NFI adjusted for model complexity. CFI indicates reduction in model misfit of a target model relative to a baseline (independence) model. For models with good fit, it is suggested that v2/df should not exceed 5 (Bentler, 1989), and NFI, NNFI, GFI, and CFI should exceed 0.9. As shown in Table 3, all indices exceeded their respective common acceptance levels, suggesting that the research model provided a good fit to the data. The significance of individual paths was examined and summarized in Fig. 3. Eight out of ten paths exhibited a P-value of