Usage of mobile location techniques for UMTS network planning in urban environment S. Ahonen, J. Lähteenmäki, H. Laitinen and S. Horsmanheimo VTT Information Technology, Networks Tekniikantie 4B, FIN-02150 Espoo, Finland Tel: +358 9 4561, Email:
[email protected]
ABSTRACT The paper addresses the use UMTS terminals for “probing” the signal level as a function of location for the purposes of network planning and monitoring. Potential UMTS location techniques are presented and the location performance of time delay and correlation based techniques is estimated by using impulse responses calculated by three-dimensional simulation techniques. The probing accuracy is estimated by carrying out simulations with different location accuracy levels. The Database Correlation Method (DCM) seems potential for supporting network planning applications. I. INTRODUCTION Mobile location techniques have been under strong development during the last years. One of the driving forces has been the decision of making it mandatory to locate mobile phones in connection with emergency calls (requirement set by the United States Federal Communications Commission, FCC). Mobile phone location is also seen as an important catalyst for wireless data communications - for example WAP services will gain additional value if they can take advantage of the information of the user location. This paper addresses network planning as a new application area for mobile location technology. In particular, location techniques in UMTS (Universal Mobile Telecommunications System) are considered and their capability to support network planning is evaluated. The work has been partly carried out in the framework of the IST-CELLO project, where Locationaided Planning [3] is one of the key research areas. Knowing the received signal level as a function of location is a key issue in network planning. The signal level information is used for coverage planning, interference analysis and neighbour planning. Coverage prediction tools are commonly used for obtaining signal levels throughout the service area. In addition, specific field measurements are needed in order to check and verify prediction results as well as to detect possible
network faults, such as problems with base station antennas. Considerable cost savings can be achieved if dedicated field measurements can be replaced by measurement reports provided by standard mobile phones. These kind of "probing" techniques have already been applied for estimating travel times of cars in road traffic information systems [2]. This paper investigates possibilities of adopting probing techniques for planning and monitoring of UMTS networks. In particular, the paper addresses accuracy of signal level probing, but the same technique can also use for probing of the power delay profile. There are several possible location technology approaches as will be described in Section II. The most critical issue is achievable location accuracy. Section III describes a test environment for simulating different location techniques and Section IV presents simulation results for two different location algorithms. Based on the level of expected location accuracy, Section V evaluates the error distribution for estimating the signal level. Section VI discusses the obtained results and presents the conclusions. II. UMTS LOCATION TECHNIQUES Location techniques suitable for locating UMTS terminals have been dealt with e.g. in [5,6,8]. The most accurate approach is to include a GPS (Global Positioning System) module in the terminal. This yields an accuracy of around 10 metres in open areas. In urban environment the line of sight paths to satellites are often blocked leading to degraded accuracy and availability. Location techniques based on standard signals of the network are attractive since the integrated GPS module, which increases terminal cost and power consumption, can be avoided. In the OTDOA technique (Observed Time-Difference of Arrival) the time difference of signals of base station pairs are measured at the terminal. Time differences can be measured accurately by using the WCDMA (Wideband Code Division Multiple Access) signals. Time-difference measurements of combinations of three base stations
provide enough information for a two-dimensional coordinate solution. One problem of the OTDOA technique is the so-called hearability problem. The weak signals of far-away base stations are blocked by the strong signals of nearby base stations. This effect can be reduced by using idle periods, which means that each base station in turn switches its transmitter off. The idle period length can vary, typically it is between 5 and 10 CPICH symbols. During the idle period when the blocking base station is off the terminal can receive signals from other base stations.
base station antenna heights are between 8…20 m depending on the surrounding building rooftop levels. The mean distance between the base stations is approximately 210 m. The network structure corresponds to foreseen typical UMTS network implementation in urban areas.
Due to large bandwidth the OTDOA is inherently more accurate than the corresponding time-delay techniques in GSM. However, the accuracy is severely degraded due to multipath propagation in urban environment. Often the line of sight propagation path does not exist and consequently signal delays do not correspond to the actual geometrical delays. An alternative approach, circumventing the multipath problem, has been proposed and has been tested in operational GSM network [1]. This technique (Database Correlation Method, DCM) takes advantage of a priori collected database consisting of measured or predicted signal levels on the service area. The location algorithm compares signals received by the terminal with the signal information stored in the database. The first tests indicate accuracy of 45 m (67%) in urban areas.
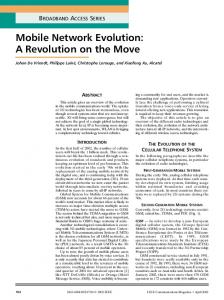
Figure 1. The microcell test network base stations. The receiving grid area is defined by the square.
When applied to UMTS the DCM technique can take advantage of the wide bandwidth by including radio channel impulse response data in the signal database. This data consists typically of amplitudes and delays of the most significant signal components. On the other hand, the performance may turn out to be lower than in GSM due to the hearability problem, which reduces the number of usable base stations.
The radio propagation environment in the urban microcell is characterised by multipath propagation, shadowing and pathloss. The multipath channel of the test network is modelled by computing the radio channel impulse responses with the ray-tracing tool. The impulse responses are calculated from each base station to each receiving point. The receiving points form a grid of size 572 points with 12.5 m resolution (inside the square in Figure 1). The mobile terminal height is 1.5 m. The calculations are made at the downlink frequency 2.15 GHz with 33 dBm transmission power.
At first sight adopting the DCM technique for probing of received signal strength may sound inappropriate, since the DCM algorithm requires the signal levels already as input. However, DCM is still an appropriate technique in the typical case that one or a few new base stations are added to the existing network. In this case the existing base stations can be used to provide the location for signal samples received from the new base stations.
The time delay estimation in UMTS is based on the common pilot channel (CPICH) signal, which is unique for each cell sector. The system level environment and the location algorithms used in these simulations are created in MATLAB. The simulation environment consists of the transmission code generation for CPICH (spreading, scrambling and pulse shaping), radio channel, delay estimation and location algorithms. The main system level parameters are given in Table 1.
III. TEST ENVIRONMENT FOR LOCATION TECHNIQUES The test environment includes the network and the UMTS system level environment. The test network is illustrated in Figure 1 and consists of 24 microcell base station sites with 1-3 directional antennas (half-power beamwidth 82°, gain 10.2 dBi) in each. It is constructed in 1 km2 area by using the GUI of the Microcell Tool (MCT) featuring full 3D-ray-launching method. The
Table 1. System level simulation parameters Parameter Carrier frequency Chip rate Oversampling rate Modulation scheme Pilot length used for location Pulse shaping roll off factor, α
Value 2.15 GHz 3.84 Mchip/s 4 QPSK 3 × 256 chips 0.22
The delay estimation at the reception is made by correlating the received signal with the code used on transmission thus obtaining the PDP of the channel. A threshold value is set in order to reduce contributions of noise power and interference from other codes. Under the determined threshold the signal is regarded as null and the delay profile above the threshold is stored in the database. The first peak of the correlation output obtained from these cut PDPs determines the time of arrival (TOA) of the received signal for the OTDOA algorithm. The DCM algorithm takes advantage of the entire measured PDP above the threshold. Point A (corr 0.988)
25
DB #A Meas #A
DB #B Meas #A
20 Amplitude [dB]
Amplitude [dB]
20 15 10 5 0
Point B (corr 0.916)
25
10 20 30 40 50 Sample
0
0
10 20 30 40 50 Sample
The OTDOA algorithm is implemented as described in [4] except the covariance matrix Q_r is not used but is assumed to be a unit matrix (i.e. LS solution instead of WLS). In the DCM algorithm the received delay profile from the strongest base station is correlated with the database. The cross-correlation between the PDP vectors (x, y) can be defined as N −1
∑ x(n − m)y(n) ,
n=0
The location accuracy in the test network is surveyed by OTDOA and DCM simulations. The performance measure used in this paper is the cumulative distribution function (CDF) of the absolute position error in metres. Figure 3 shows the obtained CDF of the location error for the OTDOA and DCM simulations. The location estimates are made only at the outdoor points. 100 90 80 70 60 50 40 30 DCM: 67% 25m OTDOA: 67% 215m
20 10 0
0
100
200 300 Error [m]
400
500
10
Figure 2. The cross-correlation between the measured delay profile (dashed line) and the delay profiles in adjacent database points, A and B (solid lines). The location estimate is given based on the correlation. Here the point A coordinates are chosen (true location).
R xy (m) =
IV. LOCATION ACCURACY
Figure 3. Cumulative distribution of location error in dense urban environment. Dashed line: OTDOA (67 % error is 215 m), solid line: DCM (67 % error is 25 m).
15
5
0
where m=0, ±1,..., ±(N-1) and N is the length of the PDP vector. The receiving point with the highest correlation coefficient is taken to represent the coordinates of the mobile terminal as illustrated in Figure 2.
CDF [%]
The influence of the modelled radio channels on transmitted codes is achieved by convolving the codes with the calculated impulse responses. In the DCM simulations, two realisations of the channel at each receiving point are used. The first, which is directly given by the ray-tracing tool, is used to calculate the power delay profile (PDP) database. The second realisation is needed to simulate the PDP measured by the terminal to be located. In the second realisation fast fading and shadowing effects are incorporated into the measured PDPs by randomly changing the amplitudes and phases of the channel impulse responses. The modelled random attenuation for each ray is a uniformly distributed random number between 0 and 1.
(1)
It is clearly seen from the simulation results that multipath propagation and NLOS situations in the dense urban environment degrade the performance of the OTDOA algorithm. The time of arrival estimation process in multipath conditions is very difficult which degrades the OTDOA accuracy due to unrealistic delay values compared to the direct route delay value. It can be seen (Figure 3) that the DCM gives much more accurate results than OTDOA. However, the DCM accuracy is degraded in the areas where there is a large number of measured delay profiles but none of which is noticeably stronger than the others. This happens due to high interference level caused by a large number of base stations in the surroundings which causes problems also for the time of arrival estimation in OTDOA. V. PROBING ACCURACY
Probing accuracy refers to the difference of the real signal level of a pixel compared to the “shifted” signal level caused by location error as well as the error caused by limited measurement accuracy of the mobile phone. Probing accuracy was simulated with the help of the set
The simulations were carried out for six different values (10 m ... 300 m) of the standard deviation of the location error. The smallest errors correspond to accuracy currently achievable by using satellite positioning (GPS). The error range 50-300 m corresponds to the range that could be achieved by network-based location techniques in 2G and 3G systems in urban environments. The simulations were also repeated for two averaging values: 1 and 15. Averaging is possible when several mobile phones send a measurement report from the same pixel during the observation time. The observation time in adaptive coverage systems is limited to the time that antenna patterns are constant. Otherwise, observation time may be even several days. The simulation steps were repeated 10000 times. The mobile phone measurement inaccuracy was assumed to be 3 dB (r.m.s.). When selecting the true signal value in step 1, -90 dBm was considered as the minimum acceptable value. Figure 4 shows cumulative distribution of probing error corresponding to 50 m location error. It can be seen that the probing error deviates clearly from the normal distribution. This effect is caused by the finite pixel size and becomes stronger for the smaller location errors. For higher location errors the distribution approaches normal distribution as expected. Results for different values of location error standard deviation are shown in Table 2. It can be seen that averaging over 15 observations considerably improves the probing accuracy. Increasing the averaging factor beyond 15 did not give notable improvement. The mean probing error increases as the location error increases. The mean error is a consequence of the - in average circular shape of the coverage areas: a randomly chosen point at a given distance of a reference point has (in average) a lower received power than the reference point. The r.m.s. probing error as a function of standard deviation of location error is shown in Figure 5. The minimum acceptable level of accuracy can be fixed at 10 dB. This is approximately the same level as can be
1 0.9 0.8
Cumulative probability
1) Randomly select a true signal value (random base station and pixel) 2) Simulate normally distributed location error 3) Find a new shifted signal value by taking the predicted value at a coordinate point shifted by the location error. 4) Calculate signal level error as difference between true and shifted value 5) Add normally distributed error caused by measurement inaccuracy 6) Repeat steps 1-5 several times in order to obtain the error distribution of the received signal level.
obtained by prediction tools in urban environments without tuning measurements [7]. In order to achieve this level of accuracy, averaging should be used and the location accuracy should be about 70 m (r.m.s). In case probing is used for verification and tuning of prediction models the accuracy should be better - maximum probing error should be of the order of 6 dB r.m.s. This corresponds to location accuracy requirement of 20 m.
0.7 0.6 0.5 0.4 0.3 0.2 0.1 0
0
5
10
15 20 25 RX power level error [dB]
30
35
40
Figure 4. Cumulative distribution of probing error (location error std. = 50 m). Solid thick line: averaging=15, dashed thick line: no averaging. Thin lines: corresponding cumulative normal distributions. Table 2. Mean and standard deviation of probing error. Location error, std. 10 m 20 m 50 m 100 m 200 m 300 m
mean/std. [dB] no averaging -0.8 / 7.4 -0.1 / 11.0 1.7 / 16.3 3.9 / 19.5 6.5 / 22.2 7.9 / 22.7
mean/std. [dB] averaging = 15 -0.8 / 3.5 -0.3 / 6.2 1.6 / 9.1 3.9 / 11.0 6.7 / 12.7 8.3 / 13.3
25
20
Signal level error [dB]
of predicted coverage areas of the test environment described in Section III. The following simulation steps were performed:
15
10
5
0
0
50
100 150 200 Standard deviation of location error [m]
Figure 5. R.m.s. probing error. Solid line: averaging=15, dashed line=no averaging.
250
300
VI. DISCUSSION AND CONCLUSIONS
ACKNOWLEDGEMENT
According to the results of Section IV the accuracy of OTDOA (215 m, 67%) is not adequate for probing of the signal level in urban area. This is the case even if sophisticated OTDOA algorithms could improve the location accuracy to some extent. In [5,6] location accuracy of 68-199 m (67%) are reported for OTDOAIPDL simulations using different urban channel models. DCM yields accuracy of 25 m, which is of the order of accuracy requirement (20-70 m, r.m.s). In DCM potential improvements are possible:
This work has been partly performed in the framework of the project IST CELLO, which is partly funded by the European Community. The Author(s) would like to acknowledge the contributions of their colleagues from VTT Information Technology, Cosmote Mobile Telecommunications S.A., Center for PersonKommunikation, Elisa Communications Corporation, Motorola S.p.A, Institute of Communication and Computer Systems / National Technical University of Athens, Teleplan AS.
•
•
The DCM algorithm used in simulations takes advantage only of the delay profile from the strongest base station. Using several delay profiles (base stations) instead of one could improve the performance. Dual-mode (GSM/UMTS) terminals could use also the GSM signals for improved location performance.
Despite of the possible improvements it is difficult to achieve the highest location accuracy requirement of 20 m needed in tasks such as tuning and verification of propagation models. The simulated accuracy of DCM may be too optimistic due to imperfections in shadowing modelling. The modelled shadowing does not cover situations in which the signal from a certain direction is totally obstructed. In addition, the accuracy of ray-tracing and environment model has an effect and therefore the correspondence between the mobile terminal measurements and database may be lower than in simulations. Currently, GPS seems to be the best approach, providing the sufficient level of precision. As GPS also has performance problems due to blocking especially in urban areas, it is relevant to consider other alternative approaches. One possibility would be to use a network of distributed short-range radio transmitters, e.g. based on Bluetooth technology. With the help of short-range transmitter the location of the terminal is known with the accuracy of the order of the transmitter coverage area, which may be even as low as 10m. This way it would be possible to establish a group of test points covering the most critical areas of the network. These test points would also provide reference information for calibrating other, less accurate, location methods. This way, also the accuracy outside the short-range transmitter coverage areas would be improved.
REFERENCES
[1] H. Laitinen, J. Lähteenmäki, T. Nordström, "Database correlation method for GSM location", IEEE VTC 2001 Spring Conf., 6.-9. May 2001, Rhodes. [2] J.-L. Ygnace, "The STRIP project findings and issues", Travel Time Estimation Workshop, Avignon, 8-9 November 2001. [3] J. Lähteenmäki, S. Kyriazakos, P. Fournogerakis, H. Laitinen, "Using Mobile Location Techniques for Network Planning and Handover Optimisation", 3G Infrastructures and Services Symposium, 2.-3.7. 2001, Athens. [4] M.A. Spirito, "Accuracy of Hyperbolic Mobile Station Location in Cellular Networks", Electronics Letters, vol. 37, No. 11, 2001, pp. 708710 [5] D, Porcino, ”Performance of A OTDOA-IPDL Positioning Receiver for 3G-FDD Mode”, in Proceedings of 3G Mobile Communication Technologies Conference, No. 477, IEE, 2001 [6] B. Ludden, L. Lopes, "Cellular Based Location Technologies For UMTS: A Comparison Between IPDL And TA-IPDL", ", in Proceedings of IEEE 51st Vehicular Technology Conference, Spring 2000, pp.1348-1353 [7] E. Damosso (ed.), “Digital mobile radio towards future generation systems“, COST 231 Final report, 1999, 471 p. [8] J. Syrjärinne, "Wireless-assisted GPS, Keeping Time With Mobiles", GPS World Magazine, January 2001, pp.22-31