A framebuffer (FB) is a block of memory and special- ized hardware that feeds the contents of the memory to a raster display ... As the raster is painted on the sck,.
Behavior Research Methods, Instruments, & Computers 1986. 18 (6). 587-594
Use of a raster framebuffer in vision research ANBKEW B. WATSON, KENNETH R. K. NIELSEN, ALLEN POffiSON,ANDREW FITZHUGH, AMYJO BILSON, KHANH NGUYEN, and ALBERT J. AHUMADA, JR, NASA Ames Research Center, Moffett Field, California
For the study of human and animal vision, the video framebuffer is the only technology that is capable of displaying two-dimensional images with precise control of contrast, luminance, and display timing. The video framebuffer also allows precise control of color. However, this device is not designed for precise psychophysical displays, and techniques mast be developed to use them in this role. In this paper, we describe a number of basic methods used in our lab. In order to be concrete, we use an Adage RDS-3000 raster display system (Adage, 1982)as an example, since that is the device we have actually used. The Adage is hosted by a PDP-11/73under the Venix operating system. The principles generalize to other machines. Where it clarifies the issues, we have shown the syntax of the software routines involved, Modern study of the properties of human and animal vision often requires a device capable of displaying twodimensional images with precise control of contrast, luminance, and display timing. Precise control of color is also desirable. The video framebuffer is the only technology that provides these capabilities. We begin with a brief introduction to the basics of framebuffers and raster displays; a more complete introduction is given in the Raster Graphics Handbook (The Conrac Corp., 1985). A framebuffer (FB) is a block of memory and specialized hardware that feeds the contents of the memory to a raster display (see Figure 1). FB memory is organized into P planes, each of N rows X M columns x b bits. In our system, there are four planes, red, green, blue, and alpha, each 1,024 wide X 1,024 high x 8 bits deep. A raster display is a system in which a beam traverses a screen in a regular pattern, usually in horizontal lines, from left to right, and with successive lines from top to bottom. The complete set of lines forms a rectangular raster on the screen. As the raster is painted on the s c k , selected values are read out of the FB, transformed digitally in various ways, and passed through a digital-toanalog converter (DAC). The resulting voltage is used to brighten or dim the beam. Each separately controllable spot on the screen is known as a pixel. In our configuration, the display is 512 x 512 pixels. By setting the contents of the framebuffer to appropriate values, one can make an image appear on the screen. In a noninterlaced configuration, such as the one we describe here, the raster is typically refreshed (redrawn) once every Vw of a second. Several components may intervene between the FB and the DAC: 1. Video path. The data travel from the FB to the monitor along a video path. Various devices intervene along Reprint requests should be mailed to Andrew B. Watson, MS 239-3, NASA Ames Research Center, Moflett Field, CA 94035.
this path to modify the data, thus controlling the final appearance of the display screen. 2. Frame Buffer Controller (FBC). This device controls the manner in which the data are read out of the FB and placed on the data path. Two features of the FBC are particularly important. The window defines the region of the FB from which data will be read (see Figure 2). If many images are stored in memory, the window determines which image will appear on the screen. The window is typically specified by the coordinatesof the upper left corner of the selected FB region, w i u and win__y. If an image is to be moved, the motion is effected by scrolling the window across the FB. The second important control is the viewport, which controls where on the screen the selected data will appear. It is defined by the coordinatesof the upper left corner ( v w ~vw__y) , and by width and height (vw-width, vwJeight). Screen pixels outside the viewport are ass (typically 0). By setting the appropriate entry in the lookup tables (LUTs; see below), a user may set this background area to a desired luminance. The viewport thus hlows one to define and display images much smaller than
blue green red 1024
1024
8
I
8
t
8 *
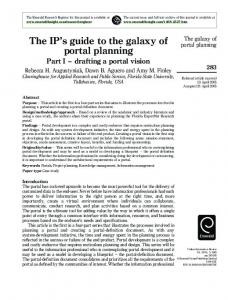
Figure 1. Overview of a raster fremebufftrdisplay system. FOOT a fraroebuffer confeed a video path trolkr, a crossbar switch, and a lookup table.
-of
588
WATSON, NIELSEN, POIRSON, FTTZHUGH, BILSON, NGUYEN, AND AHUMADA Framebuffer
window
Look-up tables (LUTs). The data in each of the lower three 8-bit planes of the video path act as addresses into a set of three tables, each containing 256 entries of 10 bits each. The three selected entries are sent to three 10bit DACs, which, in turn, drive the monitor. As noted below, these tables provide a means of linearizing the display, of rapidly changing the contrast of the display without changing the FB contents, and of selecting which bit planes are to be shown. In the Adage RDS-3000, there are, in fact, 1,024 entries in each table, divided into four separate tables. The in-cursor bit and the LUT page bit select which of the four tables is used. As noted below, the presence of two LUT pages (for out-of-cursor bits) may be essential to real-time digital contrast control. Loading images into the FB Images are typically stored on the file system of the host computer. Before an image can be displayed, it must be copied from the file system to the FB. We do this with the routine:
Figure 2. Illustrationof the concepts of the window and viewport.
the full size of the screen. This, in turn, allows one to store a larger repertoire of images in the FB. In our configuration, the video path, as it leaves the FBC, is 35 bits wide: 0-7 from the red plane, 8-15 from green, 16-23 from blue, and 24-3 1 from the alpha plane. The alpha plane, which for most purposes may be regarded as simply another plane of memory, derives its name from its use as a means of superimposing alphanumeric~on an image. Bit 32 is the in-cursor bit, which is 1 whenever the pixel in question is in the cursor. The cursor is a user-definable 32 X 32 pixel x l bit image that may be independently positioned anywhere in the FB. It is useful as a nondestructive fixation point that may be turned on and off and moved about without altering the FB contents. Bits 33 and 34 are the LUTpase bits, which will be discussed below. Crossbar switch (XBAR). A crossbar switch allows one to remap bits in the video path. For example, the crossbar allows one to change the video path bit assignments described above to map the red plane (bits 0-7) to bits 8- 15. When using a monochrome display, a typical application of the crossbar is to route data from a selected plane (red, green, blue, or alpha) to the single channel driving the monochrome monitor. The video path leaving the XBAR is 34 bits wide (four &bit planes, incursor bit, LUT page bit).
This routine does three things: (1) it transfers the image data from the file '*file__name" to a region of the FB; (2) it associates an image number (irnage_n) with the FB region; and (3) it creates a data structure, associated with the image number, that describes the location and size of the FB region. The image number is the means used in subsequent routines to refer to a particular image. Image numbers are assigned in sequence from 0. The set of structures created may be thought of as an FB map. Some thought is required in packaging the images successively into the FB, especially if both monochrome and color images are intermixed. Because the file format we use allows storage of multiple frames (as in a movie; see below), the routine allows one to specify starting and ending frame numbers (startArame, end-frame). The lack of other arguments in this call indicates that the image file contains within it information regarding its width and height. This information is typically contained in a header of some standard sort. We have used the HIPS header in the current implementation (Landy , Cohen, & Sperling, 1984). Two other routines have proven useful in our work. They are save_Ib(filename), which saves the FB map into a file, and restore_fb(filename), which reads the FB map from a file into the appropriate data structures. Because the transfer from host file system to FB is typically slow (several to tens of seconds), it is often necessary to load all images into the FB before the start of the experiment. Whether one takes this approach will depend on the speed of the transfer, the size of the FB, the ability to display selected regions of the FB, and the demands of the experiment. One step we have taken to accelerate the image-loading process is to create a dedicated raw partition on the Winchester disk that also houses the host file
RASTER PSYCHOPHYSICS system. This is, in effect, a separate file system into which images may be placed and from which they may be transferred to the FB without the substantial overhead of the host file system operations. Even with this acceleration, a 256= X 8 bit image takes about 2 sec to load. (The loading time is dependent upon the size of the host buffer allocated for the transfer.)
LUMINANCE CALIBRATION Luminance calibration requires measuring the pixel luminance produced by each possible digital value, D, sent to the DAC. This value is not independent of the luminance of other pixels, but unfortunately completely characterizing these interactions is a formidable task. It is generally true that if some precautions are taken, the departures from independence will be modest. We measure the luminance in two ways: (1) via the digital readout of a photometer, and (2) by integrating the analog output of the photometer. The latter procedure allows us to automate the calibration of the monitor.
Integrating the Analog Luminance Waveform As the monitor beam scans the screen, it passes momentarily under the view of the photometer. The analog output of the photometer reflects the duration of this passage and the persistence of the phosphor. An example is pictured in Figure 3. The details of this waveform are not important here, except that its integral is proportional to luminance. To compute this integral, we feed the analog signal into an analog-to-digital converter ( A X ) . During a single frame (16.6 msec), a sequence of 160 samples . sum of these samare taken at intervals of 100 ~ s e cThe ples is taken as an estimate of the luminance, scaled by a constant. This constant can be determined by comparing the photometer readout and computed integral at some
700 USABLE LEVELS
max
w
u
z a
z Lo 5 Ñ
w
xa.
Lmin.
/'
--. Do
D
i C(D)
I( 1023
DAC INPUT
Figure 4. Construction of the correction table.
value. This sampling and computation are implemented in the routine
n =read_Jm(frames, pause) which waits for pause frames and then computes the (unscaled) luminance averaged over frames frames. The pause serves to allow any large transients to settle and is not ordinarily needed unless very large changes in luminance are made. The averaging may be used to reduce the noise in the measurements. As an example, in measuring the gamma function for the unattenuated nd channel (see below), we use frames = 3, pause = 0, whereas for the attenuated blue channel, we use frames = 9, pause = 0, because the signahnoise ratio is smaller,
MEASURING THE GAMMA FUNCTION 300
Lo then decrease redo and repeat the above The procedure is repeated until no further adjustments in redo bring b l u any ~ closer to Lo. Then the blue channel is calibrated, and a correction table created, as in the single-channel method, except that redo is kept in the red LUT. In practice, the attenuated channel is usually linear, since it is producing only a small range of signals, and this may be taken advantage of to hasten the calibration procedure. The actual available contrast of the display in mode 2 will be RA; thus, it is appropriate for small contrasts, from 0 to RAmax. What basis is there for selection of the value of the attenuation R in the second channel? The value of R will affect the worst-case quantization in both modes 1 and 2. At the transition between modes 1 and 2, the contrast will be RA, and in mode 1 the number of levels, A$, will be RMl, where Mi is the number of usable levels in mode 1. At the minimum desired contrast Cmin (which will be determined by the minimum contrast threshold for human observers, i. e., about 0.005) the number of levels N2 in mode 2 will be MKminfR, where Mz is the maximum number of usable levels in mode 2. Table 1 shows some representative values. As R increases (and attenua-
WATSON, NffiLSEN, POIRSON, FTTZHUGH, BILSON, NGUYEN, AND AHUMADA
592
Table 1 Minimum Usable Levels In Modes 1 and 2 as a Function of Attenuation R
Note-The
0.2 140 26 values above assume that M, = 700. M, = 1.02%
tion decreases), Ni increases but N2 decreases. At first glance, it might appear sensible to equate these two worstcase numbers of levels. However, the quantization error will in general be more visible at the transition between modes 1 and 2 than at Cmm. Therefore, it makes sense to devote more levels to R than to Cmm, that is, to make Nf. > N2.This view may be tempered, however, by the user's view of whether they are likely to be more often in mode 1 or mode 2. We currently use a value R=0.1.
REAL-TIME CONTROL OF CONTRAST It is often desirable to display an image with a contrast that varies over time. Let us call the variation the contrast timecourse. This may be represented as a list of floating point numbers ranging between -1 and +1, where each number represents the contrast in a single frame of the display. We have already described how to create an LUT for a particular contrast. Recall that it requires only a linear transformation of 2"numbers, since the correction table, T(D), is constructed once after each calibration. To arrange a particular timecourse then, we must take each number in turn from the list, use it to create an appropriate LUT, load the new LUT in an unused display LUT, and then, during the blanking interval preceding the next frame, switch to the new table. The Adage RDS-3000 has two complete LUTs (not including cursor LUTs), which allow us to compute and load the unused LUT during each frame (16.6 msec). If only one LUT is available, it must be loaded during the blanking interval at the end of each frame, which is usually only about 650 pet long. If the LUT has 256 entries, a transfer rate of at least one element every 2.5 @ec is required. This does not include the time to compute the LUT, which must be done in advance. These techniques have been implemented in the routine
anvary(t__list, contrast, c-tablet,
c t a b l e 2 , frames)
where t_Jist is the contrast timecourse, contrast is a global contrast multiplier, c-table1 and c-table2 are the correction tables for the red and blue channels, and frames is the number of frames to display.
IMAGE DISPLAY The actual display of an image requires several steps. First, the viewport must be set to the desired size and lo-
cation. In many experiments, this will be done once at the start of the session. For this we use the routine where vwc__x and v w c j are the locations of the center of the viewport, and vw-width and vwAeight define the size. We have found it more convenient to specify the center, rather than the coordinates of the upper left comer. Next the XBAR must be set to select the plane in which the image lies. Then the window must be moved to the coordinates of the image. These two steps are incorporated in the routine where image- is the number of the selected image (or staging area; see below). The window will be centered on the coordinate x,y. Finally the LUT must be set to the desired sequence of values, for example, by use of the cmvaryu routine described above. For some experiments, it may be advisable to extinguish the cursor (fixation point) before presentation of the image and to reactivate afterward.
IMAGE MOTION Framebuffers typically provide control over the horizontal and vertical starting point of the displayed data in the FB. These are usually called horizontal and vertical window values. By altering these values in successive frames, the display can be made to move. At the most general level, the user may provide a time list of horizontal and vertical coordinates along which the image is to travel. More often, a constant velocity is desired. Note that speed in each dimension, expressed in pixels/frame, must be a rational number. Furthermore, it is usually inadvisable to let the denominator be too large, since this will result in jerky motion. These constraints on the one-dimensional speeds impose constraints on the two-dimensional velocity. The speed in one dimension is equal to
where p c L J r a m e is the displacement in pixelslframe, frame* is the frame rate in frames/sec, and p L d q is the display resolution in pixelsr'degree. For a typical display with 20 pixelslcm at a viewing distance of = 60 Hz and 114 cm, p L d e g = 40, and if frame* no more than three frames elapse between each shift ( p U r a m e 2 1/31, then the lowest speed that can be obtained is 0.5'/sec. This is a sampling problem, and can to some extent be ameliorated by filtering the spacetime image prior to sampling. This means, of course, creating a different image for each frame of the display (see Movies). Since motion is produced by scrolling the display window through the framebuffer memory, care must be taken that only the desired imagery comes into view during the
RASTER PSYCHOPHYSICS duration of the display. On many systems, the memory wraps around, so that if an address beyond the range of permissible pixel addresses is called for, the pixel address modulo the width (or height) of the memory is used. Thus, for example, if a periodic pattern with period that integrally divides 1,024 were scrolled within a display of that size, it would continue to move without disruption indefinitely. Alternatively, the image to be moved may be padded by an appropriate background as large as the image in each dimension. The resulting padded image will have four times the number of pixels as will the original. Then the actual offset will be the desired offset in each dimension modulo the size of the original image.
image in trarnebtfer
593
framebuffer
\
MOVIES A sequence of frames may be displayed as a movie by successively moving the window to each frame. It is worth noting that substantial movies (by psychophysical standards) can be effected in this way. For example, if there are 4 FB planes of 1,024x 1,024 pixels, and if each frame is 128X 128, then a total duration of 256 frames, or about 4 sec, may be displayed. If fewer than 8 bits are allocated to each frame, then the XBAR may be used to select individual bit planes or sets of bit planes. A binary movie with dimensions of 128X 128 could run for 2,048 frames, or about 34 sec. STAGING AREAS Consider an experiment in which images, drawn from a set of N, are viewed side by side in pairs. If any possible pairing must be available, and if the ordering (left vs. right) is important, then there are N(N- 1) pairs. To store this many images in the FB may not be possible. It is much simpler to store only the Npossible components, and then provide a means of assembling a pair at the time it is needed. We do this by creating a staging area, a reserved portion of the FB, large enough to hold the desired multicomponent display. Prior to display, a copy of each component is moved to the desired location within the staging area. This method, which is useful with a wide variety of multicomponent displays (e.g., apparent motion between various target pairs, two or more spatial alternative forced-choice experiments, simultaneous comparisons, etc.), requires two routines. The first is:
Figure 6. Use of a staging area. An image is copied from one region of the framehuffer into the staging area region. Although the illustration shows the image and the staging area in the .same plane, this need not be so.
treated like any other image; for example, it can be referred to in a call to the display routines. The second routine is:
This routine copies an image, as specified by the image number source^, to the staging area, as specified by the image number d e s t i n a t i o u , but places the upper left comer of the source image at the coordinate offset, y-offset) within the staging area. The image is clipped to the limits of the staging area. This routine executes on the high-speed graphics processor that is an optional part of the Adage RDS-3000. The use of staging areas is illustrated in Figure 6. COLOR DISPLAYS For many purposes, color displays can be arranged by repeating the above procedures three times, once for each of the red, green, and blue displays. The two-channel method of contrast control cannot be easily used with color displays. It is also possible to arrange more elaborate display routines, in which, for example, the three memory planes are used to accommodate imagery encoded in some linear transformation of the red, green, and blue signals, for example, as red/green, bluefyellow, and blacldwhite signals. DESIRABLE FEATURES
This behaves identically to the routine load_fl>() introduced previously, except that it does not transfer an image into the FB. The arguments specify the size of the FB region to be reserved. Thus, the staging area is simply another image, except that its contents are not defined by reading into it an image from the file system. The virtue of this technique is that the staging area can now be
Many of the techniques described here require hardware features that not all systems have. Although many of these may not be needed, we thought it worthwhile to list those features that seem particularly useful in light of our experience. 1. 10-bit DACs: important for digital contrast control,
594
WATSON, NIELSEN, POIRSON, FTTZHUGH, BILSON, NGUYEN, AND AHUMADA
particularly if the two-channel method cannot be used (e.g., when all three channels are needed for color). 2 Window: essential for motion and selection of images within the FB. 3. Viewport: essential if stored images arc smaller than the display size. 4. Multiple LUTs: essential for real-time contrast control, unless a new LUT can be loaded during the vertical retrace interval (see Real-Time Control Contrast of above). 5. Large FB: useful for storage of multiple highresolution images and for movies. 6. Local processor: may be essential for high-speed
image copy operation. A local processor is also valuable when the host uses a non-real-time operating system such as UNIX.Then the real-time operationscan be placed under the control of the local processor. REFERENCES ADAGE, I~c.(1982).RDS SOW User's Guide. BiUerica. MA: Author. CATMULL, E. (1979). A tutorial on compensation tables. Compiler Graphics, 13, 1-7. THECONRAC CORPORATION (1985). Eastergraphies handbook (2nd Ed.). New York: Van Nostrand. LANDY,M. S., COHEN,Y.,& SPERLING, G . (1984). HIPS: A Unixbased linage processing system. Computer Vision, Graphics, A 1mage Processing, 25, 331-347.