performs only automated ball indentation (ABI) testing which will be ... (b) relative positions of the testing tools mounted on the bottom of the load .... 5â Illustration of indentation geometries before and after load application (the material pileup.
Fahmy M. Haggag1, Randy K. Nanstad1, John T. Hutton1, David L. Thomas1, and Ronald L. Swain1
Use of Automated Ball Indentation Testing to Measure Flow Properties and Estimate Fracture Toughness in Metallic Materials REFERENCE: Haggag, F. M., Nanstad, R. K., Hutton, J. T., Thomas, D. L., and Swain, R. L., “Use of Automated Ball Indentation to Measure Flow Properties and Estimate Fracture Toughness in Metallic Materials,” Applications of Automation Technology to Fatigue and Fracture Testing, ASTM 1092, A. A. Braun, N. E. Ashbaugh, and F. M. Smith, Eds., American Society for Testing and Materials, Philadelphia, 1990, pp. 188-208. ABSTRACT: A field indentation microprobe (FIM) apparatus was developed (and patented) to evaluate, nondestructively in situ, the integrity of metallic structures. This study investigated the applicability of using a new automated ball indentation (ABI) test, which is a major part of the FIM, to measure the flow properties of metallic materials including those exhibiting Lüders or inhomogeneous strains (carbon steels, titanium alloys, aluminum alloys, etc.) and to estimate their fracture toughness. The ABI test is based on multiple indentations (at the same penetration location) of a polished metallic surface by a spherical indenter. Automation of the test, where a computer and test controller were used in innovative ways to control the test as well as to analyze test data, made it simple, rapid, accurate, economical, and reproducible. Results of ABI tests on different base metals, welds, and irradiated materials are presented and discussed in this paper. Excellent agreement was obtained between ABI-derived data and those from standard ASTM uniaxial tensile and fracture toughness tests. KEY WORDS: Automated ball indentation, spherical indenter, cyclic loading, partial unloading, yield strength, flow properties, fracture toughness, in-situ testing, field apparatus, automation, nondestructive test, mechanical test, welds, heat affected zone, irradiated steels, fatigue testing, fracture testing.
Determination of the integrity of any metallic structure is required either to ensure that failure will not occur during the service life of the components or to evaluate the lifetime extension of the structure. In order to assess the integrity of structures following accidents or severe service conditions, knowledge of the material's mechanical properties, the size and extent of induced defects, and the current thickness and residual stresses are required. This is particularly important for nuclear components such as pressure vessels and their supports because of the radiation-induced embrittlement. This was one incentive to develop a nondestructive testing apparatus such as the field indentation microprobe (FIM) that is described in detail in Ref. 1 and briefly presented here. Other motivations are its general applications such as the in-service examination of components such as pressure vessels and piping in nuclear and nonnuclear applications, welding characterizations (including property gradient in the heat affected zone and the weld), new alloy development, and when limited amounts of material are available. The use of FIM nondestructive
1
Development staff member, group leader, development engineer, instrument technician, and principal technologist, respectively, Oak Ridge National Laboratory, Oak Ridge, TN 37831-6151. 188
HAGGAG ET AL. ON AUTOMATED BALL INDENTATION TESTING
189
tests on deformed, aged, and embrittled structural components may also result in extending their useful service life based on in-situ mechanical test results rather than using simulated conditions or surveillance test data. A brief description is given for the patented FIM apparatus which was developed to evaluate, nondestructively in situ, the integrity of metallic structures. The laboratory version used here performs only automated ball indentation (ABI) testing which will be described in detail later. The FIM apparatus utilizes several applications of automation technology to measure the physical and mechanical properties that are described in more detail in the following sections of the paper. These applications include: (1) the computer control of the X-Y testing head of the FIM apparatus for positioning the ball indenter to perform the testing in the desired location, for moving the ultrasonic transducers (attached to the testing head) to scan and examine the metallic structure for detecting the presence and measurements of cracks, thickness measurements, and for determining the presence and orientation of residual stresses by measuring the material pile-up around indentation; (2) to perform computer-controlled cyclic loading and partial unloading of the ball indenter into the test surface under a specified strain rate; and (3) to automatically acquire data during the cyclic loading and unloading and to perform mathematically intensive calculations (e.g., measure the slope of each unloading cycle and separate the elastic and plastic indentation depth components, solve several complicated equations via iteration techniques, and perform several regression analyses for each ABI test). The automation techniques of the FIM apparatus are essential for remote applications (e.g., inside a nuclear pressure vessel). Furthermore, the automation techniques reduce: the testing time of ball indentation to 5-10 minutes (depending on the desired strain rate for the particular application), and the data analyses (including plotting of the test results) to less than 1 minute per an ABI test. The Field Indentation Microprobe (FIM) Apparatus The main components of the FIM apparatus are shown schematically in Fig. 1. The method of mounting the testing head of the FIM on the structural component is not shown since the exact mechanism will vary on a case-to-case basis depending upon the geometry and position of the particular structure. Typically a tripod mechanism having magnets or clamps can be utilized for releasable attachment to the structure. The tripod arrangement facilitates adjustment of the ball indenter to be perpendicular to the surface of the structure or test specimen. The load can be applied by hydraulic, pneumatic, mechanical, or any other means. In brief, the FIM consists of two main units: an automated ball indentation (ABI) unit for measuring the mechanical properties and a nondestructive evaluation (NDE) unit (consisting of ultrasonic transducers and a video camera) for determining the physical properties such as crack size, material pile-up around indentation, and residual stress presence and orientation. The mechanical properties determined by this innovative FIM apparatus include elastic modulus, yield strength, Lüders strain, strain-hardening exponent, Brinell hardness, true-stress/true-plasticstrain (Ft-,p) curve up to 20% strain, and residual stress presence and orientation. The fracture toughness is also estimated using the ABI measured flow properties and a modified critical fracture strain model. Furthermore, the shift in the ductile-to-brittle transition temperature for steel plates and welds, for example, due to neutron irradiation embrittlement, can be estimated from the ABImeasured changes in the material's yield strength and flow properties.
190
AUTOMATION IN FATIGUE AND FRACTURE TESTING
Fig. 1 — Basic components of the field indentation microprobe (FIM) apparatus: (a) schematic and block diagram, and (b) relative positions of the testing tools mounted on the bottom of the load cell of the FIM apparatus. The advantages and ultimate objectives of the FIM invention can be best understood from the flow chart of Fig. 2. A deformed/damaged structure (for example a pressure vessel or a tank car) is evaluated by securely attaching the testing head of the FIM apparatus to the area of interest or concern. At a selected test location, preparation is performed by cleaning and polishing the structure surface and then two types of testing are conducted, namely, the nondestructive evaluation (NDE), and the mechanical testing using the ABI technique. The NDE measurements using the ultrasonic transducers are analyzed using the computer to calculate the crack size and current material thickness, and indicate residual stress presence and orientation. Similarly, the ABI measurements are analyzed using the computer to calculate the flow properties (Ft - ,p curve), strain-hardening exponent, elastic modulus, yield strength, and estimate the fracture
HAGGAG ET AL. ON AUTOMATED BALL INDENTATION TESTING
191
Fig. 2 — Flow chart of the processes of the field indentation microprobe (FIM) apparatus for measuring the mechanical and physical properties and for evaluating the integrity of a structure on the basis of these measurements.
toughness. As shown in Fig. 2, a person who is in charge of conducting the FIM tests and performing the fracture mechanics analysis uses the NDE information (crack size, structural geometry, component current thickness, etc.) and the information of the loads or stresses to be applied to the structure to calculate the applied stress intensity factor (Ka). The initiation fracture toughness, KJIc, estimated from the ABI data is then compared to the applied Ka. If the value of Ka is greater than or equal to the initiation value KJIc (a "yes" answer for the logic of Fig. 2), then subsequent failure under service-related loading will occur. The "no" answer for the logic of Fig. 2 indicates that failure of the structure will not occur. For cases where the failure mechanism for other structures is by plastic yielding then the logic of Fig. 2 should be to compare the applied stress to the yield stress. The automated Ball Indentation (ABI) Test The ABI testing system used in this work consists of a computer, test controller, and a servohydraulic test machine. The computer is a Hewlett-Packard series 200/300 with 4 Mbytes of random-access memory and Hewlett-Packard technical BASIC operating system. The computer runs a 303.8-kbyte (approximately 6,000 lines) test control/data acquisition and analysis program
192
AUTOMATION IN FATIGUE AND FRACTURE TESTING
developed at Oak Ridge National Laboratory (ORNL) specifically for this application. The test controller is a complementary metal oxide semi-conductor (CMOS) logic design also developed at ORNL with up/hold/down ramp output function generator and 2 channels of 16-bit successiveapproximation analog-to-digital conversion. The test controller communicates with the computer via a 16-bit output/input interface. The test controller programs the MTS servohydraulic testing machine by means of the function generator which operates with computer control of ramp rate and polarity. The function generator output voltage is derived from an operational amplifier integrator whose input current is set by a digital-to-analog converter; the integrator output voltage is smooth and stepless even at low ramp rates. The test controller reads the outputs of the servohydraulic testing machine load and extension conditioners with 16-bit analog-to-digital converters triggered simultaneously and multiplexed back to the computer. The computer converts the binary information from the analog-to-digital converters to engineering units using polynomial coefficients determined by computer-controlled calibration procedures prior to testing. The ABI test is based on multiple indentation cycles (at the same penetration location) on a polished metallic surface by a spherical indenter. Each cycle consists of indentation, unload and reload sequences. Values of ramp rates and data acquisition rates for each of the cycle sequences and for indentation target delta displacement, unload target delta load, indentation maximum (final) load and indentation maximum (final) displacement are input before the test starts. The computer program checks all test values against limits to detect operator error. Once the test is started, operation is automatic until either maximum load or maximum displacement is reached, but the operator can abort the test at any time if system malfunction is detected. Current test values for load, displacement and target load/displacement are displayed on the CRT so the operator can monitor the test progress. The applied loads and associated displacements (depth of penetration of the indenter into the test specimen) are measured using a load cell and a linear variable differential transducer (LVDT). The test set-up of the current work used either a 0.76-mm or a 1.59-mm diameter ball indenter and a spring-loaded LVDT which were mounted to the load cell of an MTS hydraulic testing machine. Details of the ball indenter and the LVDT are shown in Fig. 3. The load-displacement data from each unloading sequence is fitted with a first degree polynomial and the fit extrapolated to get the displacement corresponding to zero load. These displacements and the maximum cycle load and displacement values from each indentation sequence are used to determine the yield strength, produce the ABI-derived true-stress/true-plastic-strain curve, and to estimate fracture toughness. The ABI analyses are based primarily on elasticity and plasticity theories and some empirical correlations as described in Refs. 1 through 3. The primary equations used in these analyses are given in the next section. Materials and ABI Test Procedure The materials chosen here for conducting the ABI tests were A533 grade B, class 1 pressure vessel steel, unirradiated and irradiated A212 grade B pressure vessel steel, used in the fabrication of the vessel shell of the High Flux Isotope Reactor (HFIR) at the Oak Ridge National Laboratory, type 316L stainless steel, and 308 stainless steel welds (thermally aged to different conditions). Indentation tests were conducted, at room temperature, on specimens with geometries that satisfied valid ABI testing requirements of thickness and area around the final indentation relative to the size of the indenter (that is, a specimen thickness and radius of 10- and 3-multiples of the indenter radius, respectively). However, for actual field applications these requirements will be
HAGGAG ET AL. ON AUTOMATED BALL INDENTATION TESTING
193
Fig. 3— Ball indenter and spring-loaded LVDT mounted to the load cell of a hydraulic testing machine (not shown in figure). satisfied for most structural components. In these field cases, the ABI technique offers the advantage of evaluating the mechanical properties in small localized areas such as welds and heat affected zones. Furthermore, ABI tests could be conducted at elevated temperatures and at high strain rates. FIM AND ABI DATA ANALYSIS The main problem in determining yield strength from ball indentation tests is due to the inhomogeneous or Lüders strain behavior. In a uniaxial tensile test, the Lüders strain is the inhomogeneous plateau (horizontal portion) of the stress-strain curve where it is confined mostly to a defined volume of the specimen gage section. Hence, the inhomogeneous (Lüders) and homogeneous (work hardening) behaviors in a tensile test are well defined and separated from each other. In contrast, in an ABI test the material has less constraint at the surface around the indentation. With increasing loads, an increasing volume of material is forced to flow under multiaxial compression caused by the indenter and more material pile-up and Lüders strain occur around the indentation. Lüders strain behavior in ball indentation testing is discussed and demonstrated in Ref. 4. Thus, in an ABI test both inhomogeneous and homogeneous material behavior occur simultaneously during the entire test. Consequently, an accurate determination of yield strength should be based on the entire load-displacement curve of the ABI test as explained later. Schematics of the ABI load-displacement plot and the profile of indentation (exaggerated to show material pile-up) are shown in Figs. 4 and 5. The previous technique of Ref. 4 involved the use of a prior developed correlation (using either optical interferometry or mechanical profilometry techniques) between Lüders strain and the geometry of the lip (material pile-up) around a ball indentation in order to determine the Lüders strain and then the yield strength for a certain carbon steel material. Since such a correlation for each material does not exist and its development is
194
AUTOMATION IN FATIGUE AND FRACTURE TESTING
Fig. 4— Schematic representation of the relationship between load and displacement of the ball indenter of Fig. 3 as observed by increased cyclic loading. expensive, the FIM does not utilize such an approach. Furthermore, the use of optical interferometry is impractical for field testing applications. The FIM analyses use an innovative method for analyzing the load-displacement data to determine the yield strength and to produce the true-stress/true-plastic strain curve as explained later (Refs. 1 through 9). The field indentation microprobe is utilized in the following manner. After the testing head is properly secured to the structure to be tested so that the load cell is perpendicular to the surface of the region where testing is to be performed, this surface is prepared using the polishing tool. Thereafter, the computer, through use of the capability of the head, causes the indenter tip to be brought into contact with the polished surface. The total and plastic indentation depths (ht1 and hp1) and the applied indentation load (P1) are then measured for the first cycle. Typically the load is increased for each succeeding cycle and the values of P, ht, and hp are measured for each cycle. Several load cycles (typically five or more) are conducted at the same indentation location for determining a full true-stress/true-plastic-strain curve at this location (data from each cycle yield a point on this curve). This cyclic loading can be continued; however, the maximum total indentation depth (ht) should not exceed one half of the diameter, D, of the indenter. Following the final cycle,
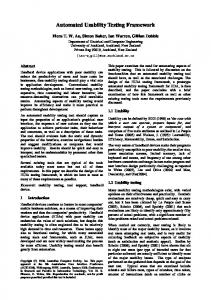
Fig. 5— Illustration of indentation geometries before and after load application (the material pileup around the indentation is exaggerated).
HAGGAG ET AL. ON AUTOMATED BALL INDENTATION TESTING
195
the plastic indentation diameter, dp, can be independently measured using the video camera. If a measure of the amount of material pile-up and existence and orientation of residual stresses overall are required, thickness measurements are performed before and after indentation using the ultrasonic transducers over a traverse distance of at least one indenter diameter from each side of the indentation and in two nominally perpendicular directions. As stated previously, the FIM operation is typically controlled by a program stored in the computer, and data such as the load, indentation depth, etc., measured using the data acquisition system are stored on magnetic discs in the computer for post-test processing. The utility of the present FIM invention stems in part from its ability to derive, from depth-ofpenetration and load values obtained during cyclic and incremental loading and unloading, the essential material condition behavior. These include: true-stress/true-plastic-strain curve, strainhardening exponent, strength coefficient, elastic (Young's) modulus, yield strength, Lüders strain, and estimates of fracture toughness. Flow Properties The homogeneous plastic flow portion of the true-stress (Ft)/true-plastic-strain (,p) curve can be represented by the familiar power law equation:
Ft = K ,np
(1)
where n = strain-hardening exponent K = strength coefficient It should be noted that this representation is not a necessary requirement for determining the indentation-derived Ft - ,p data as will be shown later (Eqs. 2 and 3) but it can be used to determine the strain-hardening exponent over the ,p range of interest. Furthermore, a single power curve may not fit the entire Ft - ,p curve as noted in ASTM Test Method for Tensile Strain-Hardening Exponents (n-Values) of Metallic Sheet Materials (E-646-78). The computer program is used to solve the following equations and to thereby determine the flow curve from the ABI data.
,p = 0.2 dp/D Ft = 4P/Bdp2* where dp = {0.5 CD [hp2 + (dp/2)2]/[hp2 + (dp/2)2 - hpD]}1/3 C = 5.47P(1/E1 + 1/E2)
⎧ 112 . ⎪ . + τ ln Φ 1 < Φ ≤ 27 δ = ⎨ 112 ⎪δ Φ > 27 ⎩ max N = ,pE2/0.43Ft *max = 2.87"m
(2) (3) (4) (5)
(6)
(7) (8)
196
AUTOMATION IN FATIGUE AND FRACTURE TESTING
J = (*max-1.12)/ln(27)
(9)
In the above equations, Ft is the true stress, ,p is the true-plastic-strain, dp is the plastic indentation diameter, D is the diameter of the ball indenter, P is the applied indentation load, hp is the plastic indentation depth, E1 is the elastic modulus of the indenter, E2 is the elastic modulus of the test material, * is a parameter whose value depends on the stage of development of the plastic zone beneath the indenter, "m is a parameter proportional to the strain rate sensitivity of the test material or specimen (for example, for low strain-rate-sensitive materials "m =1.0), and ln is the natural logarithm. It can be seen that dp appears on both sides of Eq. 4; the computer program solves this equation by iteration. Equations 3, 6, and 7 also have to be solved by iteration, since Ft depends on *, which depends on N, which depends on Ft. This part of the data reduction is almost impossible if attempted manually. The computer program is used also to fit the ABI-derived Ft - ,p data (calculated using Eqs. 2 and 3) by linear regression analysis to the relationship of Equation 1, and determine the strainhardening exponent (n) and the strength coefficient (K). The previous equations provide means for predicting the homogeneous portion of the stress/strain curve from indentation data. Yield Strength A different approach must be used for measuring the yield strength of carbon steels (and other materials such as aluminum and titanium alloys) exhibiting inhomogeneous or Lüders strain. Similarly, other techniques wherein the Lüders strain and yield strength are determined using either a profilometry or an optical interferometry technique, while suitable for laboratory applications, are not suitable for in-field applications because of their complexity. In contrast, the information obtained using the FIM apparatus described can be more easily and accurately used to obtain the yield strength of the test material using the following approach. For each ABI loading cycle, the total penetration depth (ht) is measured while the load is being applied, then converted to a total indentation diameter (dt) using the following equation: dt = 2 (htD - ht2)0.5
(10)
Data points from all loading cycles up to dt/D = 1.0 are fit by linear regression analysis to the following relationship: P/dt2 = A (dt/D)m-2
(11)
where P is the applied indentation load, m is Meyer's coefficient, and A is a test material (or specimen) parameter obtained from the regression analysis of test data of dt/D versus P/dt2. The test material parameter (A) is then used to calculate the yield strength (Fy) of the material using the following equation: Fy = ßmA (12) where ßm is a material-type constant [for example, a single value of ßm = 0.2285 (Ref. 9)] is applicable to all carbon steels whether cold rolled, hot rolled, or irradiated. The value of ßm for each class or type of material is determined from regression analysis of various tensile yield-strength values (measured from specimens with different heat treatments and flow properties and machined from different orientations) and their corresponding A values as measured from entire ABI curves (up to dt/D = 1.0). In Eq. 12, the units of A and Fy should be the same. The simplified and more
HAGGAG ET AL. ON AUTOMATED BALL INDENTATION TESTING
197
accurate approach of this invention to determine yield strength eliminates the determination of material pile-up except for residual stress evaluation and thereby significantly reduces testing time and thus cost. Fracture Toughness A simple technique is described (Ref. 3) for estimating the fracture toughness by coupling the ABI-derived flow properties with a modified but empirically calibrated critical fracture strain model. This technique is currently limited to ductile fracture applications. The critical fracture strain model for ductile fracture prediction can be expressed in the form [10,11] (13) KJIc = Constant (,f*@ l*0 @ E @ Fy)0.5 where KJIc is the initiation fracture toughness calculated from JIc, ,f* is the critical fracture strain, l*0 is the characteristic distance ahead of the crack tip over which the strain must exceed ,f*, E is the elastic modulus, and Fy is the yield strength. The modification (Ref. 12) of this model involved: (1) the use of measured uniform strain from tensile tests or the strain-hardening exponent from ABI tests instead of the critical fracture strain value required in the original model, and (2) the assumption of an empirically calibrated value for the characteristic distance, l*0, for each class of material. The ABI test technique used in this work provides an alternative method to determine the yield strength, Fy, and the strain-hardening exponent, n, (for most metals exhibiting a power law behavior one can mathematically prove that the strain-hardening exponent, n, is equal to the uniform ductility, ,u) in an almost nondestructive manner which will be more favorable over tensile testing for field applications and when limited materials are available. The determination of the critical fracture strain, ,f*, requires testing of several circumferentially notched round tensile specimens each having a different value of its notch root radius. Since this approach is costly, values of the critical fracture strain, ,f*, were not determined for the materials used in this work and n values were used instead. The modified critical strain model can now be written as: KJIc = constant (n @ l*0 @ E @ Fy)0.5
(14)
The characteristic distance, l*0, for ductile fracture is usually a multiple of the inter-particle spacing and currently it should be regarded as essentially an empirically obtained quantity. Although this dimension is presumably of relevance to the microstructural aspects of fracture initiation, it is plausibly related to the yield strength, strain-hardening exponent (a measure of work-hardening), and the strength coefficient of the test material. However, more research is needed to better quantify and define this dimension in order to be able to use this method of estimating fracture toughness for applications where this characteristic distance is expected to change (for example, due to radiation embrittlement). Since the critical fracture strain, ,f*, values were not determined experimentally, strain-hardening values were used in the calculations [3]. Although such a substitution has no theoretical basis, it was considered reasonable since the critical fracture strain is often proportional to the uniform strain for a smooth tensile specimen [13]. The proportionality constant would thus be included in the constant coefficient of Eq. 14. The value of 3.00 for this constant is good for steels whether in the irradiated (Ref. 12) or deformed (Ref. 14) condition; however, this value might be
198
AUTOMATION IN FATIGUE AND FRACTURE TESTING
Fig. 6— Sample of four ABI test results (load versus depth using a 1.59-mm diameter ball indenter) on A533B steel. (Note the reproducibility for tests with partial or full unloading cycles). different for other classes of materials such as titanium or aluminum alloys, and further research is needed to determine the appropriate value of this constant via empirical calibration. For estimating fracture toughness in certain applications, ABI testing might replace tensile testing because it is simpler, faster, nondestructive, and could be performed in-situ, using a field apparatus, to evaluate deformed components, and aged and embrittled structural components (provided that characteristic distance values are available from open literature). Furthermore, the ABI technique uses a very small volume of test material. Hence, it could prove valuable in new alloy development and when limited amounts of material are available. Other applications might
Fig. 7— Yield strength results calculated from the entire ABI load-displacement curves for two tests on broken halves of A533B steel fracture toughness specimens.
HAGGAG ET AL. ON AUTOMATED BALL INDENTATION TESTING
199
Fig. 8— Flow properties measured from ABI tests on two A533B pressure vessel steel specimens. (Note that each curve is entirely obtained from multiple indentations at a single penetration location.) include weld characterization and qualification, testing of near-net-shape manufactured components, and residual life assessment. Results and Discussion The ABI tests were conducted on the side surfaces far from the fracture planes of 25.4-mm-thick compact specimens (1TCS) of A533 grade B class 1 pressure vessel steel. These specimens were tested previously according to ASTM Test Method for Jlc, a Measure of Fracture Toughness (E-81381) and the fracture toughness values were reported in Ref. 15. An example of the ABI loaddisplacement curves, using a 1.59-mm diameter indenter, of these specimens is given in Fig. 6. This figure demonstrates the reproducibility of four tests conducted with partial or full unloading cycles. Fig. 6 also shows that the elastic unloading of each indentation cycle is linear. Hence, partial unloading together with the computerized calculation of the unloading slope and its extrapolation to zero load, as explained earlier in the section of Flow Properties, was adopted in all ABI tests. This partial unloading procedure is preferred over full unloading because it reduces testing time and most importantly it improves the data analysis by eliminating the effects of nonlinearity near zero Table 1— Comparison of estimated (using ABI data) and measured fracture toughness values for A533 Grade B Class 1 steel tested at room temperature. Kjlc(MPa @ m0.5) Specimen No. K52c K53A
Yield Strength, Mpa 400 407
n 0.187 0.173 average
A (measured) 198.5 234.1 216.3
B (ABI-Predicted) 220.3 213.8 317.1
+11.0 - 8.7 +0.4
200
AUTOMATION IN FATIGUE AND FRACTURE TESTING
TABLE 2— Comparison of yield strength results measured by uniaxial tensile and ABI tests on A212B steel.
Fluence, >1 MeV (n/cm2 x 1017 0.0 0.0 0.0
Uniaxial Tensile Test Yield Specimen Strength, No. Mpa A59-HA-15 336 A59-HA-1 318 A59-HA-12 333
0.12 0.12 0.12 0.12
A31-3 A31-4 A31-1 A31-2
333 334 331 318
1.53 1.53 1.53
A96-4 A96-2 A96-1
396 373 394
1.53
A96-3
392
Average, A
Automated Ball Indentation Test Yield Strength, Average, Mpa B 333 312 323
329
Specimen No. A53-3 A53-2
329
A31B-1 A31B-7
340 325
333
+1.2
389
A96B-2 A96b-1
410 377
394
+1.3
-1.8
unloading, which is due to testing system compliance and the effect of viscosity between the surface of the indenter and the test material. The yield strength was calculated from the measured values of the load (P) and the indentation diameter (dt) during load application for the indentation cycles of the entire curve of Fig. 6. This is illustrated in Fig. 7 where D is the diameter of the ball indenter. The strain-hardening exponent, n, was determined according to the procedure of ASTM E-646-78 as the slope of the true-stress/true-plastic-strain curve when plotted on a log-log scale as shown in Fig. 8. For metallic materials for which plastic-flow behavior obeys a power law, the strain-hardening exponent should be equal to the uniform elongation. The ABI-derived values of Fy and n were in good agreement with the tensile yield strength and uniform elongation values for
Fig. 9— Comparison between ABI load-depth curves for tests conducted on unirradiated and irradiated A212B steel using a 1.59-mm ball indenter.
HAGGAG ET AL. ON AUTOMATED BALL INDENTATION TESTING
201
Fig. 10— Comparison between flow properties (true-stress / true-plastic-strain curve) measured from ABI and uniaxial tension tests on irradiated A212B pressure vessel steel. this material, respectively. The elastic modulus was assumed to be 206 GPa. The elastic modulus could be measured also from ABI tests as described in Ref. 1. Fractographic examination of the fracture surfaces of these A533 Grade B Class 1 steel specimens showed that the average spacing between major voids was roughly 50 :m (consistent with previous studies [11]). The characteristic distance was assumed to be 350 :m as reported earlier for A533 Grade B Class 1 steel by Ritchie et. al. [11]. Table 1 shows a comparison between ABI-estimated and measured fracture toughness values for these A533 Grade B Class 1 steel specimens. The difference between estimated and measured toughness values was within 11%. Additional ABI tests were conducted on these two broken halves of 1TCS specimens, and the results were very similar to those reported in Table 1 which represented the upper and lower bounds of all ABI tests.
Fig. 11— Effect of surface roughness of the indenter on flow properties of A533B pressure vessel steel.
202
AUTOMATION IN FATIGUE AND FRACTURE TESTING
Fig. 12— Sample of ABI test results (load versus depth using a 0.76-mm-diameter ball indenter) on Type 316L stainless steel base metal. Good agreement between ABI-derived and tensile flow properties was demonstrated before for unirradiated and irradiated A212 Grade B pressure vessel steel specimens [2]. In Ref. 2, it is shown that the difference between the average values of yield strength measured by ABI and tensile tests was less than 2% (see Table 2). The ABI load-displacement results of the unirradiated and irradiated materials are shown in Fig. 9. This figure demonstrates the capability of the ABI test to accurately measure the effect of irradiation on materials even when the difference in tensile yield strength values (60 MPa) was small. This is very important since the change in yield strength can be used to predict the corresponding changes in the ductile-to-brittle transition temperature shift of reactor pressure vessel steels (Ref. 16). Furthermore, the ABI-measured flow properties showed an
Fig. 13— Yield strength results calculated from the entire ABI load-depth curve of Fig. 12 for Type 316L stainless steel specimen.
HAGGAG ET AL. ON AUTOMATED BALL INDENTATION TESTING
203
Fig. 14— Comparison between flow properties measured from ABI and uniaxial tension tests on Type 316L stainless steel. (Note that the ABI curve is entirely obtained from multiple indentations at a single penetration location.) excellent agreement with those measured from a uniaxial tensile test, as shown in Fig. 10. The values of strain-hardening exponent for the irradiated specimen of Fig. 10 as determined from ABI and uniaxial tensile tests are 0.192 and 0.195, respectively. A new 0.76-mm diameter indenter was machined from hardened 4340 steel to allow testing of thin specimens. This indenter did not have a smooth surface. Since ABI analyses assume no friction between the indenter and test material, the results of this indenter were compared to those using a smooth 1.59-mm diameter ball indenter as shown in Fig. 11. It is clear from this figure that the effect of indenter surface roughness results in apparently higher (about 12% in this case) flow properties due to the loss of some initial indentation loads in overcoming contact friction before plastic flow of test material commences. All ABI test results (yield strength and flow properties) obtained using the machined indenter were adjusted to account for its surface roughness.
Fig. 15— Comparison between ABI and uniaxial yield strength values for 12 welds (top and bottom weld data).
204
AUTOMATION IN FATIGUE AND FRACTURE TESTING
Fig. 16— Comparison between yield strength values measured from ABI and uniaxial tension tests on top of aged Type 308 stainless steel welds containing 12% ferrite. ABI test results of Type 316L stainless steel are shown in Figs. 12 through 14. Note that a new material parameter of ßm = 0.191 (see Fig. 13) was determined and found to be appropriate for stainless steel base metal and welds. Also, excellent agreement was obtained between ABI-derived and tensile flow properties as shown in Fig. 14. ABI tests then were performed on 12 Type 308 stainless steel welds containing different amounts of delta ferrite and thermally aged to different conditions as described in Ref. 17. A comparison between yield strength values determined from ABI and uniaxial tensile tests is shown in Fig. 15. The dashed lines in this figure represent a 5% difference between yield strength values of the nondestructive ABI tests and those from mini-tensile tests on both top and bottom of each weld. The ABI tests were also capable of detecting the very small effect of thermal aging on the welds (Fig. 16). The preliminary analysis of the ABI test results of these stainless steel welds indicated that the welds were strain rate sensitive (due to the presence of delta ferrite) since the ABI-derived flow
Fig. 17— Relationship between flow stress and strain rate for as-received Type 308 stainless steel weld containing 4% ferrite.
HAGGAG ET AL. ON AUTOMATED BALL INDENTATION TESTING
205
Fig. 18— Comparison between flow properties measured from ABI and uniaxial tests on top of Type 308 stainless steel weld (containing 4% ferrite) after adjusting ABI data for strain rate sensitivity. properties were about 10-15% higher than their corresponding tensile curves. The ABI tests were conducted at an average strain rate of 1.8 x 10⁻³ s-1, while the strain rate for uniaxial tensile tests was 3.3 x 10⁻⁴ s-1. Figure 17 shows that the strain rate sensitivity (m = 0.079) for the 4% ferrite weld accounts for a 13% higher flow stress at the ABI strain rate. After adjusting the ABI-measured flow curve for such an effect (by using "m = 1.14, as calculated according to Ref. 4, in Eq. 8 here), good comparison was obtained between ABI-derived and tensile flow curves (Fig. 18). The yield strength and flow properties of the 4% ferrite weld block were mapped across the thickness of the weld where tests were made near the top, middle, and bottom of the weld. The average ABI-derived yield strength for the base metal, HAZ, and weld materials were 330, 345, and 366 MPa,
Fig. 19— Comparison between flow properties measured from ABI tests on Type 304L stainless steel base metal, heat affected zone (HAZ), and Type 308 stainless steel weld (containing 4% ferrite).
206
AUTOMATION IN FATIGUE AND FRACTURE TESTING
respectively. All ABI test results showed the expected trend of higher flow properties for the weld and HAZ than the base metal (Fig. 19). The results of the ABI tests on these different materials are accurate, repeatable, reproducible, and show excellent agreement with the results from standard tensile tests. Furthermore, automation of the ball indentation test makes it accurate, simple, strain rate controlled, fast (less than 10 minutes per test), and economical (cheaper than a destructive tensile test) for both field and laboratory applications. It should be emphasized here that results from ABI tests conducted under multiaxial compression loading may not correlate with results from uniaxial tensile tests conducted on materials that exhibit different behavior under tensile or compression loading, such as those fabricated from powder compacts. Conclusions 1. Computer control and data analysis of cyclic ball indentation testing made it simple, rapid, accurate, economical, and reproducible. 2. The laboratory version of the field indentation microprobe (FIM) performed successful automated ball indentation (ABI) tests on different materials. 3. Excellent agreement was obtained between yield strength and flow properties measured by both ABI and uniaxial tensile tests. The yield strength and strain-hardening exponent values determined from ABI and tensile tests were within + 2%. 4. ABI tests also were successful in mapping out localized changes in mechanical properties of base metal, HAZ, and weld materials. 5. ABI-estimated fracture toughness were within + 11% from measured values for A533 Grade B, Class 1 steel. 6. An FIM apparatus was conceived for evaluating the structural integrity of metallic components in situ in a nondestructive manner. 7. The FIM apparatus should be useful in mapping out localized changes in the mechanical and physical properties of deformed, aged, and embrittled structural components. Acknowledgment This work was partially supported by the Office of Nuclear Regulatory Research, Division of Engineering, U. S. Nuclear Regulatory Commission under Interagency Agreement DOE 1886-80119B with the U.S. Department of Energy under contract DE-AC05-84OR21400 with Martin Marietta Energy Systems, Inc.
REFERENCES [1] Haggag, F. M., "Field Indentation Microprobe for Structural Integrity Evaluation," U.S. Patent No. 4,852,397, August 1, 1989, foreign patents pending. [2] Haggag, F. M., Nanstad, R. K., and Braski, D. N., "Structural Integrity Evaluation Based on an Innovative Field Indentation Microprobe," Innovative Approaches to Irradiation Damage and Failure Analysis, D. L. Marriott, T. R. Mager, and W. H. Bamford, Eds., PVP Vol. 170, American Society of Mechanical Engineers, New York, 1989, pp. 101-107. [3] Haggag, F. M. and Nanstad, R. K., "Estimating Fracture Toughness Using Tension or Ball Indentation Tests and a Modified Critical Strain Model," Innovative Approaches to Irradiation Damage and Failure Analysis, D. L. Marriott, T. R. Mager, and W. H. Bamford, Eds., PVP Vol. 170, American Society of Mechanical Engineers, New York, 1989, pp. 41-46. [4] Haggag, F. M. and Lucas, G. E., "Determination of Lüders Strains and Flow Properties in Steels from Hardness/Microhardness Tests," Metallurgical Transactions A, 14A, (1983), pp.1607-1613.
HAGGAG ET AL. ON AUTOMATED BALL INDENTATION TESTING
207
[5] Haggag, F. M., "The Role of Lüders Strain in Predicting Flow Properties in Steels from an Instrumented Hardness Test," M.S. Thesis, Department of Chemical and Nuclear Engineering, University of California, Santa Barbara, California, 1980. [6] Au, P., Lucas, G. E., Sheckherd, J. W., and Odette, G. R., "Flow Property Measurements from Instrumented Hardness Tests," Non-destructive Evaluation in the Nuclear Industry, Metals Park, OH., 1980, pp. 597-610. [7] Tabor, D., "The Hardness of Metals," Clarendon Press, Oxford, 1951. [8] Francis, H. A., "Phenomenological Analysis of Plastic Spherical Indentations," Transactions of the ASME, July 1976, pp. 272-281. [9] George, R. A., Dinda, S., and Kasper, A. S., "Estimating Yield Strength from Hardness Data", Metal Progress, May 1976, pp. 30-35. [10] Pandey, R. K., and Banerjee, S., "Strain Induced Fracture in Low Strength Steels," Engineering Fracture Mechanics, Vol. 10, 1978, pp. 817-29. [11] Ritchie, R. O., Server, W. L., and Waullaert, R. A., "Critical Fracture Stress and Fracture Strain Models for Prediction of Lower and Upper Shelf Toughness in Nuclear Pressure Vessel Steels," Metallurgical Transactions A, Vol. 10A, 1979, pp. 1557-70. [12] Haggag, F. M., Reuter, W. G., and Server, W. L., "Recovery of Fracture Toughness of Irradiated Type 347 Stainless Steel Due to Thermal Stress Relief: Metallographic and Fractographic Studies," Proceedings of the 2nd International Symposium on Environmental Degradation of Materials in Nuclear Power SystemsWater Reactors, Monterey, California, September 9-12, 1985, 1986, pp. 509-14. [13] Pavinich, W. A., "The Effect of Neutron Fluence and Temperature on the Fracture Toughness and Tensile Properties for a Linde 80 Submerged Arc Weld," Proceedings of the 2nd International Symposium on Environmental Degradation of Materials in Nuclear Power Systems-Water Reactors, Monterey, California, September 9-12, 1985, 1986, pp. 485-95. [14] Haggag, F. M., Server, W. L., Lucas, G. E., Odette, G. R., and Sheckherd, J. W., "The Use of Miniaturized Tests to Predict Flow Properties and Estimate Fracture Toughness in Deformed Steel Plates, "Journal of Testing and Evaluation, Vol. 1, No. 1, Jan. 1990, pp. 62-69. [15] Naus, D. J., Nanstad, R. K., Bass, B. R., Merkle, J. G., Pugh, C. E., Corwin, W. R., and Robinson, G. C., "Crack-Arrest Behavior in SEN Wide Plates of Quenched and Tempered A 533 Grade B Steel Tested Under Nonisothermal Conditions", NUREG/CR-4930, ORNL-6388, Aug. 1987, p. 31. [16] Odette, R. G., Lombrozo, P. M., and Wullaert, R. A., "Relationship Between Irradiation Hardening and Embrittlement of Pressure Vessel Steels," Effects of Radiation on Materials: Twelfth International Symposium, ASTM STP 870, F. A. Garner and J. S. Perrin, Eds., American Society for Testing and Materials, Philadelphia, 1985, pp. 840-860. [17] Haggag, F. M., Wong, H., Alexander, D. J., and Nanstad, R. K., "The Use of Field Indentation Microprobe in Measuring Mechanical Properties of Welds," presented at the 2nd International Conference on Trends in Welding Research, May 14-18, 1989, Gatlinburg, TN.
DISCUSSION F. Smith1 (written discussion) — The use of a ball indenter is a compressive-type load application. It is also multiaxial. The first goal of any research in this area should be to demonstrate the correlation between uniaxial compression data and multiaxial ball indentation data. Given that such a correlation exists, then it becomes the opinion of the engineer to make the assumption that tensile properties and compression properties are similar enough to be seen as interchangeable. Attempting to correlate multiaxial compression data with uniaxial tensile data directly is clearly omitting an essential part of the research process. 1
Sarcos Research Corporation, Salt Lake City, UT 84111.
208
AUTOMATION IN FATIGUE AND FRACTURE TESTING
F. M. Haggag et al. (authors’ closure) — For most homogenous and isotropic metallic materials, uniaxial tension and compression test results are reasonably comparable. Results from automated ball indentation tests, conducted under multiaxial compression loading, compared very well with those from uniaxial compression and uniaxial tension (the latter was demonstrated in this paper for several ferritic and austenitic steels and welds tested at different irradiation and thermal aging conditions). However, it should be emphasized here that results from ball indentations tests may not correlate with results from uniaxial tension tests conducted on materials that exhibit different behavior under tension or compression loading, such as those fabricated from powder compacts.