Use of Classification and Regression Trees (CART) to Classify Remotely-Sensed Digital Images Helio Radke Bittencourt
Robin Thomas Clarke
Departamento de Estatística – Faculdade de Matemática Pontifícia Universidade Católica - PUCRS Porto Alegre, RS - Brazil
[email protected]
Centro Estadual de Pesquisas em Sensoriamento Remoto Universidade Federal do Rio Grande do Sul - UFRGS Porto Alegre, RS - Brazil
[email protected]
Abstract— Binary tree-structured rules can be viewed in terms of repeated splits of subsets of the feature space into two descendant subsets, starting from the entire feature space and ending in a partition of the feature space associated with each class. This paper presents a brief introduction to binary decision trees and shows results obtained in the classifying Landsat-TM and AVIRIS digital images.
The decision tree begins with a root node t derived from whichever variable in the feature space minimizes a measure of the impurity of the two sibling nodes. Using the definition given in [1], the measure of the impurity at node t, denoted by i(t), is as shown in the following equation (1),
Keywords-image processing; decision trees; CART; pattern recognition; high-dimensional data
i (t ) = −¦ p( w j | t ) log p( w j | t )
k
I.
CLASSIFICATION AND REGRESSION TREES
The use of binary decision trees for classification is a nonparametric approach to pattern recognition. A decision tree provides a hierarchical representation of the feature space in which patterns xi are allocated to classes wj (j=1,2,...,k) according to the result obtained by following decisions made at a sequence of nodes at which branches of the tree diverge. The type of decision tree used in this paper is discussed in detail by Breiman et al. [1], whose contributions have been summarized by the letters CART (Classification And Regression Trees). These letters indicate that trees may be used not only to classify entities into a discrete number of groups, but also as an alternative approach to regression analysis in which the value of a response (dependent) variable is to be estimated, given the value of each variable in a set of explanatory (independent) variables. Binary decision trees consist of repeated divisions of a feature space into two sub-spaces, with the terminal nodes associated with the classes wj. A desirable decision tree is one having a relatively small number of branches, a relatively small number of intermediate nodes from which these branches diverge, and high predictive power, in which entities are correctly classified at the terminal nodes. A. Mode of operation of CART. CART involves the identification and construction of a binary decision tree using a sample of training data for which the correct classification is known. The numbers of entities in the two sub-groups defined at each binary split, corresponding to the two branches emerging from each intermediate node, become successively smaller, so that a reasonably large training sample is required if good results are to be obtained [2].
(1)
j =1
where p(wj | t ) is the proportion of patterns xi allocated to class wj at node t. Each non-terminal node is then divided into two further nodes, tL and tR, such that pL , pR are the proportions of entities passed to the new nodes tL, tR respectively. The best division is that which maximizes the difference given in (2):
∆i ( s, t ) = i (t ) − pLi (t L ) − pR i (t R )
(2)
The decision tree grows by means of the successive subdivisions until a stage is reached in which there is no significant decrease in the measure of impurity when a further additional division s is implemented. When this stage is reached, the node t is not sub-divided further, and automatically becomes a terminal node. The class wj associated with the terminal node t is that which maximizes the conditional probability p(wj | t ). II.
RESULTS
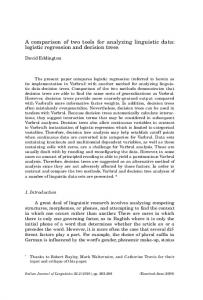
Two segments of digital images collected by the sensors TM and AVIRIS were analysed and classified using CART. A. Landsat-TM Image The first image was a segment of a Landsat-TM image (six spectral bands) showing a large lagoon situated near the town of Santo Antônio da Patrulha in the State of Rio Grande do Sul (RS), in southern Brazil. Fig. 1 shows the three classes of surface characteristic: namely water, cultivated land and natural vegetation. A training sample of 1084 pixels was used to construct the tree using the software Genstat 6.1, which contains a number of useful directives for CART analysis. Fig. 2 shows the tree obtained.
0-7803-7930-6/$17.00 (C) 2003 IEEE
Table I gives the results obtained from classifying a validation sample of 1214 pixels that were not used during the process of tree construction. There is very good separation between the three classes, and the percentage of pixels correctly classified during this verification exceeded 99%. B. AVIRIS Image The second image considered was a segment of an AVIRIS image of a rural area in the state of Indiana, USA. Three classes were used which had very similar spectral response; the three classes are denoted by ‘corn notill’, ‘soybean notill’ and ‘soybean minimum tillage’. Although the AVIRIS sensor has some 220 bands, only 16 were used for the purpose of an exploratory example. A small training sample of 28 pixels was used as input to the software Genstat 6.1, and the tree so generated is shown in Fig. 4. It is seen that the tree construction used only three bands of the 16 available, having itself determined that the remaining 13 were redundant.
Spectral response of the three classes 250
Water Cultivated Land
Digital Numbers
200
Natural Vegetation
150 100
A holdout sample of 28 pixels was then used for validation, with the results shown in Table 2. It is seen that ‘Corn’ is clearly separated from the two soybean classes, although about 11% of ‘soybean notill’ were incorrectly classified as ‘soybean minimum tillage’.
50 0 B1
B2
B3
B4
B5
B7
TABLE I.
RESULTS OF CLASSIFICATION OBTAINED FROM THE VALIDATION SAMPLE: LANDSAT
Bands
Classification: True class:
Water (w1)
Cultivated (w2)
Vegetation (w3)
Water (w1)
750 100.0% 0 0.0% 0 0.0%
0 0.0% 240 100.0% 3 1.3%
0 0.0% 0 0.0% 221 98.7%
Figure 1. Segment of a Landsat-TM image, composition 5-4-2, and mean spectral behavior of the three classes denoted by Water, Cultivated, and Vegetation.
Cultivated (w2) Vegetation (w3)
40
w1 30
20
w3
w2
Classes
Figure 2. Classification tree constructed using the software Genstat
The tree used only two spectral bands, although the image contained data on six; the two bands were sufficient in themselves to give the classification required. Fig. 3 shows the subdivision of the feature space determined by the decision tree.
Banda 1
10 w3
w3 0
w2 w1
0
10
20
30
40
50
60
70
80
90 100 110 120 130
Banda 4 Figure 3. Subdivisions of the feature space determined by the decision tree.
0-7803-7930-6/$17.00 (C) 2003 IEEE
III.
FINAL REMARKS
Decision trees employ a strategy in which a complex problem is divided into simpler sub-problems, having the advantage that it becomes possible to follow the classification process through each node of the decision tree. Since the method is essentially non-parametric, it has the additional advantage of not requiring assumptions about the functional form of the statistical distribution of data. For the data used in this paper, good results were obtained for the separation of classes that were both spectrally similar (AVIRIS) and spectrally distinct (Landsat-TM).
Figure 4. Classification tree constructed by software Genstat: AVIRIS image.
TABLE II.
RESULTS OF CLASSIFICATION OBTAINED USING THE VALIDATION SAMPLE - AVIRIS Classification:
True class:
Corn notill (w1)
Soybean notill (w2)
Soybean min. (w3)
10 0 0 100.0% 0.0% 0.0% 0 8 1 Soybean notill (w2) 0.0% 88.9% 11.1% 0 1 8 Soybean min. (w3) 0.0% 11.1% 88.9% Overall percentage correctly classified = 92,9% Corn notill (w1)
We emphasize that it was the computer algorithm itself that selected the bands with maximum discriminatory power, thus providing useful information for the researcher. It is also noted that for the AVIRIS data, good results were obtained even with the small samples used. ACKNOWLEDGMENT The authors acknowledge with gratitude the valued contributions to their work of Professor Vitor Haertel, of the Centro Estadual de Pesquisas em Sensoriamento Remoto, RS, Brazil. The first author also thanks PUCRS, the Pontífica Universidade Católica of Rio Grande do Sul, for its financial support and encouragement. REFERENCES [1] [2]
L. Breiman, J. H. Friedman, R. A. Olshen and C. J. Stone, Classification and Regression Trees. Belmont, CA: Wadsworth, 1984. G. J. McLachlan. Discriminant Analysis and Statistical Pattern Recognition. New York: John Wiley & Sons, 1992.
0-7803-7930-6/$17.00 (C) 2003 IEEE