Use of Classification Techniques to Design Laser Cutting Processes
Recommend Documents
software. Our results demonstrate the potential of DOE to optimize laser .... If the position of the focus is set on top of the material, its value is defined as zero.
In all machining processes, the workpiece is a shape that can entirely cover the
final part shape. ...... We develop a simple model of the economics of machining.
acre site, you will find state-of-the-art production machinery, the latest in CAD
design ... Laser cutting on a 3000 watt Bystronic Laser System. • High precision of
...
Water storage facilities, aqueducts, and drainage facilities. – Technologies ...
Integrated land and water management for total ... (operational) energy demand.
Draw a RECTANGLE with dimensions of 24” x 12”. Place the ... Open Corel Draw
v12 by double clicking the icon on the desktop or going to. Start >> All ...
Jan 8, 2009 - 8, 1999. (Earliest possible public availability is believed to be Nov. 1, 2001) (This ... the amount and t
Laser Cutting. Over the past decade, laser cutting has developed into state-of-the
-art technology. ... material handling around the cutting table. Predictions are that
laser ..... These oxides obstruct the subsequent welding procedure. TIG welds ..
Jun 13, 2012 - 2. Land Use/Cover Classification. Techniques Using Optical Remotely. Sensed Data in Landscape Planning. Onur Åatır and Süha BerberoÄlu.
International Journal of Engineering Trends and Technology (IJETT) â Volume 10 Number 4 - Apr ... Figure 1 Delta robot sketch model with three degree angle.
Bachmann, Friedrich, Loosen, Peter , and Poprawe, Reinhart, High power diode lasers. Springer Series in Optical Sciences. Vol. 128. 2007, New York: Springer ...
Power measurements tests at different stages for a nominal power of 2000W. Power. Diode laser source. Fibre laser source. Drive 1(940. &980nm module).
Computer programming is a difficult subject, especially for novice learners. ... Programming environments on mobile phones for learning Java could include.
material flows which retain value through each reincarnation. First coined in the 1970's by Swiss Architect Walter R. Sahel, the term C2C was refined at the ...
acceleration of molten material in a direction transverse to the cutting one. ..... zw y x zw. P. zyxI. L Ï. (33). B. Surface absorptivity. After having determined for each position the incident laser intensity ... All cutting front profiles have to
Nov 20, 2010 - plasma cutting. For advanced contour cutting processes of the greater importance is determining of cutting data, ... Keywords: laser cutting, abrasive water jet cutting, plasma cutting, cutting data, cutting rate. ... applying high fee
For experimental design and parametric analysis robust design is used i.e. a fractional factorial experimental design with an appropriate orthogonal array ...
to cut since the laser cutting head has to stop and move from cut to cut more often
than when it cuts along a continuous path. Custom Laser Cutting Guide.
28 Apr 2016 - method to design and produce different pneumatic devices using a laser .... In this section, it is described how a laser-cut pneumatic piston.
tors and editors frequently cut between shots to present new views of a scene .... If the subject is established in the right section of the frame, she must remain in.
Laser cutting machine produced by our company is chiefly classified into the following items: 1. .... high-speed, precis
stationary shearing processes have to be modelled in 3-D. For the calculation of the ... state of the guillotining process a 3-D finite element model is developed.
The orthogonal metal cutting process for a controlled contact tool is .... A
fundamental approach to develop a general predictive cutting theory was desired
.
are stacked on top of each other (step 1), resulting in a multidirectional alignment of the fiber layers (step 2). ... Life-Module with CFRP Passenger Compartment.
This study proposes a software framework, coupling pyFormex [11] and Abaqus [12], allowing to analyze numerically a stent design from the laser-cutting stage ...
Use of Classification Techniques to Design Laser Cutting Processes
bDepartment for Nonlinear Dynamics of Laser Processing (NLD) of RWTH Aachen University, SteinbachstraÃe 15, 52074 Aachen, .... algorithms are used to solve various types of problems. In this ..... Physics Procedia 2011;12, Part A:11 â 20.
Available online at www.sciencedirect.com
ScienceDirect Procedia CIRP 52 (2016) 292 – 297
Changeable, Agile, Reconfigurable & Virtual Production
Use of Classification Techniques to Design Laser Cutting Processes Hasan Tercan* , Toufik Al Khawlib , Urs Eppeltb , Christian B¨uschera , Tobias Meisena , Sabina Jeschkea a Institute
of Information Management in Mechanical Engineering (IMA) of RWTH Aachen University, Dennewartstraße 27, 52068 Aachen, Germany for Nonlinear Dynamics of Laser Processing (NLD) of RWTH Aachen University, Steinbachstraße 15, 52074 Aachen, Germany
1. Introduction Nowadays, production companies in high-wage countries face the challenge of meeting individual customer requirements and rapidly changing market demands while keeping costs low. Providing a reliable but efficient production leads to growing complexities in the production processes [1]. Production planning and scheduling requires a large amount of human information processing and decision making. In particular in the field of manufacturing process planning, decisions involve the consideration of the effect of multidimensional parameters on preselected criteria of the manufacturing process. For instance, one common problem is the choice of an appropriate machine parameter set that results in desirable process outputs (e.g. high output quality or minimal energy consumption). Due to a highdimensional domain space, the relationships between interdependent parameters and criteria is very difficult to achieve. In addition, they are very complex for the human mind to handle at a time. In order to handle these problems, process designers make use of modern computational approaches for modeling and simulating manufacturing processes. The conventional technique is to perform several sets of simulation runs on the process, whereas each individual simulation is characterized by a highdimensional set of parameters and several criteria [2]. The
problem is that revealing the whole process behavior requires a very large number of time-consuming experiments. It is not feasible to run full numerical simulations throughout the whole parameter space at a reasonable computational cost. Because of that, experimental simulation runs are performed by appropriate Design of Experiment (DoE) techniques as well as other, experience-based procedures. Since simulations are based on discrete sets of process parameters, they can only cover partial aspects of the process and do not provide insights into the whole process. This is essential when it comes to extract useful information from the results and to understand the overall behavior of the underlying manufacturing process. There exist different ways to cope with the computational complexity for analyzing processes and simulation results. At present, a paradigm shift is taking place towards a data driven simulation analysis by the use of data mining techniques. Data mining is the process of discovering interesting and yet unknown knowledge in data by the application of machine-aided algorithms [3]. In the context of manufacturing process planning, data mining models support the decision making process of engineers and thus help to gain competitive advantages of complex processes. Especially classification and regression techniques can identify process limits and reveal the impact of certain process parameters on the output. Process designers can use the gained knowledge to choose appropriate parameter sets
Hasan Tercan et al. / Procedia CIRP 52 (2016) 292 – 297
for a given market demand (e.g. high quality output, process speed). For this purpose, the data mining results need to provide accurate insights in an intuitive way. Many existing solutions involve black box approaches that make it difficult to understand and contextualize the findings. Hence, within the scope of this paper, one key requirement is that the applied models are interpretable for the user. In addition to that, they need to accurately reflect the underlying manufacturing process and produce reliable results. In order to fulfill these requirements, this paper answers the following two research questions: • How can data mining techniques in terms of classification and regression provide reliable decision support to optimize a manufacturing planning process? • What are the necessary steps of evaluation and visualization to overcome the trade-off between interpretability and accuracy of the models? The paper is organized as follows: Section 2 presents the related work. It briefly introduces the data mining process, including classification and regression trees that are investigated. Furthermore, it includes related work that deals with data mining solutions in the context of manufacturing simulation. Section 3 describes the laser cutting process for sheet metal. It provides the use case for an exemplary application of classification and regression trees in section 4. The evaluation results provide answers to the stated research questions. Finally, section 5 summarizes the main issues of this paper and gives an outlook on our future research.
2. Related work 2.1. Data Mining and Knowledge Discovery In the narrow sense, data mining means the application of machine learning techniques for extracting certain patterns in data [4]. However, the solely application of algorithms does not suffice for gaining knowledge from data. For this purpose, different process models have been developed to provide an overview of essential steps that have to be taken for data mining. A popular model that is widely used within the data mining community is the process for knowledge discovery in databases (KDD) [5]. Given that the relevant data is collected, the KDD process basically consists of three large phases: pre-processing (e.g. data cleaning and transformation), modeling, and model evaluation (see Fig. 1). In a broader sense data mining is referred to be the knowledge discovery process that comprises all of these steps. The modeling step of the data mining process involves the application of learning algorithms to reveal certain patterns. The algorithms are used to solve various types of problems. In this paper, two existing learning tasks are studied: classification and regression. Classification is based on the following idea: given a certain problem domain, unknown relations can be identified on the basis of existing observations. Classification is used to learn a so called classifier on such a set of observations. It is applied on data which has many records, input variables (i.e. characteristics of records), and a categorical outcome variable (i.e. the target class) [6]. Given such a data set, the purpose is to train a
Preprocessing Data cleaning Filtering Transformation
Analysis
Evaluation
Correlation Classification Regression
Interpretation Visualization Documentation
Fig. 1. Important steps of the knowledge discovery process [5]
model that analyzes the class label on the basis of the input variables. The found model can then be used to predict the classes of further records whose classes are not known yet. Regression is similar to classification, but instead of a categorical class, it estimates a numerical output value [3,6]. Thus, regression is applied on numerical data only. Regression algorithms are generally used to analyze the relationship between a dependent variable (outcome) and several independent ones (attributes). Once a data mining model has been learned on a training set, it is essential to evaluate its predictive performance on a separate test set. In doing so, the predicted outcomes of a model are compared with the real outcome of the test instances. Concerning the classification, the classification accuracy is one of the most widely used evaluation metrics [3]. Accuracy =
# correctly classi f ied instances # all instances
(1)
There exist different metrics to evaluate the predictive performance of a numerical prediction. This paper proposes the mean absolute error (MAE). The lower this error is, the better the model predicts the output. Assuming that p1 , . . . , pn are the predicted values of the test set and a1 , . . . , an are the actual ones, the MAE is calculated as follows [4]: MAE =
|p1 − a1 | + . . . + |pn − an | n
(2)
Various classification and regression models have been developed, each differing in certain aspects (e.g. functionality, performance, interpretability). In this paper, the main focus lies on tree-based learning models. The reason is that, in contrast to existing black-box models, they are understandable and interpretable by the user. This is one of the main requirements for the model. Furthermore, they reveal non-linear relationships between the inputs and the output variable. A tree-based model depicts a tree-structure which consists of a single root node, several internal nodes, edges and leafs [3]. A node represents a test on a certain attribute of the training set and thus divides the set into subsets. The edges that start from this node correspond to the outcome of this test. Each of them is linked to a child-node or a leaf node. A leaf specifies the class label (in classification) or the predicted numerical value (in regression). The prediction happens in a top-down manner, beginning from the root and walking down the tree. Classification and regression trees divide the input data space into several segments, where each segment corresponds to a certain target value (i.e. class or predicted value). As a result, a trained model can not only be used for predicting unknown outcomes but also to analyze the relationships between specific output ranges and input data ranges in a visual manner. The visualization aspect makes them superior to other established
294
Hasan Tercan et al. / Procedia CIRP 52 (2016) 292 – 297
machine learning techniques, such as support vector machines or artificial neural networks. In contrast to tree-based models, these models are black-box models and do not provide insights on how patterns are found. 2.2. Virtual Production Intelligence Virtual Production Intelligence (VPI) designates our concept that enables product-, factory-, and machine planners to plan products and their production collaboratively and holistically [7]. It refers to methods of an integrated handling and analysis of information generated in the context of Virtual Production as defined in the VDI Guideline 4499 Digital Factory [8]. Our research deals with a VPI driven information system that supports planners more efficiently and with a better understanding of the ongoing processes. In order to demonstrate our concepts, we implement a web-based platform that is accessible via smartphone, tablet, and personal computer. The VPI platform enables the user to trigger the integration of process data as well as its analysis over a graphical user interface. Within the domain of manufacturing processes (i.e. laser cutting), we provide exploratory and interactive analyzes that help the user to study and to validate his process models. The analyzes are based on various statistical techniques such as correlation and sensitivity analyzes [9]. 2.3. VPI and data mining in manufacturing simulation As stated before, this paper studies the use of tree-based learning methods for analyzing simulation data of manufacturing processes. However, there exist different ways to cope with the mentioned complexity for analyzing processes in manufacturing. Current research deals with issues related to the trade-off between complex (i.e. accurate) and simple (i.e. interpretable) techniques. One approach to solve this trade-off is to use sophisticated visualization techniques of highly complex models. Within our context of Virtual Production Intelligence, major contributions on this issue have been done in [10]. Here, the authors develop approximation models (so called metamodels) to reproduce the behavior of the original simulation. Metamodels act as cheap numeric surrogate models that produce simulation outputs in a less expensive and much faster way. The drawback of them is that, in order to understand the underlying relationships, sophisticated visualization techniques for multidimensional data have to be applied. Gebhardt et al. [11] developed a technique that is based on hyperslices (i.e. twodimensional planar slices of the multi-dimensional parameter space). It provides the user to navigate through the multidimensional parameter space. Such a visual exploration of the process helps to identify impacts of parameter changes on the process output. Another alternative way to solve the trade-off is to make use of both simple as well as complex data mining models. While interpretable model results are provided to the user, complex and accurate ones are used for further machine-aided optimizations. Such an approach is provided by [12]. Here, the authors make use of support vector machine (SVM) classification to explore the manufacturability of new materials within a mild steel stamping process. In order to make the results more interpretable for the user, the results of less complex models (i.e. linear SVMs) are visualized in two-dimensional input spaces.
In [13], the authors propose a visual analytics approach for analyzing discrete event manufacturing simulations. Their solution is based on the previously described KDD process with the focus on the visual examination of data mining results. Specifically, they apply clustering algorithms to find groups of similar performance values in simulation runs and conduct an interactive visualization of the found groups. For this purpose, multidimensional visualization techniques like scatter-plot matrices and parallel coordinates are used. Instead of using visualization-based approaches for gaining process understanding, it is also possible to reveal the relationships between inputs and outputs by creating different test beds for data mining. In [14], a statistical regression model (i.e. the Gaussian Process) is used as an energy consumption prediction model for a milling machine tool. Since the regression model does not provide insights on which parameters have the greatest impact, several prediction tests on different subsets of the parameter space are conducted. The subset which leads to the highest predictive accuracy of the model is regarded to be most relevant for the energy consumption model.
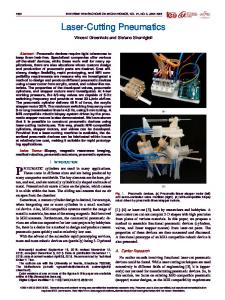
3. Laser cutting scenario 3.1. Sheet Metal Cutting Laser cutting is a thermal separation process widely used in shaping and contour cutting applications. One of the most common use cases of laser cutting in the manufacturing industry is the fusion metal cutting process. It comprises the cutting of large metal sheets into smaller pieces with specified contours. During the fusion cutting process, a high energy density laser beam is focused on a work surface. The thermal energy is absorbed which heats and transforms the work volume into a molten, vaporized, or plasma state that can easily be removed by the flow of high pressure assist gas jet [15,16]. The schematic of the laser cutting process is shown in Fig. 2a. There are gaps in understanding the dynamical behavior of the process, especially with regard to issues related to the cut quality [17]. Important degradation of the quality is due to the onset of unevenness and roughness of the cut edges as well as the appearance of adherent dross. One of the current challenges in research and development is to design beam-shaping optics such that the ripple structures on the cutting kerf surface stay minimal, as shown in Fig. 2b. For this purpose, the institute of Nonlinear Dynamics of Laser Processing (NLD) of RWTH Aachen
Fig. 2. (a) Schema of a conventional laser cutting process; (b) smooth (top) and non-smooth (bottom) cutting surface
295
Hasan Tercan et al. / Procedia CIRP 52 (2016) 292 – 297
University developed a simulation tool named QuCut. It is a numerical simulation model for continuous wave laser cutting that predicts cutting quality criteria like ripples and dross formation on the basis of several parameters [18]. However, the output of a simulation run can not only be the process criterion but also the technical or physical feasibility of a laser cut. In fact, QuCut also identifies simulation runs with non-feasible cuts.
Table 2. Different sizes of decision trees and their accuracy performances Sample Size
Tree Size
Accuracy
100% 100% 100%
693 nodes 131 nodes 15 nodes
97.88% 95.45% 93.83%
75% 50% 20%
573 nodes 359 nodes 145 nodes
97.22% 95.99% 94.92%
3.2. Simulation data In this paper, the simulation data from QuCut provides the basis for the classification and regression analyzes in section 4. The data set contains in total 22, 454 instances, whereas 20, 237 represent feasible cuts and 2, 217 non-feasible cuts. It consists of 5 laser optics design parameters and a single process criterion. The parameters are the beam quality, the astigmatism, the focal position, and the beam radius in both the x and y directions (as an elliptical laser beam was used). The properties of the parameters are listed in Table 1. Table 1. Data basis of process simulation Beam Parameter M2
The selected criterion is the surface roughness (Rz in μm) that represents the ripple structure of the laser cut. Rz is simulated at a 7mm depth of an 8 mm workpiece and ranges from 0.2μm to maximum 631μm. In the cases of non-feasible cuts in the simulation, Rz is assigned a value of −1.
of the trees. The second step involves the application of full classification trees on different portions of the data. Since the process simulation is a time-consuming and cost-intensive task, it would be beneficial to see whether small data sets provide a sufficient amount of information for classification. The evaluation within the experiments is performed by 10-fold crossvalidation. It makes use of the accuracy metric (see section 2.1) for comparing the resulting models. Table 2 lists the experimental results. They show that manually reducing the size of classification trees slightly deteriorates the predictive performance from 97.88% to 93.83%. However, as it can be seen, a small tree (with 15 nodes) is accurate enough to identify feasible and non-feasible cut regions in the parameter space. In this case the tree consists of seven inner nodes and eight leaf nodes (see Fig. 3). It can be seen that the learning algorithm chooses the astigmatism as the first parameter to be split. This means that astigmatism distinguishes the best between parameter sets of feasible and non-feasible cut regions. In fact, on the basis of the QuCut simulation data, the process always results in a cut whenever the astigmatism is above 5mm. Another interesting
Astigmatism
4. Application of data mining in laser cutting
≤ 5mm
Choosing the appropriate machine parameter set is a crucial ingredient in coping with the complex laser cutting task. In this paper, two different problems are solved with data mining. On the one hand, classification models are used to reveal the process limits concerning the feasibility of a laser cut. The goal is to identify machine parameter sets at which a cut is feasible or, respectively, not feasible. On the other hand, regression models help to find parameters of laser optics that lead to minimal ripple structure of the cut. The data basis for both problems is provided by QuCut. Section 4.3 provides a deeper discussion of the experimental results.
FocalPosition ≤ 0mm
yes
> 0mm
w0y ≤ 134μm
yes > 134μm
yes
w0x ≤ 100μm
> 100μm
FocalPosition
4.1. Cut feasibility prediction First of all, the simulation data needs to be transformed to a classification data basis. For this purpose, a new binary field named cut (yes or no) is generated as the target class. It represents the feasibility of a cut for the respective parameter settings. In the first step, several classification experiments with different tree sizes are conducted on the whole simulation data. The goal is to investigate the trade-off between complexity and accuracy
> 5mm
≤ -5mm
yes
> -5mm
Astigmatism ≤ 0mm
yes
Astigmatism
> 0mm
≤ 0mm
no
no
> 0mm
no
Fig. 3. Resulting classification tree to identify no-cut-regions
296
Hasan Tercan et al. / Procedia CIRP 52 (2016) 292 – 297
result is that the beam quality is not considered in the small tree at all. This suggests that it has the least influence on the class output. 4.2. Ripple quality prediction In the second evaluation, regression tasks are performed on the simulation data to examine the relationship between the five input parameters and the roughness of the cut. Since the simulation data exists in the appropriate format for applying regression, data preprocessing is hardly needed for this solution. Only examples that represent the non-feasible regions are removed from the original data set. The resulting set consists of 20, 237 examples. The experiments closely resemble those from the classification analysis. Instead of the accuracy, the evaluation considers the mean-absolute error (see also section 2.1).
Fig. 4. Separation of roughness values: (a) Good separation; (b) Bad separation
The results in table 3 show that minimizing the tree size highly deteriorates the predictive performance. The best prediction of the roughness is gained with the most complex tree. The reason is that the underlying regression problem is a more complex one than the binary classification problem. As a matter of fact, the tree is too complex to be interpreted by the user. An alternative way to gain insights into the results is to visualize the predictions of the model. Fig. 4 shows two density plots for the numeric prediction of Rz in 2-dimensional spaces. The left one (a) depicts a good separation of low and high roughness values. It shows that low values of astigmatism and beam radius in xdirection produce large roughness regions of laser cuts (yellow and areas). However, as it can be seen in Fig. 4b, other parameters produce bad separations of the output and thus do not provide many useful insights for the user.
ting process, interested readers may refer to [11]. In some use cases, such as the prediction of desirable process output ranges, a possible solution to overcome the complexity of a regression problem is to transform it into a classification problem. This is accomplished by discretizing the numerical output (i.e. the criterion) into a user-specified categorical class (e.g. class of small roughness regions). After that, classification trees can be used to predict the class on the basis of the input parameters. In general, the user has to solve the trade-off between interpretability and accuracy of the data mining models. Whether simple and interpretable or complex but accurate trees are found appropriate depends on the specific use case. In our scenario, the understanding of the underlying laser cutting process has a high priority. Because of that, we focus on simple models with sufficient accuracy. In contrast to that, if models are generally used to predict unknown outcomes of a process, one might prefer the more accurate ones. The results show that data mining helps to understand as well to optimize the laser cutting process. For instance, in the case of classification trees, the potential benefit is that the obtained results can be used for subsequent planning and simulation experiments. If the boundaries between feasible and non-feasible regions are known, unnecessary experiments in non-feasible regions can be avoided. As a matter of fact, optimized design of experiments reduce time and costs for process planning. Concerning the use regression trees, they answer the question which parameter settings lead to desirable laser cut qualities. The main benefit is that they can be used to predict unknown process outcomes for continuous operating points. This makes them superior to time-consuming simulation experiments that reveal only a discrete set of potentially beneficial parameter settings.
4.3. Discussion of results
4.4. Implementation in the VPI Platform
As the evaluation results show, the advantage of complex classification and regression trees are the accurate prediction of the outcome and a fine-grained segmentation of the parameter space. However, the more complex a model becomes, the harder it is to interpret the found patterns. In order to gain any process understanding, the data mining results need to be visualized. The section above shows a two-dimensional visualization of the regression results. It has to be stated that this kind of visualization is static, which means that only two parameters can be considered at once while the other ones are not changed. Such a two-dimensional visualization of a multidimensional problem might not suffice. Current research deals with more sophisticated visualization techniques in multidimensional spaces. Concerning such a solution for the laser cut-
As described in section 2.2, we implement our concept of the Virtual Production Intelligence in a web-based platform. Currently we are extending the functionalities by the evaluated treebased learning methods. For each simulation process, the user can upload the corresponding data source to the platform. Subsequently, the platform triggers the integration of the data and the application of classification and regression trees. During these steps, the simulation data as well as the analysis results are stored in a database. Thus the user is able to access them at any time. As an example, Fig. 5 shows the implementation of a classification tree in the laser cutting domain. By selecting a certain simulation process, the respective classification tree is retrieved from the database. In the case of regression, the user is also able to select the process criterion to be analyzed.
Table 3. Different sizes of regression trees and mean-absolute error performances Sample Size
Tree Size
Mean-absolute error
100% 100% 100%
3199 nodes 597 nodes 61 nodes
11.6 14.1 25.3
75% 50% 20%
2779 nodes 1883 nodes 683 nodes
19.5 22.4 28.0
Hasan Tercan et al. / Procedia CIRP 52 (2016) 292 – 297
Countries at RWTH Aachen University. References
Fig. 5. Examining a classification tree in the VPI platform
5. Summary and outlook The conducted experiments showed that data mining techniques in terms of classification and regression can indeed help to gain insights to complex manufacturing processes. A small and simple classification tree does not only provide accurate predictions of feasible laser cuts but also allows designers to analyze the relationships between the process parameters and the cut feasibility. In addition, the implemented regression trees accurately predict the laser cut roughness on the basis of the parameters. Finding an appropriate trade-off between interpretability and accuracy of data mining models is a challenging task. We concluded that one possibility to solve the trade-off is to use appropriate visualization. Thus, possible future research will focus on sophisticated visualization techniques for complex models in laser cutting. Since major contributions on this issue have been done by [11], we will investigate the integration of these solutions into the VPI platform. They will allow the user to interact with the data mining results and to visually explore the found patterns. In addition to the integration of visualization techniques, we will extend the data mining process by further learning techniques. So far, we demonstrated how to use classification and regression models to predict the output of a single criterion (i.e. the roughness). However, there exist more process and quality related criteria that need to be investigated in a laser cutting process, such as the cutting speed or the dross formation. Future research will deal with the investigation of several criteria at once by adding clustering techniques in the preprocessing phase. In a two-stage analysis process, the user will first be able to identify multidimensional simulation outputs of interest (e.g. high cut quality and simultaneously high cutting speed). In the subsequent stage, classification techniques will be used to identify parameter settings that lead to these outputs. Acknowledgements The approaches presented in this paper are supported by the German Research Foundation (DFG) within the Cluster of Excellence Integrative Production Technologies for High-Wage
[1] Brecher, C., editor. Integrative Production Technology for High-Wage Countries. Berlin, Heidelberg: Springer-Verlag; 2012. [2] Otto, A., Koch, H., Leitz, K.H., Schmidt, M.. Numerical Simulations - A Versatile Approach for Better Understanding Dynamics in Laser Material Processing. Physics Procedia 2011;12, Part A:11 – 20. Lasers in Manufacturing 2011 - Proceedings of the Sixth International {WLT} Conference on Lasers in Manufacturing. [3] Han, J., Kamber, M., Pei, J.. Data Mining: Concepts and Techniques. 3rd ed.; Morgan Kaufmann Publishers Inc.; 2011. [4] Witten, I.H., Frank, E., Hall, M.A.. Data Mining: Practical Machine Learning Tools and Techniques. 3rd ed.; Morgan Kaufmann Publishers Inc.; 2011. [5] Fayyad, U.M., Piatetsky-Shapiro, G., Smyth, P.. From Data Mining to Knowledge Discovery: An Overview. In: Advances in Knowledge Discovery and Data Mining. American Association for Artificial Intelligence; 1996, p. 1–34. [6] Larose, D.T.. Discovering Knowledge in Data: An Introduction to Data Mining. 1 ed.; Wiley-Interscience; 2004. [7] Reinhard, R., B¨uscher, C., Meisen, T., Schilberg, D., Jeschke, S.. Intelligent Robotics and Applications: 5th International Conference, ICIRA 2012, Montreal, QC, Canada, October 3-5, 2012, Proceedings, Part I; chap. Virtual Production Intelligence – A Contribution to the Digital Factory. Springer Berlin Heidelberg; 2012, p. 706–715. [8] VDI Guideline. Digital Factory - Fundamentals (VDI 4499 - Part 1). 2008. Berlin: Beuth. [9] Reinhard, R., Khawli, T.A., Eppelt, U., Meisen, T., Schilberg, D., Schulz, W., et al. Enabling Manufacturing Competitiveness and Economic Sustainability: Proceedings of the 5th International Conference on Changeable, Agile, Reconfigurable and Virtual Production (CARV 2013), Munich, Germany, October 6th-9th, 2013; chap. The Contribution of Virtual Production Intelligence to Laser Cutting Planning Processes. Springer International Publishing; 2014, p. 117–123. [10] Al Khawli, T., Eppelt, U., Schulz, W.. Machine Learning, Optimization, and Big Data: First International Workshop, MOD 2015; chap. Advanced Metamodeling Techniques Applied to Multidimensional Applications with Piecewise Responses. Springer International Publishing; 2015, p. 93–104. [11] Gebhardt, S., Hentschel, B., Kuhlen, T., Al Khawli, T., Schulz, W.. Hyperslice Visualization of Metamodels for Manufacturing Processes. In: 2013 IEEE Visualization Conference (VIS): Atlanta, GA, USA, 13 Oct 18 Oct 2013. IEEE; 2013,. [12] Zhou, Y., Saitou, K.. Identification of Manufacturability Constraints Through Process Simulation and Data Mining. In: ASME 2014 International Design Engineering Technical Conferences and Computers and Information in Engineering Conference. American Society of Mechanical Engineers; 2014,. [13] Feldkamp, N., Bergmann, S., Strassburger, S.. Knowledge Discovery in Manufacturing Simulations. In: Proceedings of the 3rd ACM SIGSIM Conference on Principles of Advanced Discrete Simulation. SIGSIM PADS ’15; ACM; 2015, p. 3–12. [14] Park, J., Law, K.H., Bhinge, R., Biswas, N., Srinivasan, A., Dornfeld, D.A., et al. A Generalized Data-Driven Energy Prediction Model with Uncertainty for a Milling Machine Tool using Gaussian Process. In: ASME 2015 International Manufacturing Science and Engineering Conference. American Society of Mechanical Engineers; 2015,. [15] Dubey, A.K., Yadava, V.. Laser Beam Machining A Review. International Journal of Machine Tools and Manufacture 2008;48(6):609 – 628. [16] Radovanovic, M., Madic, M.. Experimental Investigations of CO2 Laser Cut Quality: A Review. Nonconventional Technologies Review 2011;4:35–42. [17] Schulz, W., Kostrykin, V., Zefferer, H., Petring, D., Poprawe, R.. A Free Boundary Problem Related to Laser Beam Fusion Cutting: ODE Approximation. International Journal of Heat and Mass Transfer 1997;40(12):2913 – 2928. [18] Vossen, G., Sch¨uttler, J., Nießen, M.. Recent Advances in Optimization and its Applications in Engineering: The 14th Belgian-FrenchGerman Conference on Optimization; chap. Optimization of Partial Differential Equations for Minimizing the Roughness of Laser Cutting Surfaces. Springer Berlin Heidelberg; 2010, p. 521–530.