FLUIDIZED BED COAL DRYING AT LOW TEMPERATURES by. Edward Levy, Hugo Caram, Gu Feng,. Zheng Yao, Zhang Wei, and Nenad Sarunac.
FLUIDIZED BED COAL DRYING AT LOW TEMPERATURES by Edward Levy, Hugo Caram, Gu Feng, Zheng Yao, Zhang Wei, and Nenad Sarunac Energy Research Center, Lehigh University 117 ATLSS Drive, Bethlehem, Pennsylvania 18015 Mark Ness and Charles Bullinger Great River Energy Coal Creek Station Underwood, North Dakota
ABSTRACT Low rank fuels contain significant quantities of water, with the moisture content of subbituminous coals ranging from 15 to 30 percent and that for lignites from 25 to 40 percent. High fuel moisture causes several adverse impacts on the operation of a pulverized coal generating unit, resulting in fuel handling problems, and affecting heat rate, stack emissions, and the consumption of water used for evaporative cooling. The authors are involved in a research program to develop a process for partially drying coal before it is fed to the pulverizers, using low-grade power plant waste heat. For units with evaporative cooling towers, this process will reduce cooling tower makeup water requirements and also provide heat rate and emissions benefits. This paper describes the results of fluidized bed drying experiments carried out in a small, bench scale batch dryer with lignite and PRB coal and in a 2 ton/hour continuous pilot scale dryer with North Dakota lignite. Comparisons are made with predictions from theoretical first principal drying models, based on conservation of mass and energy. INTRODUCTION Background Low rank coals contain significant amounts of moisture, with moisture contents ranging from 15 to 30 percent for subbituminous coals and from 25 to 40 percent for lignites. High fuel moisture has several adverse impacts on the operation of a pulverized coal generating unit. It can result in fuel handling and maintenance problems, and it increases station service power, unit heat rate, emissions of pollutants, and, for those units with evaporative cooling towers, the consumption of water needed for evaporative cooling.
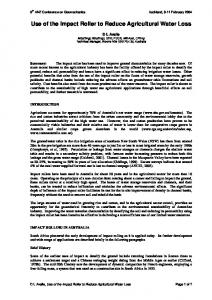
This paper describes laboratory scale and pilot plant coal drying experiments carried out at low temperatures to simulate the use of low-grade power plant waste heat for drying coal before it is fed to the pulverizers. One approach for doing this makes use of the hot circulating cooling water leaving the condenser to provide the thermal energy used for coal drying. The temperature of the circulating water leaving the condenser is usually about 49°C (120°F), and this can be used to produce an air stream at approximately 43°C (110°F). Figure 1 shows one approach, in which coal drying would be accomplished by both warm air, passing through the dryer, and a flow of hot circulating cooling water, passing through a heat exchanger located in the dryer. If other, higher temperature, waste heat sources are available at a particular power plant, these can be used to supplement the waste heat from the condenser.
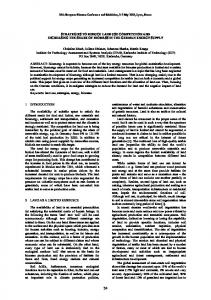
Figure 1: Schematic of Plant Layout, Showing Air Heater and Coal Dryer In an earlier paper (Ref. 1), the authors reported on a study of low temperature drying at the Coal Creek Generating Station in Underwood, North Dakota. Coal Creek has two units with total gross generation exceeding 1,100 MW. The units fire a lignite fuel containing approximately 40 percent moisture and 12 percent ash. The authors performed a theoretical analysis to estimate the impact on cooling water makeup flow of using hot circulating water to the cooling tower to heat the drying air and to estimate the magnitude of heat rate improvement that could be achieved at Coal Creek Station by removing a portion of the fuel moisture. The results show that drying the coal from 40 to 25 percent moisture will result in reductions in makeup water flow rate from 5 to 7 percent, depending on ambient conditions (Figure 2). For a 550 MW unit, the water savings are predicted to range from 1.17 × 10⁶ liters/day (0.3 × 10⁶ gallons/day) to 4.28 × 10⁶ liters/day (1.1 × 10⁶ gallons/day). The analysis also shows the heat rate and the CO2 and SO2 mass emissions will all be reduced by about 5 percent (Ref. 1).
Reduction in Cooling Tower Makeup Flow [%]
8 Spring/Fall Summer Winter
7 6 5 4 3 2 1 0 25
30
35
40
Coal Moisture Content [%]
Figure 2: The Effects of Coal Moisture on Cooling Tower Makeup Water A coal test burn was conducted at Coal Creek Unit 2 in October 2001 to determine the effect on unit operations. The lignite was dried for this test by an outdoor stockpile coal drying system. On average, the coal moisture was reduced by 6.1 percent, from 37.5 to 31.4 percent. Analysis of boiler efficiency and net unit heat rate showed that with coal drying, the improvement in boiler efficiency was approximately 2.6 percent, and the improvement in net unit heat rate was 2.7 to 2.8 percent. These results are in close agreement with theoretical predictions (Figure 3). The test data also showed the fuel flow rate was reduced by 10.8 percent and the flue gas flow rate was reduced by 4 percent. The combination of lower coal flow rate and better grindability combined to reduce mill power consumption by approximately 17 percent. Fan power was reduced by 3.8 percent due to lower air and flue gas flow rates. The average reduction in total auxiliary power was approximately 3.8 percent (Ref. 1). This Paper The experimental results on fluidized bed coal drying described in the present paper were carried out under DOE project DE-FC26-03NT41729 and under a grant from the North Dakota Industrial Commission. The paper includes bench-scale data on the effects of fluidization velocity and drying temperature on rates of drying of lignite and PRB coals. These data were obtained in a batch fluidized bed. In addition, test data on lignite drying were obtained from a 2 ton/hr pilot scale dryer with continuous feed, and sample data from this dryer are also described.
Improvement in Net Unit Heat Rate [%]
5
4
Theoretical Prediction Test Data
3
2
1
0 0
2
4
6
8
10
Reduction in Coal Moisture [%]
Figure 3: Improvement in Net Unit Heat Rate Versus Reduction in Coal Moisture Content LABORATORY SCALE BATCH BED DRYING TESTS The batch bed drying experiments were performed in the Energy Research Center’s Fluidized Bed Laboratory. The bed vessel is 152.4 mm (6”) in diameter, with a 1372 mm (54”) column and a sintered powder metal distributor plate. The air and entrained coal particles flow into a filter bag before the air is discharged from the apparatus (Figure 4). Compressed air used in the experiments flows though a rotameter and an air heater before entering the plenum. Thermocouples inserted through the bed wall are used to measure vertical distribution of bed temperature. A horizontal bundle of eighteen 12.7 mm (½”) diameter electric heating elements is used to provide in-bed heating. The heaters are located in the region from 51 mm (2”) to 304.8 mm (12”) above the distributor and are instrumented with thermocouples to indicate heater surface temperature. By controlling power to the heaters, the heater surface temperature can be operated in a range from 38°C (100°) to 65.6°C (150°F). At a given heater surface temperature, total heat flux to the bed can be reduced from the maximum by disconnecting selected heaters from the power supply. Test Procedure Batch bed drying tests were performed with specific humidity of the inlet air ranging from 0.002 to 0.008. Small samples of the coal were removed from the bed periodically during the drying tests and coal moisture was measured. The complete test procedure used in these experiments is described in Table 1.
Metal Ducting Rubber Connector/Reducer
Plexiglas Tube Filter Bag
Compressed Air
Rotameter Metal Bed
Distributor Air Heater
Plenum
Figure 4: Sketch of Experimental Bed Setup
Table 1 Procedure for Drying Tests 1. With no coal in bed, turn on compressor, set air flow to desired value, turn on air preheater and allow system to reach steady-state at desired temperature. Measure inlet relative humidity and dry bulb temperature of air. 2. Once air is at steady-state, turn off air preheater and air flow, load coal into bed, turn on all heaters and air flow to appropriate values, start stopwatch, and record pressure of inlet air from pressure gauge above rotameter. 3. Begin recording temperatures after 5 minutes, collect small samples of coal from bed, measure wet and dry bulb temperatures at exit of bed, record values for temperature readings at each assigned thermocouple, adjust voltage regulators for the heaters so that surface temperatures remain steady at appropriate values, and repeat this procedure for each time interval on data sheet. 4. At end of test, shut off heaters but keep air flow on to cool the heaters, detach filter bag, load coal samples into crucibles, place crucibles into oven, set to 100°C, and leave for 5-6 hours or overnight, remove remaining coal from the bed and weigh it. 5. Analyze results.
Results Figure 5 shows lignite moisture content Γ (kg H2O/kg dry coal) as a function of drying time for six different drying tests. The slopes of these curves indicate rate of drying. These show characteristic drying behavior, with constant rate drying (constant slope) followed by a reduced rate of drying. Note that at the beginning of each test Γ ≈ 55 to 58 percent. Γ can be related to the moisture content Y obtained from a proximate analysis, where Y has the units kg H2O/kg wet coal. Figure 6 gives the relation between Y and Γ. The coal residence time in the dryer needed to achieve a certain level of drying can also be obtained from the drying rate data. For the process conditions represented in Figure 5, the coal moisture was reduced by a factor of two within 20 to 40 minutes of drying, depending on process conditions. All of the tests reported here were performed with coal which had been crushed and sieved to produce a 6.35 mm (1/4”) top size. Settled bed depths were 0.39 m, which produced expanded bed depths in the range of 0.5 to 0.6 m at the superficial air velocities which were used. Moisture Content Versus Time 0.7 L34
Moisture Content (kg wt/kg dry coal)
0.6
L35 L36 L37
0.5
L38 L39
0.4
0.3
0.2
0.1
0 0
20
40
60
80
100
120
Time (min)
Figure 5: Moisture Content Versus Time (Lignite)
140
Relation Between Γ and y 0.40
0.35
Γ=mH20/mdc y=mH2O/(mdc+mH2O)
y (kg H2O/kg wet coal)
0.30
0.25
0.20 0.15
0.10
0.05
0.00 0
0.1
0.2
0.3
0.4
0.5
0.6
0.7
Γ (kg H2O/kg dry coal)
Figure 6: Relationship Between Γ and y Figure 7 shows lignite drying rates as a function of inlet air and tube surface temperature and superficial air velocity. Figure 8 compares lignite and PRB drying rates for comparable process conditions. Drying Rate Versus Velocity and Inlet Air Temperature Drying Rate (dΓ/dt) (kg wtr / kg dry coal*min)
0.018 0.016 2D Tube Spacing 0.014 66°C
0.012 0.010
54°C
0.008 43°C
0.006 0.004 0.002 0.000 0.8
0.9
1.0
1.1
1.2
1.3
1.4
1.5
1.6
1.7
Velocity (m/s)
Figure 7: Drying Rate Versus Velocity and Inlet Air Temperature (Lignite)
DRYING RATE VERSUS TEMPERATURE 0.018
Drying Rate (kg/(kg dry coal*min))
0.016 Lignite
0.014
PRB Coal
U0 = 1.55m/s
0.012 0.01 0.008 0.006 0.004 0.002 0 30
35
40
45
50
55
60
65
70
Temperature (°C)
Figure 8: Comparison of Drying Rates for Lignite and PRB The experiments showed the fluidized bed is well-mixed in the vertical direction and the air temperature leaving the bed is equal to the bed temperature. A first principle drying model was developed to simulate the drying process in a batch fluidized bed dryer. Based on conservation of mass and energy and a relationship between coal moisture level, temperature, and relative humidity of the air leaving the fluidized bed, the model can be used to predict drying rate, bed temperature and exit air humidity as functions of time. Figures 9 to 11 show comparisons with the data for three sets of drying conditions. PILOT SCALE DRYER Results Based on results on drying rate obtained in the laboratory batch dryer, a continuous feed pilot scale dryer was fabricated and installed at Coal Creek Station in Underwood, North Dakota. This dryer is a 27” wide by 10.5 ft long vessel, with a horizontal distributor and a horizontal in-bed tube bundle. Crushed lignite (1/4” top size) was fed to the bed at one end, flowed horizontally along the distributor and discharged at the downstream end (see Figure 12). Tests were performed at various coal feed rates and drying temperatures to determine the effects of process condition on drying. Unlike the batch laboratory dryer, this dryer operates with continuous feed of coal at steady state conditions. Figure 13 shows data for the change in coal moisture from inlet to exit as a function of air inlet temperature & air / m & DC Bed . Drying capacity increases with air inlet temperature and flow rate and and m decreases with increasing coal feed rate.
Test #52 - C oal M oisture Co ntent 0.60 0.55
From C alculation
Coal Moisture Content
0.50
From Test
0.45 0.40 0.35 0.30 Test L52 V air,in = 1.14 m /s T air,in = 110F h o = 0.25m 3D spacing 0.25 inch top size
0.25 0.20 0.15 0.10 0.05 0
10
20
30
40
50
60
Tim e(m in)
Figure 9: Coal Moisture Content Versus Time for Test 52. (Lignite) Comparison of Theory and Experiment. Test #37 - Coal M oisture Content
0.60 0.55
From Calculation
0.50
From Test
Coal Moisture Content
0.45 0.40
Test L37 V air,in = 1.56m /s T air,in = 110°F h o = 0.39m 2D spacing
0.35 0.30 0.25 0.20 0.15 0.10 0.05 0.00 0
10
20
30
40
50
60
70
80
90
100
110
Tim e (m in)
Figure 10: Coal Moisture Content Versus Time for Test 37. (Lignite) Comparison of Theory and Experiment.
120
Test #36 - Coal Moisture Content
0.60 0.55
From Calculation
0.50
From Test
Coal Moisture Content
0.45
Test L36 V air,in = 1.15m/s T air,in = 150°F h o = 0.39m 2D spacing
0.40 0.35 0.30 0.25 0.20 0.15 0.10 0.05 0.00 0
10
20
30
40
50
60
70
Time (min)
Figure 11: Coal Moisture Content Versus Time for Test 36. (Lignite) Comparison of Theory and Experiment.
Figure 12: Sketch of Pilot Dryer
0.4000
Tair_in 130 F
Decrease in Coal Moisture, Γ1-Γ Γ 2, (mass H2O/mass dry coal)
0.3500
Tair_in 148-153 F Tair_in 158-170 F
0.3000
0.2500
0.2000
0.1500
0.1000
0.0500
0.0000 0
2
4
6
8
10
12
14
16
Mair/Mdcbed
& /M & Figure 13: Γ1 - Γ2 Versus M air DC, BED and Tair 1 A theoretical drying model, similar to the one developed for the batch bed, was developed for a dryer operating at steady state conditions. Sample comparisons between test data and theoretical predictions are shown in Figures 14 and 15. These figures, which show variations of coal moisture inside the dryer, show a nearly linear variation of coal moisture with distance between the dryer inlet and exit (ξ = 0 and ξ = 1). 0.60 0.55 0.50 Measured Γ Γ1 = 0.401 Γ2 = 0.225
Coal Moisture Content
0.45 0.40 0.35 0.30 0.25 0.20 0.15 0.10 0.05 0.00 0.00
inlet specific humidity = 0.0024 kg/kg inlet air temperature = 121°F flow rate of air = 406 lbm/min flow rate of dry coal = 34.1 lbm/min initial moisture content = 0.401 no in bed heater
0.10
0.20
0.30
0.40
0.50
0.60
0.70
0.80
0.90
1.00
ξ Figure 14: Predicted Axial Variation of Coal Moisture Content for Test #4
0.70 0.65 0.60
Coal Moisture Content
0.55 Measured Γ Γ1 = 0.464 Γ2 = 0.18
0.50 0.45 0.40 0.35 0.30 0.25 0.20 0.15 0.10 0.05 0.00 0.00
inlet specific humidity = 0.0036 kg/kg inlet air temperature = 161°F flow rate of air = 402 lbm/min flow rate of coal = 31 lbm/min initial moisture content = 0.464 average heater temperature = 167°F Qtubes = 4089 Btu/min 0.10
0.20
0.30
0.40
0.50
0.60
0.70
0.80
0.90
1.00
ξ Figure 15: Predicted Axial Variation of Coal Moisture Content for Test #23 CONCLUDING REMARKS The coal drying test data obtained in these studies show that low rank coal can be dried in a fluidized bed using low grade waste heat with coal residence times which are short enough to make the drying process practical and economic for power plant use. Data obtained for a North Dakota lignite show how drying rate varies with coal and air flow rates, inlet air temperature, and amount of in-bed heat transfer. Drying data obtained for a PRB coal show slightly lower drying rates than were obtained with lignite. In a parallel effort, 75 ton/hr lignite dryers are being designed for use at Coal Creek Station. Current plans are to install and test the first full-size dryer system in Fall 2004. REFERENCE 1.
Bullinger, C., M. Ness, N. Sarunac, E. Levy, “Coal Drying Improves Performance and Reduces Emissions,” Presented at 27th International Technical Conference on Coal Utilization and Fuel Systems, Clearwater, Florida, March 4-7, 2002.
ACKNOWLEDGEMENTS “This conference paper was prepared with the support of the U.S. Department of Energy, under Award No. DE-FC26-03NT41729, and the North Dakota Industrial Committee (NDIC). However, any opinions, findings, conclusions, or recommendations expressed herein are those of the author(s) and do not necessarily reflect the views of the DOE nor the NDIC.”