DNA Research 10, 19–25 (2003)
Short Communication
Use of Gene Networks from Full Genome Microarray Libraries to Identify Functionally Relevant Drug-affected Genes and Gene Regulation Cascades Christopher J. Savoie,1,2,4 Sachiyo Aburatani,2 Shouji Watanabe,3 Yoshihiro Eguchi,3 Shigeru Muta,2 Seiya Imoto,4 Satoru Miyano,4 Satoru Kuhara,1,2 and Kosuke Tashiro1,2,∗ Gene Networks Inc., 650 S. Winchester Blvd. Suite 500, San Jose, CA 95128, USA,1 Graduate School of Bioresources and Bioenvironmental Sciences, Kyushu University, Hakozaki 6-10-1, Higashi-ku, Fukuoka 812-8581, Japan,2 Research Institute, Mitsui Knowledge Industry Co., Ltd, Harmony Tower 21st Floor, 32-2 Honcho 1-chome, Nakano-ku, Tokyo 164-8721, Japan,3 and Human Genome Center, Institute of Medical Science, University of Tokyo, 4-6-1 Shirokanedai, Minato-ku, Tokyo 108-8639, Japan4 (Received 18 January 2003)
Abstract We developed an extensive yeast gene expression library consisting of full-genome cDNA array data for over 500 yeast strains, each with a single-gene disruption. Using this data, combined with dose and time course expression experiments with the oral antifungal agent griseofulvin, whose exact molecular targets were previously unknown, we used Boolean and Bayesian network discovery techniques to determine the gene expression regulatory cascades affected directly by this drug. Using this method we identified CIK1 as an important affected target gene related to the functional phenotype induced by griseofulvin. Cellular functional analysis of griseofulvin showed similar tubulin-specific morphological effects on mitotic spindle formation to those of the drug, in agreement with the known function of CIK1p. Further, using the nonparametric, nonlinear Bayesian gene networks we were able to identify alternative ligand-dependant transcription factors and G protein homologues upstream of CIK1 that regulate CIK1 expression and might therefore serve as alternative molecular targets to induce the same molecular response as griseofulvin. Key words: drug discovery; microarray; CIK1; griseofulvin; network
Rational drug design methodologies have previously been concentrated on optimizing small molecules against a predetermined molecular target. The randomized lead to target to phenotype screening for target selection that is currently the prevailing paradigm in drug discovery has failed to offer a more efficient and accurate target selection process even with the current availability of genomic information and high throughput screening processes.1–3 The availability of genomic sequences, full genome microarrays and recent advances in gene network inference computational techniques allows for a new rational paradigm for drug target selection that takes into account global networked regulatory interactions among molecules in the genome. Disruptant-based gene expression data4,5 can be used to produce gene regulatory network models by using various computational inference techniques.6–13 Here we show how to employ the gene ∗
Communicated by Satoshi Tabata To whom correspondence should be addressed. Tel. +81-92642-3042, Fax. +81-92-642-3043, E-mail:
[email protected]
regulatory network information developed with network inference techniques10,11,13 for quickly determining the molecular networks and gene targets affected by a given compound. The same information allows for the identification of alternative tractable molecular targets upstream or downstream of a drug-affected molecule in the gene expression regulatory cascade. We have developed a gene regulatory network-driven iterative drug target discovery process. In this methodology, first large numbers of gene expression experiments are performed on single-gene disruptant cell lines (See Aburatani et al. in this issue). This information is used to create computationally inferred maps of hierarchical gene expression control. The hierarchical regulatory information is used as a basis for evaluation of drug response experiments and for generation of hypotheses of molecular action mechanisms. Information from the literature and further biological experimentation on the elucidated regulatory sub-networks is used to understand and validate results before selecting a candidate molecule for drug targeting.
11 Disruptants
[Vol. 10,
52 Disruptants
51 Disruptants
Drug-affected Genes from Microarrays
YBL036C CAD1 GCN4 25mg / T 15 THI2 50mg / T 45 50mg / T 60 25mg / T 45 10mg / T 60 25mg / T 60 100mg / T 45 10mg / T 15 50mg / T 15 10mg / T 45 50mg / T 30 100mg / T 30 100mg / T 15 10mg / T 30 100mg / T 60 25mg / T 30
20
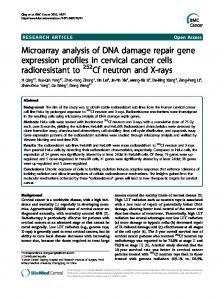
Figure 1. We performed hierarchical clustering analysis of 118 gene disruptant full genome microarray experiments and microarray data for 20 dose and time course griseofulvin exposure experiments. (Griseofulvin microarray expression values are available on the web at http://www.grt.kyushu-u.ac.jp/data/drug.htm.)
Most effective drugs in clinical use including aspirin and other popular medications have not been rationally designed to interact with a specific molecular target. Thus, even when the desired clinical effect or phenotype is achieved with these drugs, the exact underlying molecular mechanisms of action, and thus the mechanisms of the drug’s side effects, often remain unknown. Full genome gene expression experiments have been shown to be useful in determining alternative genes and pathways affected by a drug,14–16 but determination of the primary molecular targets for many drugs which affect hundreds of genes is impractical using standard gene expression analysis methods such as clustering without a priori information on potential targets for the drug. Here we demonstrate the use of hierarchical gene expression regulation networks from full genome expression libraries and gene network modeling techniques together with drug response expression experiments to determine the previously unknown underlying molecular affects of the popular generic antifungal agent, griseofulvin. Griseofulvin is a widely prescribed oral antifungal agent that is indicated primarily for severe fungal infections of the hair and nails. While griseofulvin’s molecular action is unknown, it is known that the drug disrupts mitotic spindle structure in fungi, leading to metaphase arrest. The yeast strain used in this study is BY4741. We incubated yeast cultures in concentrations of 10, 50, and 100 mg in 10 ml of DMF and took aliquots of the culture at 5 time points (0, 15, 30, 45, and 60 minutes) after the addition of griseofulvin. To monitor the gene expression profile, cells were pre-grown at 30◦ C in YPD medium (2% polypeptone, 1% yeast extract, and 2% glucose) to mid-exponential phase. We then extracted the total RNA from these experiments, labeled the RNA with cy5, hybridized them with cy3-labeled RNA from non-treated
cells and applied them to full genome cDNA microarrays. (For detailed experimental procedures see Aburatani et al. in this issue.) One hundred and eighty-three genes were affected over a 2 sigma threshold among 552 genes which differed in expression between drug-treated and normal yeast. Standard hierarchical clustering methodologies were applied to the combined expression libraries from drug response and gene disruption experiments, and the resultant genes were grouped into two major clusters: genes affected by griseofulvin and genes affected by disruption (Fig. 1). Within the griseofulvin clusters, genes were further grouped by dosage or time course. However, clustering analysis did not reveal any gene disruption expression pattern that significantly resembles any of the expression patterns created under the influence of griseofulvin. The use of gene regulatory network models, combined with the drug perturbation data allows for a hierarchical gene regulatory view of the drug’s interaction with genes in the transcriptome. To generate this gene network drug perturbation data, we first created a full genome expression library consisting of 542 single-gene disruption mutants. The 120 array matrices selected from the library were logically joined with the array matrices generated from the griseofulvin experiments. A Boolean methodology designed for gene network elucidation11,12 was then applied to the joint expression matrices for each time course. The Boolean algorithm was selected for its suitability for handling joint matrices, its ability to handle looped regulatory processes and the ease of creation of hierarchical directed graphs with several orders of regulatory separation. We produced joint Boolean regulatory sub-networks for each dosage and time point experiment (Fig. 2a). From this data, we were able to identify the first order drug affects as opposed to secondary
No. 1]
C. J. Savoie et al.
(a)
21
YEXP 100mg_T30 GDH2
IME1
FUS1
ARG3 IME2
STE4
CIK1 DDR48
ABF1 GZF3 CAT5 PCL9 IXR1
LYS12 CTF4 PPR1 CPA2
RGT1
LEU3 HOP1
RIM11
ENO2
DBF4
LEU1
ENO1
HAL9
GSC2 FAS1
CAN1
GDH1 MET6
GDH3 HXK1
SGA1 CHA1
CRS5 ADR1
MAL31 GCY1 DAL82
PHO4 STE5
TOP2
SIN3
GRE3
GRE2
RPH1
THI2
CYS3
SPS4
PHO84
SNF2
TES1
GSH1
IDH1
CCP1 SPL2
ARG5,6 PDR15
PHO5
SUR4
PHO12
HSP26 PRI2 SPL2
YRR1 HXT1 ALPHA2
PHO11 PHO8 PDR5
ADE2 ADE4
CAR2 POL2 ADE5,7 TPS1 ADE8 BAS1 CIT1 SPS1
ADE13
RME1
ADE12 ADE1
CHA1 DIT2 CIT2
SSU1 HSP78 SHM2
CTT1 DPB3
SER1 SAM2 SSA4 HHT1 HSP104 RFX1 PYC1 OLE1 PGM2
KAR2 HTB1 HTA1
FRE1 GAL7 GLK1 GCV3 GLN1 HHF1 HHF2 HAL1
Figure 2. Hierarchical map of drug-affected genes from combined Boolean analysis of drug response and disruptant expression data. a. Boolean analysis of gene expression effects due to griseofulvin exposure was used to produce hierarchical graphs of gene regulatory cascades for each drug exposure experiment. For determining drug-affected genes from disruption and drug dose expression data, the Boolean network modeling13 regards the drug as a “virtual gene” and was used for detecting the parent-child hierarchical structure of genes including the virtual gene. Shown here is the resulting gene network cascade at 100 mg and 30 min. This analysis allows for separation of direct and indirect regulatory events. For example, genes under LEU3 are under direct expression regulation by LEU3 and in turn, genes under DAL82 (which is affected by LEU3) are affected directly by DAL82 and indirectly by LEU3. b. A superimposed graph of Boolean networks generated for 5 separate time and dosage griseofulvin exposure experiments. CIK1 expression is significantly affected under exposure to griseofulvin at each dosage and time point. c. Flourescent microscopy of tubulin in unaffected wild type (A, B), griseofulvin-treated (C, D) and CIK1 disruptant yeast cells (E, F). Left photos (red) are of tubulin and right (blue) are of the nuclei of the cells. Cells exposed with or without 100 µg/ml griseofulvin for 1.5 hr were fixed with 3.7% formaldehyde and 0.25% glutaraldehyde for 30 min. Microtubles were visualized by a procedure described previously (Pringle, J. R., A. E. M. Adams, D. G. Drubin, and B. K. Haarer [1991] Immunofluorescence methods for yeast. Methods in Enzymology, 194, 565–602) using the rat anititubulin antibody (YOL 1/34, Oxford Biotechnology Ltd.) and TRIC-conjugated rabbit anti-rat IgG (Sigma). The cells were then mixed with 0.05 g/ml DAPI and p-phenylenediamine before viewing. Stained cells were examined with an inverted microscope (Olympus Co.) and the images were captured with a CCD camera.
22
Drug-affected Genes from Microarrays
(b)
YEXP 10mg_T15
YEXP 25mg_T15
YEXP 100mg_T15
[Vol. 10,
YEXP 10mg_T30
YEXP 100mg_T30
GZF3 YFL054C
LEU3
DDR48
RFX1
FUS1
THI2
CIK1
GAL10
DBF4
RNP3 CBF1 LEU2
ENO2
HOP1 ENO1
COX6 MET17
LEU1
SPR3
DAL82 PHO8 PHO5 SNF2 URA1 PHO4 PHO11 PDR5 PHO12 SIN3
Figure 2. Continued.
STE5
No. 1]
C. J. Savoie et al.
23
Table 1. Expression fold changes for 6 directly affected genes as determined by gene network analysis for 5 griseofulvin microarray experiments at various time points and concentrations.
Gene Name YFL054C
10mg_15min +10.58
Ratio of each experimental condition (YEXP) 25mg_15min 100mg_15min 10mg_30min +9.08
+7.74
100mg_30min
+5.62
+3.66
DDR48
+10.93
+6.74
+6.36
+6.49
+5.26
CIK1
+11.46
+11.17
+9.32
+7.17
+4.57
LEU3
+5.10
+4.73
+6.27
+3.61
+3.88
FUS1
+15.42
+10.22
+7.14
+6.94
+4.58
GZF3
+9.33
+10.79
+8.17
+5.11
+4.57
or higher level cascade effects initiated by those initial perturbation-induced regulatory events. By evaluating the Boolean data from each time and dose differential experiment, we were able to identify 6 genes that were consistently and significantly affected as first degree effects in the network hierarchy at each time and drug concentration (Fig. 2b). Of these genes, CIK1 exhibited the strongest change at 4 of 5 time points and concentrations and the second strongest effect at the 4th data point (Table 1). CIK1 codes for a protein described in the yeast proteome database (YPD) as a coiled-coil protein of the spindle pole body involved in spindle formation and the congression (nuclear migration) step of karyogamy.17 Since the action of griseofulvin is known to affect mitotic spindle formation, we performed a functional analysis of griseofulvin activity through examination of tubulin formation of yeast strains with a disrupted CIK1 gene to determine if the mitotic spindle formation irregularities observed involved tubulin-related genes specifically. While neither the treatment with griseofulvin at normal physiological dosage nor the disruption of CIK1 are lethal, both cultures show similar significant dysplasia of tubulin and growth characteristics compared to unaffected normal strains and normal nuclear staining showed that these changes were not attributable in either case to general affects on the nucleus through apoptotic or other unspecific nuclear dysplasia events (Fig. 2c).18,19 It is difficult to determine definitively through expression data alone whether griseofulvin actually binds to CIK1p or some alternative molecule that in turn effects CIK1 expression. In fact, in the case of griseofulvin exposure, CIK1 is significantly upregulated in expression, not suppressed as might be expected as a significant drug affect along a critical pathway regulated by a drug. It is biologically feasible that the significantly increased expression level of CIK1 may be caused by the affect of griseofulvin on other genes involved in tubulin formation or localization and that this marked upregulation of a tubulin-related gene is due to a cellular survival response to a forced inhibition of other critical tubulin formation
events or components. However, it is apparent from the multiple expression experiments and the similar morphological and physiologic effects that are seen in CIK- yeast strains and griseofulvin-affected yeast cells that the cellular phenotype caused by griseofulvin is somehow related to genes in the tubulin expression regulatory cascade in which CIK1 is involved. Further experimentation on tubulin-related expression regulation pathways is necessary to test this hypothesis. It is further unclear whether CIK1p itself would represent an ideal tractable molecular target. However, using the Bayesian models of network regulatory data available to us from our knockout expression library, we are able to search for other molecules involved in the same regulatory pathway that could serve as alternative drug targets. Using the algorithm described in Imoto et al., we created a Bayesian network model to describe the expression control relationships elucidated from the disruptant expression data.10,11 In our model, KAR3 resides upstream of CIK1 in a regulatory path. Both proteins are known to be involved in mitotic spindle formation. Furthermore, it has been reported that CIK1p and KAR3p participate in a protein-protein interaction and that the deletion of either of these genes causes spindle formation problems and results in cell growth arrest.20 Further, in these Bayesian regulatory networks there were liganddependent transcription factors and GPCR homologues upstream of CIK1 (Fig. 3a, 3b) that regulate the same gene cascades. These classes of proteins are known to be useful drug targets and together represent a majority of the targets for medications presently on the market. The methodologies described here clearly demonstrate the utility of a combined expression array and computational approach using gene network techniques to rapidly ascertain and validate the molecular mechanisms of action of a given compound on a cell. The use of such techniques will help to rationalize the target selection process of pharmaceutical development in the post-genomic era and could contribute to greater efficiency of discovery and to a reduction in development risk for the pharmaceutical industry. The same techniques can further be applied
24
Drug-affected Genes from Microarrays
[Vol. 10,
(a) HSP82
HSC82
FAR1 SNI2
MTC2 KAR2 STE5
FAS2 GLN3
GAL11 MFALPHA2
GRF10 UME6
SWI6
MBP1 PYC1
HIS1 DAL3
CRZ1
ZAP1
SNF6 DAL5
SPT4 PEX11 GZF3
QCR8
KAR3 HTA1 CIK1
(b) GPA1
AFR1
YGR043C KAR2
MET17
AXL1
YFL052W YLR228C
STE2
STE4
STE5 STE6 STE12 YEL009C FAR1
GAL80
PHO8
RME1
PHO84 YGR067C
DAL2
HTA2
BAR1
ZAP1
YDL182W
ZIP1
CIK1
Figure 3. Potentially tractable drug target molecules upstream of CIK1 in Bayesian gene regulatory subnetworks. a. Gene regulatory subnetworks upstream of CIK1 containing ligand dependent transcription factors. KAR3 and GZF3 both have been reported to be involved in a similar cellular function to CIK1 related to tubulin formation and structure. b. Gene networks upstream of CIK1 with G protein homologue molecules.
to other biological discovery and agrochemical targeting. Our laboratories are currently replicating this discovery model in human and other biological systems. Acknowledgements: We thank Dr. Osamu Higuchi for providing the cDNAs for microarray production. This work is supported in part by JSPS research for the future program, the Genome Frontier Project, and a Grant-in-Aid for Scientific Research on Priority Areas and Genomefrontier from the MEXT. The authors contributed equally to this work. References 1. Smith, A. 2002, Screening for drug discovery: The leading question, Nature, 418, 453–459. 2. Aherne, G. W., McDonald, E., and Workman, P. 2002,
3.
4.
5.
6.
Finding the needle in the haystack: why high-throughput screening is good for your health, Breast Cancer Res., 4, 148–154. Willins, D. A., Kessler, M., Walker, S. S., Reyes, G. R., and Cottarel, G. 2002, Genomics strategies for antifungal drug discovery — from gene discovery to compound screening, Curr. Pharm. Des., 8, 1137–1154. Hughes, T. R., Marton, M. J., Jones, A. R. et al. 2000, Functional Discovery via a Compendium of Expression Profiles, Cell, 102, 109–126. Giaever, G., Chu, A. M., Ni, L. et al. 2002, Functional profiling of the Saccharomyces cerevisiae genome, Nature, 418, 387–391. Akutsu, T., Miyano, S., and Kuhara, S. 1999, Identification of genetic networks from a small number of gene expression patterns under the Boolean network model, Proc. Pacific Symposium on Biocomputing, 4, 17–28.
No. 1]
C. J. Savoie et al.
7. Akutsu, T., Miyano, S., and Kuhara, S. 2000, Inferring qualitative relations in genetic networks and metabolic pathways, Bioinformatics, 16, 727–734. 8. Chen, T., He, H. L., and Church, G. M. 1999, Modeling gene expression with differential equations, Proc. Pac. Symposium on Biocomputing, 4, 29–40. 9. Friedman, N., Linial, M., Nachman, I., and Pe’er, D. 2000, Using Bayesian networks to analyze expression data, J. Comp. Biol., 7, 601–620. 10. Imoto, S., Goto, T., and Miyano, S. 2002, Estimation of genetic networks and functional structures between genes by using Bayesian networks and nonparametric regression, Proc. Pacific Symposium on Biocomputing, 7, 175–186. 11. Imoto, S., Kim, S., Goto, T. et al. 2002, Bayesian network and nonparametric heteroscedastic regression for nonlinear modeling of genetic network, Proc. IEEE Computer Society Bioinformatics Conference, Computer Society Press, 219–227. 12. Liang, S., Fuhrman, S., and Somogyi, R. 1998, REVEAL, a general reverse engineering algorithm for inference of genetic network architectures, Proc. Pacific Symposium on Biocomputing, 3, 18–29. 13. Maki, Y., Tominaga, D., Okamoto, M., Watanabe, S., and Eguchi, Y. 2001, Development of a system for the inference of large scale genetic networks, Proc. Pacific
25
Symposium on Biocomputing, 6, 446–458. 14. Marton, M. J., DeRisi, J. L., Bennett, H. A. et al. 1998, Drug target validation and identification of secondary drug target effects using DNA microarrays, Nature Medicine, 4, 1293–1301. 15. Heller, M. J. 2002, DNA MICROARRAY TECHNOLOGY: Devices, Systems, and Applications, Annu. Rev. Biomed Eng., 4, 129–153. 16. Reynolds, M. A. 2002, Microarray technology GEM microarrays and drug discovery, J. Ind. Microbiol. Biotechnol., 28, 180–185. 17. Rose, M. D. 1996, Nuclear fusion in the yeast Saccharomyces cerevisiae, Ann. Rev. Cell. Dev. Biol., 12, 663–695. 18. Manning, D. B., Barrett, J. G., Wallace, J. A., Granok, H., and Snyder, M. 1999, Differential Regulation of the Kar3p Kinesin-ralated Protein by Two Associated Proteins, Cik1p and Vik1p, J. Cell. Biol., 144, 1219–1233. 19. Page, B. D. and Anyder, M. 1992, CIK1: A developmentally regulated spindle pole body-associated protein important for microtubles functions in Saccharomyces cerevisiae, Genes Dev., 6, 1414–1429. 20. Shanks, R. M., Kamieniecki, R. J., and Dawson, D. S. 2001, The Kar3-interacting protein Cik1p plays a critical role in passage through meiosis I in Saccharomyces cerevisiae, Genetics, 159, 939–951.