USE OF GEOSPATIAL TECHNOLOGIES AND NUMERICAL MODELING TO MONITOR AND FORECAST FLOODING ALONG MARIKINA RIVER, PHILIPPINES Jojene R. Santillan a, *, Roseanne V. Ramos a, Sabrina Recamadas a, Girlie David a, Enrico C. Paringit a, Nena Carina Española b, John Robert T. Mendoza b, & Jen Alconisc a
Applied Geodesy and Space Technology Research Laboratory, Training Center for Applied Geodesy and Photogrammetry, College of Engineering, University of the Philippines, Diliman, Quezon City, PHILIPPINES 1101 (
[email protected]) b
Grid Operations Team, Advance Science and Technology Institute, Department of Science and Technology, C.P. Garcia Avenue, Technology Park Complex, UP Campus, Diliman, Quezon City, PHILIPPINES 1101 c
National Institute of Geological Sciences, University of the Philippines, Diliman, Quezon City, PHILIPPINES 1101
KEY WORDS: Remote Sensing, GIS, Numerical Modeling, Flood Monitoring, Flood Forecasting, Marikina River, Philippines ABSTRACT: In this paper, we present how geospatial technologies and techniques (hydrographic surveys, Remote Sensing - RS, Geographic Information System - GIS) together with numerical models can be used in near-real time monitoring and forecasting of floods. We chose Marikina River that traverses the province of Rizal and the Metropolitan Manila in Luzon Island, Philippines as our study area. We developed and parameterized a near-real time flood extent monitoring numerical model for Marikina River, Philippines using the Hydrologic Engineering Center – River Analysis System (HEC RAS) program. Model development and parameterization was done using GIS. Hydrographic surveys were conducted to generate the geometry of the Marikina River required by HEC RAS. Flood plain surface roughness coefficients needed to parameterize the model were derived from multispectral classification of a 10-m spatial resolution ALOS AVNIR-2 satellite image of the study area. Automation scripts were developed for running the HEC RAS modelling workflow without human intervention such as assigning of model initial and boundary conditions, setting of simulation time window, model computation and generation of flood extent and flood depths. The outputs generated are then uploaded automatically to the Project NOAH (Nationwide Operational Assessment of Hazards, http://noah.dost.gov.ph) website where the public could view in near real-time if there is flooding along Marikina River. This near-real time generation of flood maps can be useful in providing information to the public as to the possible extent of flooding in the Marikina River that could then assist in preparation for evacuation. We also developed a forecasting system for Marikina River that provides water level forecasts for the next 48 hours. Forecasts are results of model simulation of basin hydrology as well as river and flood plain hydraulics, using recorded data of rainfall events 3 days ago to present time as primary input of the models. The forecast model is based on the Hydrologic Engineering Center – Hydrologic Modeling System (HEC HMS). This model was also developed and parameterized using GIS, wherein river and floodplain geometry from field surveys and digital elevation model (DEM) as well as land-cover information from the ALOS AVNIR-2 satellite image were used as primary inputs. The water level forecasts can be viewed online at http://map.upd.edu.ph/mrflood/index.html.
Ondoy) caused overflowing of the river that resulted to exceptionally high and extensive flooding in areas surrounding the river. TS Ketsana dumped a month’s worth of rain in less than 24 hours and caused flooding in Metro Manila, killing at least 300 people and displacing another 700,000 (Cheng, 2009). The second was in August 2012 when an eight-day period of torrential rain and thunderstorms brought about by the strong movement of the Southwest Monsoon caused the Marikina River to overflow and brought damages to places near the banks of the river. The intense, nonstop rains that occurred from August 1 to August 8, 2012 have been informally known as Habagat. The event caused the heaviest damage in Metropolitan Manila since TS Ketsana (Heistermann et al., 2013).
1. INTRODUCTION Marikina River (Figure 1a), with an approximate length of 31 km, drains the 582 km2 Marikina River Basin (MRB) towards the Pasig River (Abon et al., 2011). The river traverses a highly urbanized floodplain wherein the portions of Rizal Province, Quezon City, Marikina City and Pasig City are situated. As the flood plain is host to densely populated areas as well as commercial and industrial zones, flooding due to overflowing of the river will result to significant damage to human lives and properties. The need for an accurate and reliable flood monitoring and water level forecasting tools for the Marikina River has been exemplified in two occasions. The first was in September 2009 when Tropical Storm (TS) Ketsana (Local Name:
* Corresponding author. 1
Proceedings of the 12th SEASC: Geospatial Cooperation Towards a Sustainable Future 18-20 June 2013, Manila, Philippines
(b.)
(a)
EFCOS MONTALBAN
TUMANA (VAL. STATION)
EFCOS STO. NINO
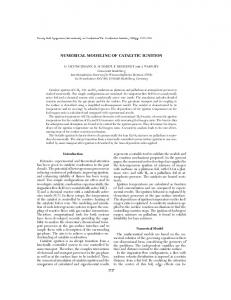
Figure 1. (a.) Map showing the location of the Marikina River Basin (MRB). Also shown are the locations of the rainfall stations. (b.) A close-up view of the Marikina River. Shown are the flood model domain, and the location of EFCOS Water Level Monitoring Stations.
Several water level and rainfall monitoring stations are in place within and near the MRB and along the Marikina River that can provide up-to-date status of water levels at selected sections of the main river, and of rainfall depth at different locations. While these monitoring stations are helpful, what remains to be lacking is a system that can provide two levels of information: (1) near-real time information on the status of water levels all throughout the river, especially if one wanted to know the current extent of flooding along the river and the areas that are presently flooded, and (2) forecasts on how water level will rise (or recede) at different locations along the river as rainfall events occur in the MRB. Providing this kind of information is useful in informing the public as to the current extent and depth of flooding in the Marikina River that could then assist in preparation for evacuation. This will also aid in estimating the severity of damage as flooding progresses. In this paper, we present how geospatial technologies and techniques consisting of hydrographic surveys, Remote Sensing (RS), Geographic Information System (GIS) together with numerical modelling, can help in near-real time monitoring of floods and forecasting of water levels in Marikina River. 2. METHODS 2.1 Development of the Marikina River Near-Real Time Flood Extent Monitoring System Model Domain The flood extent monitoring system was developed for the section of the Marikina River starting from San Jose Bridge, Montalban, Rizal province in the upstream, and at Rosario junction in Pasig City at the downstream (Figure 1b). The length covered is approximately 21.12 km. Water level (WL) monitoring stations of the Enhanced Flood Control
EFCOS ROSARIO JS
and Operation Warning System (EFCOS) namely Station MONTALBAN and Station ROSARIO JS have been installed at these two locations. At about 6.7 km from the downstream is another EFCOS WL Station named STO. NIÑO. The WL stations are integral to the development of the flood extent monitoring system as they are the main source of WL information for the flood model simulation. A buffer of 1 km from the river centerline at both banks of the river was set as the flood model domain. Model Setup The development of the Marikina River Flood Extent Monitoring System consisted of three major steps: flood model setup, flood model automation, and online visualization. The Hydrologic Engineering Center – River Analysis System (HEC RAS) (Brunner 2010a) was used in developing the Marikina River Flood Model. HEC RAS requires a geometric representation of the river systems in terms of cross-sections, centerline and river banks. The model geometry was prepared using Arcview GIS. River centerlines and banks were digitized from a 1-m resolution digital elevation model derived using Light Detection and Ranging (LiDAR) technology. As the river bed in the DEM is poorly represented, it was supplemented with bed topography derived from bathymetry surveys using a HiTarget single beam echosounder coupled with a dualfrequency Topcon Hiper GA Global Positioning System (GPS). The bed surface elevation points derived from the echosounder and GPS surveys are then interpolated using kriging technique to produce a continuous surface of the river bed topography at 1-m resolution. This surface was then integrated to the LiDAR DEM. To complete the geometric data requirements of HEC RAS, a total 241 crosssections were extracted from the updated DEM. Each crosssection is approximately 2 km in length. All the geometric data processing was done using the HEC GeoRAS extension in Arcview GIS 3.2. As river flow computation in HEC RAS is
J.R. Santillan et al.
based on Manning’s equation, it is required that surface roughness coefficients be assigned to the channel crosssections (Brunner 2010b). For this model parameter, a rectified ALOS AVNIR 2 satellite image acquired on February 2, 2010 with 10-m spatial resolution was analyzed through a two-stage process: using Maximum Likelihood classification to generate a general land-cover map, and Kmeans clustering to differentiate dense vegetation classes into high, medium and low density shrubs and trees. The resulting land-cover map, with an overall accuracy of 92.3%, was converted to a surface roughness map by using a look-up table of Manning’s roughness coefficients for each class in the land-cover map. Details of the satellite image analysis and surface roughness map generation are reported in Santillan, et al. (2012a) and in Santillan, et al. (2012b). The surface roughness map was used to assign Manning’s n values to the cross-sections of the HEC RAS model. After this, the HEC RAS model was configured in a Hewlett Packard Z800 workstation. The configuration consisted of setting the HEC RAS model to accept water level data from the EFCOS WL monitoring stations MONTALBAN, STO NINO, and ROSARIO in near-real time. The WL data served as the model’s boundary conditions. By using WL data from the EFCOS Stations, HEC RAS will compute using its unsteady flow module the water profiles throughout the model domain in such a way that water level at the boundary condition points (i.e., the EFCOS stations) corresponds to the actual WL as recorded.
Forecast Model Setup A river basin approach was utilized in water level forecasting along Marikina River. This is due to the fact that water flowing along Marikina River comes from upstream watersheds that are within the MRB. When rainfall events occur in the MRB, runoff is routed from several watersheds until it reaches the Marikina River. Hence, it is important to compute runoff in all of these watersheds in order to forecast water level in the Marikina River. The forecast model is based on the Hydrologic Engineering Center – Hydrologic Modeling System (HEC HMS). The model domain is the whole of the MRB (see Figure 1a). The HEC HMS model have four components in order to properly simulate the basic hydrologic processes of runoff generation from rainfall, its transformation, and routing towards the outlet (which is the ROSARIO JS Station). These four components are (1) an infiltration loss model (based on the Soil Conservation Service-Curve Number (SCS-CN) approach), (2) a direct runoff model (Clark Unit Hydrograph), (3) a baseflow model (Exponential Recession), and (4) channel routing model (MuskingumCunge). The model was developed and parameterized using HECGeoHMS extension in ArcView GIS 3.2. River and floodplain geometry from field surveys and a 10-m resolution digital elevation model (derived from contours digitized from 1:10,000 topographic maps) were utilized to subdivide the MRB into several watersheds. Land-cover information from the ALOS AVNIR-2 satellite image and a soil texture map were used to estimate the Curve Number (an indication of how much runoff is generated during a rainfall event) in each watershed. Other model parameters were estimated through calibration with discharge data measured at MONTALBAN, STO. NINO and ROSARIO JS stations.
Model Automation and Online Visualization The series of steps to generate and publish flood extent maps of Marikina River in near-real time at 10-minute intervals, can be grouped into three: (i.) download of latest WL data at the boundary condition points and entering this data into the HEC RAS model, (ii.) update the model’s initial condition using the output of the previous model run, running the model for the current time to compute for water levels throughout the length of the river, and producing a flood extent shapefile within HEC RAS, and (iii.) converting and publishing the flood extent shapefile as KML/KMZ in the Project NOAH website. Project NOAH stands for Nationwide Operational Assessment of Hazards. The series of steps were automated using the GNU wget (www.gnu.org/software/wget/) to download the WL files from the Predict server (http://repo.pscigrid.gov.ph/predict); AutoIt (www.autoitscript.com) to run the HEC RAS model and generate flood extent shapefile; and python (www.python.org) to convert the shapefile to KML/KMZ and upload to the Project NOAH website. All the scripts were implemented in sequence and repeats every 10 minutes using Windows Task Scheduler. The generated flood extent map can be viewed by opening http://noah.dost.gov.ph/ and selecting Flood Maps Flood Inundation Monitoring Marikina River.
How water levels are forecasted Before generating the water level forecasts, the HEC HMS first compute the runoff at each watershed by incorporating in the computation the rainfall depth recorded by rainfall stations within and near the MRB through an inverse distance approach (see Figure 1a for the location of the rainfall stations). The computation time frame is 3 days before to 2 days after the current time (i.e., the forecast starting time). The aim of the computation is to estimate the volume of water (cubic meters/second; “outflow”) flowing through MONTALBAN and STO. NINO and coming out of the MRB (through ROSARIO JS) due to rainfall events that have occurred 3 days ago to current time. The assumption here is that rainfall events in the MRB 3 days before to current time will have an effect on the volume and level of water along the Marikina River 48 hours after the current time (i.e., the forecast period). The outflows computed by HEC HMS at MONTALBAN, STO. NINO and ROSARIO are then transformed into water level/stage (with datum equivalent to the datum of the EFCOS Water Level Monitoring Stations) through the use of rating curve equations (equations which relates outflow with water level). The rating curves are incorporated within HEC HMS so that part of HEC HMS’s output are water levels in addition to outflows. The water level datum is approximately 10 m higher than the Mean Sea Level. In
2.2 Development of the Marikina River Water Level Forecasting System The Marikina River Water Level Forecasting System was also developed to provide forecasts on the effect of recent rainfall events on the level of water along Marikina River. The development of the system consisted of model setup, automation and online visualization. 3
Proceedings of the 12th SEASC: Geospatial Cooperation Towards a Sustainable Future 18-20 June 2013, Manila, Philippines
some instances (such as model calibration and validation), the Mean Sea Level was used as the datum. For forecasting purposes, the monitoring station’s datum was used for consistency with the water level plots displayed in Project NOAH. Forecast Automation and Online Visualization A combination of wget, python, jython and HEC HMS scripts were created to automate the water level forecasting process and uploading the forecasts into the World Wide Web. The automation includes downloading rainfall data from the Predict server, feeding this data into HEC HMS, running HEC HMS to provide water level forecasts, plotting the forecasts, and uploading them into a server. Automated forecasting is done every 10 minutes. This means that forecasts of water level for the next 48 hours are updated every 10 minutes. The forecasts at MONTALBAN, STO. NINO and ROSARIO JS can be viewed online at http://www.map.upd.edu.ph/mrflood/index.html and at http://mrbforecast.wordpress.com. The same workstation (Hewlett Packard Z800) was used for the water level forecasting system.
3. RESULTS AND DISCUSSION 3.1 The Marikina River Flood Extent Monitoring System Figure 2 shows the hardware setup and interface of the Marikina flood extent monitoring system. The hardware is presently located at the Research Laboratory for Applied Geodesy and Space Technology, Training Center for Applied Geodesy and Photogrammetry & Department of Geodetic Engineering, University of the Philippines, Diliman. The system has been active since June 2012 and has continuously provided near real time flood extent maps up to the present through Project NOAH. Essentially, it is a system that can provide near-real time information on whether there is overflowing of water along the river (which can be identified by lateral expansion of the outline of the water surface). In fact, the system became valuable during the Habagat Event last August 2012. The system provided the public flood extent maps every 10 minutes and showed how flooding expanded from the banks of the Marikina River towards many populated areas. It also showed how flooding has receded after the event. With regards to the accuracy of the HEC RAS model, it was determined in a separate study (Santillan et al., 2010a; Santillan et al., 2010b) that the model has Nash-Sutcliffe
Figure 2. Right: The hardware setup of the Marikina River Flood Extent Monitoring System. Above: A screen shot of the interface of the system. The nearreal time flood extent map (updated every 10 minutes) is available at the Project NOAH website, http://noah.dost.gov.ph.
J.R. Santillan et al.
Figure 3. The online interface of the Marikina River Water Level Forecasting System that can be accessed through http://map.upd.edu.ph/mrflood/index.html. An example forecast is shown for MONTALBAN. Model Efficiency of 0.88, which indicates satisfactory performance when predicting water levels. This model performance metric was computed through comparison between the simulated water level by the HEC RAS model and actual water level at Tumana Station measured on June 15-21, 2012. The average error of -0.16 m indicates that the simulated water level is approx. 16 cm higher than the actual level (error = actual – simulated WL). The model’s ability to predict the extent of flooding was also verified by comparing the simulated flood extent with the actual flood extent detected from a Radarsat 2 satellite image of the 2012 Habagat flood event. The comparison of the predictedversus-actual flood extent showed an 84.42% predicted flood extent accuracy. This means that 84.42% of all areas along Marikina River that have been predicted by the model as “flooded” were actually flooded during the Habagat event. Details of this are discussed in Santillan et al. (2013). 3.2 The Marikina River Water Level Forecasting System Figure 3 shows the online interface of the forecasting system. The system shown online is called as Marikina ReLieF (RivEr Level Forecasting). When accessed, the user has the option to view forecast graphs only or view the graphs by clicking the forecast location markers overlaid in Google Map. An example forecast graph for MONTALBAN is also shown in Figure 3. The forecast system can be a useful as an early warning and decision-support tool during heavy rainfall events as it could provide indication if the rainfall events will cause water levels to rise above alert/alarm/critical levels in the next 48 hours.
Figure 4. Graphs of the water levels in MONTALBAN and STO. NINO as simulated by the HEC HMS-based forecast model during the 2012 Habagat flooding event compared with actual/observed water levels. Note that the datum in the graphs is Mean Sea Level which is 10 m lower than the datum of the water level monitoring stations.
As for the accuracy of the forecasting model, the calibrated HEC HMS model was used to re-simulate the Habagat 2012 flooding event. Water level data measured at MONTALBAN and STO. NINO during the event was then compared with 5
Proceedings of the 12th SEASC: Geospatial Cooperation Towards a Sustainable Future 18-20 June 2013, Manila, Philippines
the water level simulated by the model. The comparisons are shown in Figure 4. The forecast model has a NashSutcliffe Model Efficiency of 0.70 and average water level error of -0.10 m for MONTALBAN. For STO. NINO, the model efficiency is 0.41 and average water level error of -0.80 m. Although both values of model efficiency suggest acceptable model performance, the negative water level errors indicates that the model tends to overestimate water level, especially in STO. NINO station. 4. CONCLUSIONS In this paper, we have presented the development of two systems to monitor flooding and forecast water levels along Marikina River using geospatial technologies and numerical modelling. The Marikina Flood Extent Monitoring System provides near-real time information on the status of flooding all throughout the river. The system is useful especially if one wanted to know the current extent of flooding along the river and the areas that are presently flooded. The near-real time generation of flood maps could be useful in providing information to the public as to the possible extent of flooding in the Marikina River that could then assist in preparation for evacuation. On the other hand, the Marikina Water Level Forecasting System provides water level forecasts for the next 48 hours which is useful as an early warning and decision-support tool especially during heavy rainfall events. Both systems made use of GIS and data from hydrographic surveys and satellite images in model preparation and parameterizations. Online web mapping technology was used as well as in providing near-real time outputs for viewing by the public through the World Wide Web. This is made possible through Project NOAH (for the near-real time flood extent monitoring system) and Google Maps (for the water level forecasting system). ACKNOWLEDGEMENTS We thank the following agencies: the Philippine’s National Mapping and Resource Information Authority for providing the ALOS AVNIR2 satellite image; the Collective Strengthening of Community Awareness for Natural Disasters (CSCAND) agencies for allowing us to use the Marikina River 1-m LiDAR digital elevation dataset; and Project NOAH, ASTI-DOST’s Predict Server and MMDA‘s Enhanced Flood Control and Operation Warning System (EFCOS) for the real-time rainfall and water level data. This paper is one of the outputs of “Project 3. Modeling of Flashflood Events using Integrated GIS and Hydrological Simulations” under the “Surveys and Measurement Technologies for Flood Control, Mitigation and Management System” program funded by the Philippine Council for Industry, Energy and Emerging Technology Research and Development of the Department of Science and Technology (PCIEERD-DOST). We also acknowledge the support of Engr. Joemarie Caballero, Engr. Jessie Linn P. Ablao and Engr. Edgardo Macatulad during the field surveys.
REFERENCES Abon, C.C., David, C.P.C., and Pellejera, N.E.B. Reconstructing the Tropical Storm Ketsana flood event in Marikina River, Philippines. Hydrology & Earth System Sciences, Vol. 15 (2011), pp. 1283–1289. Brunner, G.W. HEC RAS River Analysis System Hydraulic Reference Manual. US Corps of Engineers, Institute of Water Resources, Hydrologic Engineering Center, Davis, California, 2010a. Brunner, G.W. HEC RAS River Analysis System User Manual, version 4.1, US Corps of Engineers, Institute of Water Resources, Hydrologic Engineering Center, Davis, California, 2010b. Cheng, M.H. Natural disasters highlight gaps in preparedness. The Lancet, Vol. 274 (2009), pp. 1317-1318. Heistermann, M., Crisologo, I., Abon, C. C., Racoma, B. A., Jacobi, S., Servando, N. T., David, C.P.C., and Bronstert, A. Using the new Philippine radar network to reconstruct the Habagat of August 2012 monsoon event around Metropolitan Manila. Nat. Hazards Earth Syst. Sci., Vol. 13 (2013), pp. 653-657. Santillan, J., Paringit, E., Ramos, R., Mendoza, R., Espanola, N., Alconis, J. Near real-time flood extent monitoring in Marikina River, Philippines: Model parameterization using remotely-sensed data and field measurements. Proceedings of the 33rd Asian Conference on Remote Sensing, ACRS 2012 – Aiming Smart Space Sensing, Ambassador City Jomtien Hotel, Pattaya, Thailand, 2012a. Santillan, J., Paringit, E., Ramos, R., Mendoza, R., Espanola, N., Alconis, J., 2012. Development of a HEC RAS Model for NearReal Time Flood Monitoring in Marikina River, Philippines. Proceedings of the 1st Philippine Geomatics Symposium – PhilGEOS 2012, Melchor Hall, College of Engineering, University of the Philippines, Diliman, Quezon City, 2012b. Santillan, J., Ramos, R.V., Recamadas, S., David, G. Reconstruction of the August 2012 Habagat Flooding in Marikina River: Flood Model Parameterization and Accuracy Assessment Based on Optical and SAR Image Analyses. Proceedings of the 3rd National Remote Sensing Conference – NRSC 2013, University of the Philippines, Diliman, Quezon City, 2013.


![[PDF] Download Introduction to Geospatial Technologies Books](https://m.moam.info/img/260x300/pdf-download-introduction-to-geospatial-technologi_64780691097c4744708c5e1c.jpg)
![[PDF] Download Introduction to Geospatial Technologies Epub](https://m.moam.info/img/260x300/pdf-download-introduction-to-geospatial-technologi_64777e5a097c474e708bc38e.jpg)