This investment is a pro active approach to ... is very difficult to monitor these servers round the clock ... series (Window Based) p âseries ( AIX based ) rack.
Anshul Kaushik / (IJCSE) International Journal on Computer Science and Engineering Vol. 02, No. 07, 2010, 2246-2252
USE OF OPEN SOURCE TECHNOLOGIES FOR ENTERPRISE SERVER MONITORING USING SNMP ANSHUL KAUSHIK Corporate Strategic Information Systems Division, Honda Motors India Pvt Ltd., Gretarer Noida, U.P, India http://hondacarindia.com
Abstract This paper focuses on the evolving trend of Data Center Monitoring in enterprise using SNMP protocol & open source platforms for proactive server monitoring and data center management. It also focuses on the need of data center monitoring and escalations for pro active approach.
Keywords: Open Source Monitoring , Data Center Monitoring , ITIL Process , Downtime Tracking , Performance Server Review , incident reporting , SNMP Protocol , Nagios , Hyperic HQ , Open NMS , Zabbix , Zenoss , Ground Works. 1. Introduction & Background “The only constant thing in this world is change” and it implies very well to the science & technology domain. Green IT, Virtualization , Storage consolidation , Cloud computing , Green Data center are among some of the hot buzz words today. With increase and expansion of business and growing economy , name of IT departments changed from mere EDP (Electronic Data Processing) to SIS (Strategic Information Systems). In today’s business scenario IT systems provides framework for running any kind of business as a support function. These systems are placed in state of an art data center with specialized controlled environment like cooling ,humidity control , fire control , pest control etc. Industries are spending and investing a major capital for monitoring their servers , applications and network equipments . This investment is a pro active approach to know about the problems before any incident and also helps in incident handling at different layers inside data center. It is very difficult to monitor these servers round the clock manually. In this paper we will evaluate performance of different open-source options available for monitoring enterprise level data center operations using SNMP protocols.
2. Definitions & Abbreviations This paper covers the scope of monitoring various servers with SNMP protocol by using open source solutions available , Monitoring is performed on the IBM range of x series (Window Based) p –series ( AIX based ) rack mounted , blade servers. Applications and Database monitoring platform includes IBM WebSphere , DB2 , HTTP Apache , Microsoft IIS Oracle 8i servers. “SIS” refers to strategic information systems. Monitoring can be performed either by querying normal status of the application as up or down which does not require any special agents to be installed like in case of ICMP ping response. This kind of monitoring can be referred to as “agent less monitoring”. Or it can be done with help of special installed tool agents which interact with the services of OS and applications and is also capable of sending vitals and other system info to the monitoring server, this kind of monitoring tool using some specialized developed agents is referred to as “agent based tools”.
3. Technology Behind Monitoring SNMP Protocol System Network Management Protocol is used for monitoring network devices and other data center equipments. It is part of the TCP/IP protocol suite. In a data center environment each server with an installed agent communicates with SNMP to broadcast the status of a device on which agent is installed. The manager (Monitoring Server) collects the data from various nodes. The SNMP network consist of three key elements 1) Devices - On which Agent is installed 2) Agents - Installed on Devices 3) Monitoring Server – Software which receives captured data from agents Data can be gathered in several ways it can use GetRequest, SetRequest, GetNextRequest, Response,Trap etc.. Means that monitoring system can request a value from the server
ISSN : 0975-3397
2246
Anshul Kaushik / (IJCSE) International Journal on Computer Science and Engineering Vol. 02, No. 07, 2010, 2246-2252 “get” or it can set “trap” or a threshold of value by defining a trigger point. SNMP works on the layer 7 of OSI model (Application Layer) and uses UDP port 161 for communication reason being it does not need any acknowledgement and being used for monitoring purpose only. Basic structure of the SNMP data PDU consists of a IP & UDP header followed by a version , community type , equest id ,error status , error index , variable bindings. There are mainly 3 versions of SNMP protocol. Version 1 [ RFC 1065 , 1066 , 1067 , 1156 ] had problems in security and authentication which were taken care in Version 2 [RFC 1213] of the protocol . Version 1 & 2 are not interpretable in message formats and protocol operations. Remote Configuration Enhancements were added in Version 3 [RFC 3411 , 3418] of the protocol.
Reactive Approach is the only option available for system administrators after information passed about the system by end users. There is no mechanism for directly interacting with server vitals. Industry is moving towards Pro Active approach where there is a layer between system administrator and datacenter that provides pro active measures to system administrators to act precisely and pass on information to upper management with help of reports.. With help of SNMP we can able to track all performance related info in database for MIS reporting and can link with KPI (Key Performance Index). Let us assume that we have 64 servers in our data center with performance check sheet to fill daily for each server and the listed parameters are 10 in nos. then our system administration will be filling up 640 parameters daily for the complete data center. Which is a repetitive task and is actually a man power wastage considering the fact that for 64 servers a system admin will take approx 10 minutes on each server he will be wasting 640 minutes approx 10 hours on this activity.
Fig : Basic diagram for SNMP based architecture network management station is the monitoring server.
4. Why Monitoring Automated ? RCA On QCDM Parameters Every business is growing in terms of systems, applications, hardware, number of servers and each equipment has number parameters to check. It is very difficult to track data center precisely.
Fig : Number of Applications on 64 Servers each with 10 core parameters to check comes to 640 daily check.
Considering the normal 24X7X356 operations , do we really know that what our servers are doing ? or how they are behaving ? Do they have all vitals at place like temperature , RAM threshold , CPU utilization , threads per CPU , Database services , Application cluster running properly ? or There is some deviation from the normal track?.
Lets consider a case study of a business entity. The problems which are being faced in business because of unavailability of a monitoring tool on basis of widely accepted QDMS parameters will reveals that most of the problems being faced are due to lack of pro active approach and information to system administrators about data center. So a precise QDMS reveals the following observations.
We cant afford to be slow in business as all the transactions are being performed using ERP systems and other applications hosted in datacenter. For instance consider a situation when ERP server stops working and system administrator came to know about it after a while. This kind of situation almost happens in corporate IT world. ISSN : 0975-3397
2247
Anshul Kaushik / (IJCSE) International Journal on Computer Science and Engineering Vol. 02, No. 07, 2010, 2246-2252 with .bin file extension. Initially installing Ground works was very complex task. There is not enough documentation available on the website. The last version was updated in 2009 December which is quite old. There was a very old version virtual appliance available on internet.
Fig : RCA Problem Analysis on basis of QCDM parameters
The outcome of this analysis suggests that there should be an automated system for monitoring resources inside data center. Which is our core requirement. Core problems being identified by the Analysis : Non Availability of Automated System for Monitoring Data Center Events and Downtime Manual & long process of data collection in check sheets It is difficult to track data center 24X7 In nutshell System should provide information based on mainly three parameters i) Time ii) System State iii) Particular Service like apache , oracle third party application services. 5. Solution : Open Source Many Options All Monitoring tools runs on the SNMP , Some of the commercial products includes IBM Noc-I , Tivoli , HP Open View , Microsoft SCCM, BMC Patrol , CA Unicenter. Open source market includes many options like Nagios , Ground Works , Zenoss , Zabbix , Hyperic HQ. Need for the monitoring depends on the type of business being carried out by the organization. There has been always debate on commercial vs open source solutions for enterprise on grounds of support and security but many companies are acquiring open source projects by launching different version of projects for both commercial and open source markets. Testing has been performed on various parameters based deployment, reporting, notifications , triggers, alerts, resource usage. 5.1. Ground works
After the source code compilation it was easy to execute the installation process it was far better then the previous encounter which I had in 2008 where installer asks to you to locate the java environmental variables. Overall configuration and installation was very complex and needs lot of efforts to run. Now there are other version available at the ground works website which is 6.2 and claims as an enterprise edition of the product which has some additional features and integration component with other third party application plugins. It bundles with more then 35 tools and can integrate with most of the monitoring products like nagios for example. In nutshell very less documentation , difficult to configure although can be integrated with nagios. 5.2. Zabbix Zabbix was developed by Alexei Vladishev , and first released in 2001. Current stable version of Zabbix is 1.8.3. It can monitor the basic SMTP , HTTP, ICMP services without installation of agents. Zabbix has three core components for its functioning i) Daemons ii) Agents iii) Web interface. It is capable of using many flavor of commercial or open soure databases like My SQL , SQLite , Oracle. The latest version is capable of working with the IPV6 version. Installation and compilation of code is easy and configuration can be done with the web interface the package contains all tables required to populate my sql database. I have created a virtual machine by using OpenSuSE Linux for testing. Triggers and actions can be configured by using GUI & reporting feature is well and advanced. Zabbix provide feature of automatic discovery of installed on agents over network. Reporting is good and sufficient with historic data and current trends. Daemons collects data and send it to the monitoring server. Agents are available for various platforms including IBM Aix , Linux , Free BSD , Solaris. Information and monitoring can be done at the granular level. For example it can tell vitals related to processes and queries running in a particular database. Zabbix has a feature of bookmark and create new pages for personal and customized use. A particular screen with specific graphs can be saved for users to refer later as a bookmark. Code is neat and easy to compile. The program is developed in phyton which is lightweight and scalable.
Ground Works installation is difficult and the community edition 6.0.1 version is available on source forge website ISSN : 0975-3397
2248
Anshul Kaushik / (IJCSE) International Journal on Computer Science and Engineering Vol. 02, No. 07, 2010, 2246-2252 5.3. Zenoss
5.5. Nagios
This tool was developed by Bill , Erik Dahl , Mark Hinkle and is capable of monitoring all devices , servers , network and application inside data center. The core database and the events are stored in My SQL database. It comes with an integrated package with all incorporated modules. Data is also stored in Configuration Management Database and ZODB. It has also enterprise version with support and additional functionalities. There are several services used by the program like ZENPin , ZENStaus , ZENModellar ,ZENSyslogs which can be configured either separately on each server providing scalability to the deployment.
Nagios is the most popular monitoring system and is bundled with almost all linux distributions. There are several other plugins , addon scripts that can be customized and used with the nagios.
The installation is neat and easy it comes with a neat interface and support of virtual machines , cloud computing monitoring is also there. Auto detection is based on SNMP and is quite handy for adding resources in the dashboard. The community of Zenoss is great and support of experienced staff is there. Agents deployment is easy and fast , size of the agents is small compared to any other product. Support to virtualization provides an additional advantage over the other programs in the area. Historic data is saved and navigation is almost easy. The laest version tested was 3.0.2 with Cent OS 5 RPM package. Agents are available for almost all platforms and supports reporting and drill down historic data.
5.4. Open-nms As name suggests Open NMS , initially a Network Management System and one of the oldest monitoring software in early 2000’s open source leaders were only Nagios & Open NMS. Open NMS identifies servers in data center & services are linked to the interfaces. System is developed on J2EE framework. Installation is smooth current available version is 1.8.4. Packages are available for Windows , Linux , Solaris . Clients are also available for I-phone , I-pad mobile devices. The configuration is step by step and very simple . Documentation is good and community is active. Being the oldest system ample of support is available. Virtual appliances are not available but demo is available on the NMS website. Open NMS has a service called eventd which differentiates between the events being used by the Open NMS server itself. Installation on windows was easy and it was self explanatory. Ample of documentation is available on website. Notifications cab be configured as emails , text based messages with appropriate escalations and incident reporting. MIS repots can be generated for the historic data.
Nagios is a light weight program and provides a comprehensive monitoring tool that can used to monitor all protocols and network devices. It is also capable of providing real time comprehensive graphs and trend analysis. SLA (Service Level Agreement) can be traced on the basis of data availability. Nagios is developed in C and installation is neat and easy. Code is stable and bandwidth resources requirement is lesser then any other tools. Automatic discovery is also available and is quite efficient in identifying new servers. Although it was observed that a device is identified another time by the server on reboot. Overall user interface is simple and easily accessible. Alert definitions and escalations can be configured using templates at the granular level. SMS configurations can be done by using an SMS gateway. 5.6. Hyperic-hq Recently acquired by Spring Source coded in Java this is the one of the best open source monitoring solution competing with other commercial product from major companies. Current available version is 4.1.1. A bit bulky in its class because of java agent bundled with Jboss and comes with integrated database. Both open source and commercial versions are available in this case as well. Installation is pretty neat and can be setup on Windows within minutes. Default admin user name and password is hq admin , Dashboard is quite detailed and works on the matrices collected by the agent. Agents are quite bulky and can take afrom almost 70 Mbs – 100 Mb of memory. Autodiscovery feature is also available but was not quite impressive in AIX Hacmp or Windows Clustering monitoring. There are many plugins and other resources are available for the productive and community is active. They have also introduced a module called sigar for more detailed reporting component. The Sigar API provides a portable interface for gathering system information such as:
ISSN : 0975-3397
System memory, swap, cpu, load average, uptime, logins Per-process memory, cpu, credential info, state, arguments, environment, open files File system detection and metrics Network interface detection, configuration info and metrics TCP and UDP connection tables
2249
Anshul Kaushik / (IJCSE) International Journal on Computer Science and Engineering Vol. 02, No. 07, 2010, 2246-2252
Network route table
Virtual Appliances can be created and Hyperic almost runs on any platform including IBM Aix which is not supported by any of the other products so well. For aix autostart entry is required in the initab file which was figured out after 3-4 days of shell programming and reading hyperic script code. Overall performance was pretty good , details of each Ethernet card , disk logical volumes and granular details can be monitored and can be configured as an alerts. Only 120 days historic data can be kept. Configuring SMTP services is easy. Special agent. Properties file can be edited for different parameters related to agent communication with server and collection of matrices. One GB ram is recommended for the server, Database is PostgreSql. Alerts can be configured as SMS , email. Users can be created in an open source edition but all with modify rights . Enterprise edition support users with several access permissions and templates. Dashobard can be saved and edited with the frequently visited graphs. It has incident management module inbuilt with the software and it is quite comprehensive. The major disadvantage is the amount of resources used by the JVM compared by other monitoring tools. Overall a good monitoring package with online support and enough documentation available being used by many enterprises for daily monitoring, easy configurable , Agents available for almost all platforms.
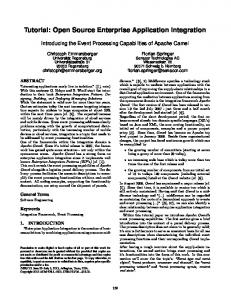
Fig : Graph for different products w.r.t parameters on x axis Rated on 1 to 5 scale.
As plotted in above diagram Nagios and Hyperic are major contenders followed by others. Over all Hyperic HQ is a good package for data center monitoring without much coding and other related configurations one can easily setup for the enterprise. Because of the time and approval constraints we have tested performance of two major solutions i.e Hyperic & Nagios
6. Tests Conducted and Observations For all the tests a IBMHS32 blade was used with 4 GB ram and 320GB hard drive connected with 1GBPS network and CPU clock speed of 3.2 GHZ dual core. All the tests are performed by Using VMware virtual machines or virtual appliances available on the developers / sourceforge website. Linux Versions used for the installation was Ubuntu / CentOS. Ratings are given for each area with respect to 6 different parameters.
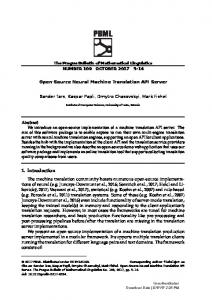
Fig : Performance of Hyperic Hq vs Nagios Peak Memory Utilization (Mbs on X-axis ; Date on y –axis)
It was observed that the peak memory utilization during testing period was higher in Hyperic HQ because of the memory utilization of JVM bulk code but in nagios memory utilization was around 500 Mbs during full load on the server. In our testing scenario there was plenty of resources available in terms of RAM i.e 4 GB for (hyperic server) , 16 GB RAM (clients ) hence we have not faced any performance bottle necks.
7. Conclusion Rather than going for purely technological needs, we also have to look out the best solution that can fit for any ISSN : 0975-3397
2250
Anshul Kaushik / (IJCSE) International Journal on Computer Science and Engineering Vol. 02, No. 07, 2010, 2246-2252 business scenario, skill set of people handling the system, its core users and resources availability. Internetworking framework is also important for escalations and sms delivery. The basic role of system administrator is to setup system and give it to the other application development teams so that they can easily configure their requirements with their own user id’s. On this part Hyperic scores a little less because of the fact that it can create users but all with the same level access in open source edition, for creating user access rights enterprise version is needed. Out of all these open source solutions Nagios is the tool that is being used by the masses. Now we have option of virtual images / appliances from nagios. If manually implementation is carries out then Hyperic Hq has an edge over others because of windows installer package and everything is integrated into one bundle. Only CIGAR needs to be configured for the advanced users but that is a different ball game all together. Al l tool are more or less same in terms of functioning nagios has additional plugin capability to get events on mobile devices as well. Zabbix has quick reporting capabilities. Open NMS is very well suited for the core networking environments , Ground Works is not in the list because of the difficult installation and community support , it can be considered as the Nagios+ edition. Zenoss has an edge over monitoring virtualization platforms. After playing for some days with all these tools and sample configuration we gathered performance related data. It can be concluded that each of the solution has its own advantages and drawbacks. While analyzing it for the manufacturing domain the tool that was selected was Hyperic HQ. SNMP protocol is widely used for developing latest monitoring solutions for network devices because of its lean structure and presence in mostly all operating systems. After implementing this solution we expected changes in the areas mentioned in the trailing figure.
So we conclude that open source systems are sometimes more powerful then the commercial products because of their large community and skill sets. Open source is evolving as a major trend for the industries looking for scalable cost efficient solutions for their business operations. Monitoring is very critical in the enterprise environment and can be implemented very well by using any of the mentioned open source monitoring solution. And out of them Hyperic HQ is the simple and best in terms of implementation and management. This is not end -- The quest for knowledge and scalable solutions will give rise to more such open source technologies to evolve. If you need any other information about the tests / observations or need help in
8. References [1] [2] [3] [4] [5]
A Simple Network Management Protocol (SNMP) RFC 1157 Internetworking Technology Handbook Cisco Press. Management Information Base for network management of TCP/IPbased internet RFC 1066 - 1156 Simple Network Management Protocol RFC 1067 Structure and identification of management information for TCP/IPbased internets RFC 1065
9. Acknowledgement I would like to thank my organization Honda Motors India Pvt. Ltd. for giving me an opportunity to establish and work on the solution for monitoring data center operations based on the open source technologies. I would also like to thank personally Mr.Hilal Khan our CIO and my immediate boss Mr. Pawan Kumar for their guidance and support.
10. Author Profile Anshul Kaushik is currently working as Sr. Executive (Technology Consultant) in Corporate Startegic Information System Division (SIS) of Honda Motors India Pvt Ltd. He received his B.Tech from UPTU. He is a Microsoft Certified System Administrator (MCSA) , Cisco Certified Network Associate (CCNA) , Ethical Hacker (EH) & IBM Certified AIX Expert. Currently He is working towards his M.S from BITS , Pilani (Birla Institute of Technology & Science Pilani). He has also worked on several freelancing projects on Computer Security & Networking He has also moderated and administered several Security Groups within India. He has also Received original mind award in 2002 by honorable Information Technology Minister Mr. Murli Manohar Joshi & IPS Mrs. Kiran Bedi for his contribution in science and technology domain.
ISSN : 0975-3397
2251
Anshul Kaushik / (IJCSE) International Journal on Computer Science and Engineering Vol. 02, No. 07, 2010, 2246-2252 While in graduate school He was also part of Teach India Initiative by Times of India Group. His core areas of research includes Open Source Technologies, Internetworking technologies, Computer Security, Automation & Pervasive computing. He has also authored a book on computer and network security in 2006 titled “ Insiders Guide to Network Forensics”. His website offers some additional background related to his Awards, Projects, Research’s conducted with his latest updated personal profile. He can be contacted anshulkaushik[dot]it[at]gmail.com
on
his
email
Website : anshulkaushik.com
ISSN : 0975-3397
2252