Use of Real-world Connected Vehicle Data in Identifying High-risk Locations Based on a New Surrogate Safety Measure Kun Xie1, Di Yang2,*, Kaan Ozbay3, Hong Yang4 1Department
of Civil and Natural Resources Engineering, University of Canterbury, 20 Kirkwood Ave, Christchurch
8041, New Zealand,
[email protected] 2Department
of Civil and Urban Engineering, Connected Cities for Smart Mobility towards Accessible and Resilient
Transportation (C2SMART) Center, and Center for Urban Science and Progress (CUSP) New York University, 370 Jay Street, Brooklyn, NY 11201,
[email protected] * Corresponding Author 3Department
of Civil and Urban Engineering, Connected Cities for Smart Mobility towards Accessible and Resilient
Transportation (C2SMART) Center, and Center for Urban Science and Progress (CUSP), New York University 370 Jay Street, Brooklyn, NY 11201,
[email protected] 4Department
of Modeling, Simulation & Visualization Engineering, Old Dominion University,
4700 Elkhorn Ave, Norfolk, VA 23529,
[email protected]
Abstract Traditional methods for the identification of high-risk locations rely heavily on historical crash data. Rich information generated from connected vehicles could be used to obtain surrogate safety measures (SSMs) for risk identification. Conventional SSMs such as time to collision (TTC) neglect the potential risk of car-following scenarios in which the following vehicle’s speed is slightly less than or equal to the leading vehicle’s but the spacing between two vehicles is relatively small that a slight disturbance would yield collision risk. To address this limitation, this study proposes time to collision with disturbance (TTCD) for risk identification. By imposing a hypothetical disturbance, TTCD can capture rear-end conflict risks in various car following scenarios, even when the leading vehicle has a higher speed. Real-world connected vehicle pilot test data collected in Ann Arbor, Michigan is used in this study. A detailed procedure of cleaning and processing the connected vehicle data is presented. Results show that risk rate identified by TTCD can achieve a higher Pearson’s correlation coefficient with rear-end crash rate than other traditional SSMs. We show that high-risk locations identified by connected vehicle data from a relatively shorter time period are similar to the ones identified by using the historical crash data. The proposed method can substantially reduce the data collection time, compared with traditional safety analysis that generally requires more than three years to get sufficient crash data. The connected vehicle data has thus shown the potential to be used to develop proactive safety solutions and the risk factors can be eliminated in a timely manner. Keywords Connected Vehicles; Identify High-risk Locations; Surrogate Safety Measure; Proactive Safety Solutions < See AAP Online Version: https://doi.org/10.1016/j.aap.2018.07.002 >
1
1. Introduction Accurate identification of high-risk locations can result in efficient allocation of government resources for safety treatments. Traditional methods for the identification of highrisk locations rely heavily on historical crash data. High-risk locations cannot be detected until a sufficient amount of crashes happen, which often requires a significant amount of time. A more proactive and in some conditions time-efficient approach is based on surrogate safety measures (SSMs), which can assess traffic risks by capturing the more frequent “near-crash” situations. The idea behind this approach is that SSMs are causally related to accidents or injuries and they can indicate safety related performance and help understand the process that leads to accidents (Davis et al. 2011; Laureshyn et al. 2016). Since its first introduction in the 1950-60s (Forbes 1957; Perkins and Harris 1967), many studies have been undertaken over the years to use SSMs as alternatives to evaluate the traffic safety performance (Gao et al. 2018; Kurkcu 2018; Xu et al. 2012; Yang 2012). A detailed scoping review of the development of SSMs and current study methods were summarized in a newly published report funded by the European Union (Laureshyn et al. 2016). Besides summarizing different types of trends of SSM studies and brief discussion of each typical SSM, it pointed out that because of the great improvement of sensor technologies in the last decade, data collected from these sensors opens new opportunities but also poses new questions and challenges for SSM studies. One of the most commonly used tools is video recording. Several recent studies have been focused on using computer vision technics to detect and track vehicles as well as other road users in videos and studying conflicts within a complex traffic environment (Ismail et al. 2009; Laureshyn and Ardö 2006; Xie et al. 2016). These studies have shown a good correlation between the risks identified by SSMs and crash data or manually extracted sample events by human observers according to certain conflict standards. It is well accepted in literature that SSM-based approach can help identify high-risk locations before the occurrence of actual crashes. Further, the emerging connected vehicle (CV) technologies are envisioned to transform the future transportation systems. CVs are generally equipped with devices such as GPS loggers and cameras and can act as mobile sensors in the road network. Rich information generated by these vehicles then can be used to detect traffic risks in real time. For example, if hard breakings were observed frequently at one road segment, we can infer that it could have 2
design deficiencies. Combining with surrogate measures, high-risk locations can be identified and predicted in a timely manner even without crash data. For example, Yang et al. (2017) used the CV data to examine surrogate measures in analysing the risk of secondary crashes on highways. Proactive countermeasures for mitigating the risks and impacts of traffic crashes can be developed in advance. Under the supervision of U.S. Department of Transportation (USDOT), Connected Vehicle Safety Pilot is a research initiative that features real-world implementation of connected vehicle safety technologies, applications, and systems (Henclewood et al. 2014). As a part of this research initiative, the Safety Pilot Model Deployment (SPMD) in Ann Arbor, Michigan hosted approximately 3,000 vehicles equipped with vehicle-to-vehicle (V2V) communication devices (Henclewood et al. 2014). These vehicles generated a large volume of high-resolution data from examining their operational and safety performance. This study aims to exploit the potential of using data generated by CVs to develop more proactive safety solutions. Specifically, the real-world CV pilot test data from SPMD is used in this study. A detailed procedure of data cleaning and processing is presented. A novel SSM is proposed to overcome the shortcomings of existing ones. The proposed SSM is justified by verifying its correlation with historical crash data. High risk locations identified by the SSM are also inspected.
2. Literature Review 2.1 Surrogate Safety Measures Time to collision (TTC), which was proposed by Hayward (1972), is one of the most widely used SSMs. TTC is defined as the time required for two vehicles to collide if they continue at their present speeds and on the same path. Mathematically, it is given by: l0 lv , v2 v1 TTC v2 v1 otherwise
(1)
where l0 is the initial relative distance between the leading and following vehicles, lv is the length of the vehicle, v1 is the initial speed of the leading vehicle, and v2 is the initial speed of the following vehicle. A car-following scenario is considered as unsafe if its TTC value is less than a certain threshold value. Due to its simplicity, TTC has been widely used to 3
evaluate the risk of car-following scenarios (van der Horst and Hogema 1993; Yang 2012). As derivatives of TTC, time exposed TTC (TET) and time integrated TTC (TIT) were introduced by Minderhoud and Bovy (2001) to assess risk for one driver during a certain period of time for a specific trip. They were shown to be useful surrogate measures in microsimulation studies that focus on safety impacts (Ozbay et al. 2008). Ozbay et al. (2008) modified TTC by including accelerations/decelerations rate of the leading and following vehicles into consideration and derived a new surrogate measure, namely MTTC. It has been confirmed that MTTC has the capability to highlight the high-risk locations based on simulation studies (Yang et al. 2010). Deceleration rate to avoid crash (DRAC) is another widely used surrogate measure. It is defined as the minimum deceleration rate required by the following vehicle to come to a timely stop (or match the leading vehicle’s speed) and hence to avoid a crash (Cooper and Ferguson 1976). Mathematically, DRAC is defined as: v2 v1 2 , v2 v1 DRAC l0 lv otherwise
(2)
A vehicle is at risk if its DRAC value exceeds a certain threshold value. It is recognized as an effective measure of safety performance and seems to be closer to crash mechanism by considering the evasive action taken by the following vehicle (Kuang and Qu 2014). Based on DRAC, crash potential index (CPI) is introduced by Cunto and Saccomanno (2007) to estimate the probability that a given vehicle’s DRAC exceeds its maximum available deceleration rate (MADR). Different from aforementioned surrogate measures, CPI gives the probability of a vehicle involving in conflict risk, and it does not require the selection of a certain threshold value. Based on the assumption that MADR follows a truncated normal distribution, Souza et al. (2011) calibrated the distributions of MADR for cars, trucks and buses using field tests data, which includes initial speeds of vehicles ranging from 80 to 100 km/h and the distances travelled by these vehicles to come to a full stop. Kuang et al. (2015) summarized three major shortcomings of the SSMs mentioned above: (a) any scenarios in which the following vehicle’s speed is lower than or equal to the leading vehicle’s speed are regarded as safe even when the spacing between the two vehicles
4
is very small; (b) driver’s reaction time is not taken into consideration; (c) the arbitrary selection of threshold might result in inaccurate outcomes. Kuang et al. (2015) proposed to use aggregated crash index (ACI) for risk evaluation, which overcomes these three shortcomings. By imposing a hypothetical disturbance to the leading vehicle, which makes it to decelerate at a constant deceleration rate, the potential collision risk can be captured for the car-following scenarios when the following vehicle’s speed is less than or equal to the leading vehicle’s speed. The reaction time and MADR of the following vehicle, which follows two different distributions, are considered in evaluating evasive actions taken by the following vehicle after imposing the disturbance. ACI captures the probability of collision thus a threshold for risk identification is not needed. ACI was calculated using the Monte Carlo simulation method and its performance was validated in a micro traffic simulation model. The results showed that ACI outperformed traditional surrogate measures in achieving higher correlation with rear-end crashes. However, the ACI is not very intuitive and can be difficult to compute. Moreover, the value of ACI is subject to the selection of distributions of reaction time and MADR.
2.2 Previous Studies Using SPMD Data The United States Department of Transportation’s Volpe National Transportation Systems Center (Volpe) conducted an independent evaluation of crash warning applications based on V2V communications for the National Highway Traffic Safety Administration (NHTSA), using data collected from the SPMD field test (Nodine et al. 2015). The capability of the V2V applications and drivers’ reaction to warnings were exploited. Data measurement and collection errors were reported in this evaluation. A GPS positioning error was found to cause a missed blind spot/lane change warning (BSW/LCW) alert and it is presumed that more missed alerts might potentially occur. A programming error was found within the safety applications that on rare occasions caused a larger velocity value to be transmitted over-theair (OTA) than the actual velocity reading. Clearly, it is necessary to perform data quality check before further investigation. A portion of the SPMD CV test data is available to the public and was used in some recent studies. One Day Sample data collected from participating vehicles equipped with Data Acquisition System (DAS) on April 11, 2013 was used by Liu and Khattak (2016) to capture extreme driving events. Basic Safety Message (BSM) dataset collected in October 2012 and 5
April 2013 was used by Kamrani et al. (2017), Kamrani et al. (2018) and Liu and Khattak (2018) to study location based volatility in the Ann Arbor area and by Zhang and Khattak (2018) to identify extreme lane change events. One month BSM data collected in April 2013 was used by Mousa and Ishak (2017) to estimate travel time on the selected highways and by Machiani et al. (2017) to develop a driver behavior model to predict risky behaviors at horizontal curves. Data collected by road-side units (RSU) in two months was used by Zhao and Zhang (2017) to observe queueing dynamics at signalized intersections and by Zheng and Liu (2017) to estimate traffic volumes for signalized intersections along with signal status data from Signal Phase and Timing (SPaT) messages. Despite of the necessity of data quality check, only Liu and Khattak (2016) and Kamrani et al. (2017) mentioned that they checked the data quality based on the descriptive statistics of key variables. No detailed procedure of data cleaning and processing was presented in the aforementioned studies.
3. Time to Collision with Disturbance (TTCD)
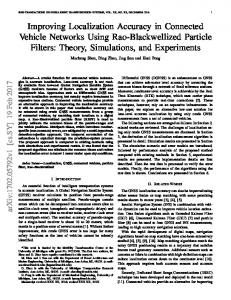
Figure 1 A car following scenario after imposing a disturbance on the leading vehicle.
6
Nomenclature
d : the deceleration rate of the leading vehicle
d * : the deceleration rate of the leading vehicle that causes the collision to occur exactly when the leading vehicle stops v1 : initial speed of the leading vehicle
v2 : initial speed of the following vehicle (remains constant in the car following scenario) t0 : the time when a disturbance is given
t * : the time interval between the given of the disturbance and the full stop of the leading vehicle
lv : the length of the vehicle l0 : initial relative distance between the leading vehicle and the following vehicle
l1 : distance travelled by the leading vehicle after being given a disturbance
l2 : distance travelled by the following vehicle before colliding with the leading vehicle after a
disturbance has been given to the leading vehicle
N : number of Monte Carlo simulations TTCD: the time interval between the given of the disturbance and the collision of the two vehicles
To address the shortcomings of SSMs employed in previous studies, we propose a new SSM namely, time to collision with disturbance (TTCD) to capture the risks of rear-end collisions. Similar to ACI, a hypothetical disturbance is imposed on the leading vehicle, so TTCD can capture the risk of car-following scenarios when the speed of the following vehicle is not higher than that of the leading vehicle. Intuitively, TTCD can be regarded as the time to collision with a disturbance imposed on the leading vehicle. Compared with ACI, TTCD is more intuitive since it is based on the well-known and widely used concept of TTC. Also, it is much easier to compute than ACI without including reaction time and MADR as random variables. Let’s assume that a car following scenario shown in Figure 1. A disturbance is imposed on the leading vehicle at time t0 . It is assumed that, after being given the 7
disturbance, the leading vehicle will decelerate at a constant rate d until it is fully stopped. d is the deceleration rate of the leading vehicle, which follows a certain probability distribution. If the speed of the following vehicle remains the same throughout the entire car following process, a collision will eventually occur after a certain time. This time duration is defined as TTCD. Figure 1 depicts the vehicle movements after imposing a disturbance on the leading vehicle. The relationship described by equation (3) holds for all possible collision outcomes. l0 l1 l2 lv
(3)
There are two possible collision outcomes, depending on the status of the leading vehicle: (a) collision outcome 1 – the leading vehicle is still decelerating when collision occurs; and (b) collision outcome 2 – the leading vehicle is fully stopped when collision occurs. The critical scenario to distinguish between these two collision outcomes is that the following vehicle collides with the leading vehicle exactly at the time when the leading vehicle stops. The distances travelled by the leading vehicle l1 , the distance travelled by the following vehicle l2 , and the time it takes for the leading vehicle to stop t * in this critical scenario are given by equations (4), (5), and (6), respectively: v12 2d *
(4)
l2 v2t *
(5)
v1 d*
(6)
l1
t*
where d * is the deceleration rate of the leading vehicle that satisfies the critical condition mentioned above. Substituting equations (4), (5) and (6) into (3), we can get: d*
2v1v2 v12 2 l0 lv
(7)
Based on the deceleration rate d imposed by the disturbance and the critical deceleration rate d * , there are two possible collision outcomes. Collision outcome 1: d d *
2v1v2 v12 2 l0 lv
8
Collision outcome 1 represents the scenario where the following vehicle collides with the leading vehicle before/when the leading vehicle fully stops. The distances travelled by the leading and the following vehicle in this scenario are given by equations (8) and (9): 1 l1 v1t1 dt12 2
(8)
l2 v2t1
(9)
By substituting equations (8) and (9) into equation (3), we get: TTCD
v1 v2 v1 v2
2
2d l0 lv
d
Collision outcome 2: d d *
(10)
2v1v2 v12 2 l0 lv
Collision outcome 2 represents the scenario in which the following vehicle collides with the leading vehicle after the leading vehicle fully stops. The distances travelled by the leading and the following vehicles in this scenario are shown by equations (11) and (12): v12 l1 2d
(11)
l2 v2t1
(12)
By substituting equations (11) and (12) into equation (3), we get: TTCD
2d l0 lv v12 2dv2
(13)
Equation (14) summarizes the computation of TTCD for the two above scenarios:
v v v v 2 2d l l 2v v v 2 1 2 0 v 1 2 , d 1 2 1 d 2 l0 lv TTCD 2 2v1v2 v12 2d l0 lv v1 , d 2dv2 2 l0 lv
(14)
To differentiate risky encounters from situations where the driver remains safely in control, an appropriate threshold TTCD* must be defined. TTCD* is related to the perception and reaction times as well as driving conditions. Similar to the approach of identifying conflicts with TTC, vehicle pairs with TTCD lower than TTCD* are involved with conflicts. Clearly, TTCD is not only related to the relative speed and distance between the two vehicles, but also the speeds of the leading and following vehicles and deceleration rate of the leading 9
vehicle. In this case, car following scenarios with the initial speed of the following vehicle less than or equal to the initial speed of the leading vehicle could still yield risks rather than always regarded as safe by methods based on TTC and DRAC. Note that when the speed of the following vehicle v2 is zero, TTCD will be infinity, which will not lead to conflict. The disturbance imposed has a direct impact on TTCD. Disturbances are random in nature and it will lead to random deceleration rates for the leading vehicle. Therefore, it is necessary to include all possible deceleration rates into consideration for each car following scenario. In this study, we assume that the deceleration rate of the leading vehicle follows a shifted gamma distribution (17.315, 0.128, 0.657), which is calibrated by Kuang and Qu (2015) by analyzing the normal deceleration rate taken due to the lane-changing maneuver on freeways using the Next Generation Simulation (NGSIM) data (FHWA 2005). A Monte Carlo simulation method was applied to calculate TTCD for each deceleration rate sample for i th car following scenario. Setting a threshold value of TTCD*, we obtained the proportion of samples with TTCD below the TTCD* out of all the samples generated by Monte Carlo method. Conflict Risk with Disturbance (CRD), which indicates the probability of being involved with conflict under hypothetical disturbance, is defined in equation (15):
CRDi
Ni TTCD TTCD* N
(15)
where CRDi indicates the probability of involving into a conflict for i th car following
scenario, Ni TTCD TTCD* is the number of samples with TTCD below the TTCD* for i th car following scenario, and N is the total number of samples generated by the Monte Carlo simulation method. We choose N 10,000 , which is sufficient to depict the distribution of the deceleration rate. It is worth to mention that CRD is a continuous variable, ranging from 0 to 1, and thus has better flexibility to quantify the risk. On the contrary, the TTC- and DRACbased methods use the presence of conflict to quantify the risk, which is a dummy variable.
4. Data Preparation 4.1 SPMD Data SPMD is a comprehensive data collection effort, under real-world conditions. Two sample data, namely SPMD One Day Sample (April 11, 2013) and SPMD Two Months 10
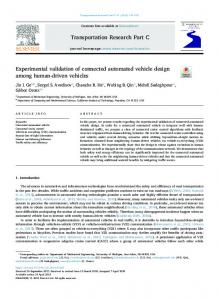
Sample (October 2012 and April 2013), are open to the public on the ITS Data Hub of US Department of Transportation (https://www.its.dot.gov/data/). The safety pilot environment contains eight datasets, namely Data Acquisition System 1 (DAS1), Data Acquisition System 2 (DAS2), Basic Safety Message (BSM), Roadside Equipment, Network, Weather, Schedule, and Road-Work Activity. The DAS1 dataset, collected during April 2013 by the University of Michigan Transportation Research Institute (UMTRI), was used in this study. A total of 62,589,725 messages, collected by 90 vehicles equipped with DAS from April 1 to April 30, 2013 were investigated. Within the DAS1 dataset, the DataFrontTargets file can be used to detect traffic risks and DataWsu file provides information to associate the detected risks with specific locations. As discussed in Literature Review, data quality check should be performed before using this data for further analysis. Thus, a detailed procedure of cleaning and integrating those two files is illustrated in Figure 2. R Programming Language (Team 2013) was used for data manipulation and ArcGIS software (ESRI 2011) was used for spatial processing.
Figure 2: Data processing procedure.
DataFrontTargets file contains the data collected by Mobileye sensors (Mobileye 2017) at a sample rate of 10 Hz. Mobileye sensors track all the objects in front of the host vehicles using vision-based technologies. The relative distance (Range) and relative speed (RangeRate) between each connected vehicle and its leading vehicles were recorded in DataFrontTargets file. The field CIPV (Closest In Path Vehicle) indicates whether a target is the closest in a vehicle’s path. The criterion “CIPV = 1” was used to ensure that we were
11
investigating the risk between each host vehicle and its closest leading vehicle in the same path. DataWsu file logs GPS and Controller Area Network (CAN) Bus via the onboard Wireless Safety Units (WSUs) at a sample rate of 10 Hz. It contains the movement information of host vehicles, including position (LatitudeWsu and LongitudeWsu), epoch time (GpsTimeWsu), speed (GpsSpeedWsu and SpeedWsu) and longitudinal acceleration (AxWsu). It should be noted that GpsSpeedWsu was obtained from WSU GPS receiver and SpeedWsu was obtained from vehicle CAN Bus. Generally, GpsSpeedWsu provides better measurements of speed. As the first step of data cleaning procedure, duplicated records were removed. Then we used the criterion “GpsValidWsu = 1 and ValidCanWsu = 1” to filter out records with invalid WSU or CAN Bus messages. The DataFrontTargets file was merged with the DataWsu file based on the fields Device, Trip and Time. The field description of the merged dataset is reported in Table 1.
12
Table 1: Description of the Fields of the Merged Dataset (based on Henclewood and Rajiwade (2015))
Origin File
Field Name Device
Description A unique numeric ID assigned to each DAS. This ID also doubles as a vehicle’s ID Trip Count of ignition cycles—each ignition cycle commences DataFrontTargets when the ignition is in the on position and ends when it is in & DataWsu the off position Time Time in centiseconds since DAS started, which (generally) starts when the ignition is in the on position (centiseconds) Range Longitudinal position of an object, typically the closest object, relative to a reference point on the host vehicle, according to the Mobileye sensor (m) RangeRate Longitudinal velocity of an object, typically the closest object, DataFrontTargets relative to the host vehicle, according to the Mobileye sensor (m/sec) CIPV Field communicating whether a target is the closest in a vehicle’s path 1: Identified target is the closest in a vehicle’s path; 0: otherwise GpsValidWsu 1: GPS data point is valid; 0: otherwise GpsTimeWsu Epoch GPS time received from the remote vehicle that has been targeted by the host vehicle’s WSU (millisecond) LatitudeWsu Latitude from WSU receiver (degree) LongitudeWsu Longitude from WSU receiver (degree) DataWsu AltitudeWsu Altitude from WSU receiver (m) GpsSpeedWsu Speed from WSU GPS receiver (m/sec) ValidCanWsu 1: Valid Vehicle CAN Bus message to WSU; 0: otherwise SpeedWsu Speed from vehicle CAN Bus via WSU (kph) AxWsu Longitudinal acceleration from vehicle CAN Bus via WSU (m/sec2)
Erroneous data points were removed based on the values of GpsSpeedWsu, SpeedWsu, AxWsu, and AltitudeWsu. According to the information regarding latest automative news and technologies (Car and Driver 2014; Production Car Speed Record 2017), the fastest car in the world can travel at a speed of 415 miles/hour (115 m/s) and the maximum acceleration rate of vehicles is around 10 m/s2. Measurements of speeds higher than 115 m/s and the absolute values of acceleration rate greater than 10 m/s2 were removed as outliers. The average elevation in Ann Arbor is 267 m (LatLong.net 2017). The values of AltitudeWsu were within a reasonable range from 128.51 m to 305.65 m and thus no outliers were detected. Additionally, the accuracy of Rangerate, which was defined as the speed of the leading vehicle minus the speed of the following vehicle, was examined. Therefore, if Rangerate is negative and the absolute value of Rangerate is greater than the host vehicle’s speed (GpsSpeedWsu), this indicates that the leading vehicle is backing up at a speed of Rangerate - GpsSpeedWsu. According to the SPMD Data Handbook (Henclewood and 13
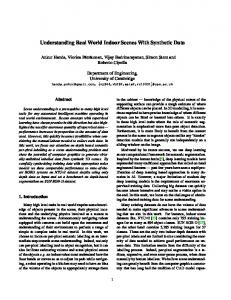
Rajiwade 2015), a Mobileye camera is able to cover three or more lanes in front of host vehicles, so it is likely that it can detect vehicles from the opposite directions if the road is narrow and does not have a median. Moreover, in the cases that both the host vehicle and leading vehicle are running at the same speed, it is possible that the Rangerate is negative and Rangerate – GpsSpeedWsu is greater than zero due to the measurement errors. The criterion “Rangerate – GpsSpeedWsu > 1” (i.e., backing up at a speed higher than 1 m/s) was used to rule out records which actually described the vehicle movements in the opposite direction. There are totally 15,721,962 GPS points after the data cleaning process. The heat map of all the GPS data is shown in Figure 3 (histogram equalization is used to transform density). Most vehicle GPS points are located around the city of Ann Arbor. The roads with bright colour are mostly interstate, U.S. and state highways.
Figure 3 Heat map of trajectories in the cleaned connected vehicle dataset
4.2 Traffic and Crash Data A total of 75 highway segments that have complete traffic data were selected for analysis, as shown in Figure 6. Annual average daily traffic (AADT) of those highways in 2013 were obtained from the Michigan Department of Transportation (MDOT) Open Data (http://gis-mdot.opendata.arcgis.com/). Crash dataset was obtained from the Michigan's Open Data Portal (https://data.michigan.gov/). Based on the available information, the issue of underreporting is unknown at this time. Crash occurrence time, location, three levels of severity namely, fatal, injury, and property damage only (PDO), and other characteristics 14
were included in the crash dataset. A total of 2,323 crashes of all three severity levels occurred on the selected highways in Ann Arbor in 2013 and 1,027 of them were rear-end crashes.
5. Analysis and Results 5.1 Determination of Optimal SSM Thresholds As discussed in the literature review section, the arbitrary setting of thresholds is another shortcoming when applying SSMs to identify risks. This section proposes a method to identify the optimal thresholds by maximizing the correlation coefficients between risk and rear-end crash data. Rear end crashes and GPS points collected by CVs were assigned to the nearest road segments, if the distances to the nearest road segments are less than 10 m. To obtain the optimal SSM thresholds, every possible threshold value incremented by 0.1 within a reasonable range was tested. Each GPS point will be given a risk value based on the current threshold used. If we use TTC and DRAC for risk identification, the risk value associated with each GPS point is the presence of conflict (dummy variable: 0 for no conflict, 1 for conflict); whereas if we use the proposed TTCD for risk identification, the risk value associated with each GPS point is CRD (continuous variable, ranging from 0 to 1). When aggregating these risk values by road segment, we obtained the aggregated risk for the road segment i , AggRiski . The rear-end crash count for the road segment i , CrashCounti was also obtained. To account for the effect of exposure indicators, RiskRatei and CrashRatei are calculated for the road segment i using equations (16) and (17), respectively: AggRiski NumGPSi
(16)
CrashCountsi AADTi
(17)
RiskRatei CrashRatei
where 𝑖 is the road segment index, NumGPSi is the number of GPS points assigned to the road segment i , and AADTi is the annual average daily traffic volume for the road segment i . For each possible threshold value, we computed the Pearson’s correlation coefficient (Pearson 1895) between RiskRatei and CrashRatei for three SSMs, TTC, DRAC and TTCD, 15
as shown in Figure 4. Looking at each subplot separately, the optimal thresholds to achieve the highest correlation coefficients are 2.3 s for TTC, 3.0 m/s2 for DRAC and 1.7 s for TTCD, respectively. Correlation significance tests were performed for all three SSMs when applying optimal thresholds. The p-values of the Pearson’s correlation coefficient between SSMs and rear-end crashes were calculated. As shown in Table 2, all three p-values are less than 0.05, which indicates statistically significant correlation between SSMs and rear-end crashes. It is found that risk identified by TTCD can result in the highest correlation coefficient 0.45 among all the three SSMs.
Figure 4: Correlation coefficient between crash rate and risk rate using different threshold values. Table 2 Correlation Significance Test Summary
Optimal Threshold TTC 2.3 s DRAC 3.0 m/s2 TTCD 1.7 s
Pearson’s correlation coefficient 0.41 0.39 0.45
P-value 0.0002 0.0005 0.0000
To further validate our method of finding the optimal method, we tested its performance by using 30% of the segments that have not been used in training process. All the segments in this study were split into training and testing sets. To reduce the effect of randomness, the training and testing split was repeated 30 times. For each time, the optimal threshold for TTCD obtained from the training set was applied to the testing set to calculate correlation within the testing set only. The average correlation between observed crashes and 16
calculated SSMs from the training set is found to be 0.58 while the average correlation using the data in the testing set is found to be 0.46. The decrease in average correlation when using the testing sets is expected but this decrease that is relatively small indicates a stable results.
5.2 Risk Identification Using SPMD Data To better illustrate the risk identification approach proposed in this paper, TTC, DRAC and TTCD were used to identify risks for one trip (Device = 10181, Trip = 119). Optimal threshold value was applied for each SSM (i.e. TTC * 2.3 s , DRAC* 3.0 m / s 2 ,
TTCD* 1.7 s ). Risk identified for each 0.1 s time interval is shown in Figure 5. Clearly, TTCD can capture risks that cannot be identified by TTC and DRAC. For example, both the TTC and DRAC ignored the potential risk from 3762th to 3895
th
time intervals, when the
speed of the following vehicle is slightly less than that of the leading vehicle and the two vehicles are very close to each other. A portion of vehicle movement data during that period is reported in Table 3. Intuitively, conflict risks could exist, because the distance between the leading and following vehicles is less than 3 m and the vehicles are moving at a speed higher than 13 m/s. When using TTC and DRAC for risk identification, if the following vehicle is slower than the leading vehicle (i.e., v2 v1 ), no conflict is detected, according to equations (1) and (2). By contrast, The CRD identified by TTCD for the same period is greater than zero. TTCD could capture risks in car following scenarios, even when the leading vehicle has a higher speed.
17
Figure 5: Risks measured by TTC, DRAC and TTCD for one trip.
Table 3: Vehicle Movement Data and Identified Risks from 3762th to 3768th Time Intervals
Time Interval
3762 3763 3764 3765 3766 3767 3768 …
Relative Distance (m)*
Relative Speed (m/s)* *
Following Vehicle Speed (m/s)
Conflict Presence Identified by TTC 2.77 0.21 13.05 0 2.79 0.21 13.09 0 2.81 0.21 13.07 0 2.83 0.21 13.11 0 2.85 0.21 13.17 0 2.88 0.19 13.21 0 2.90 0.17 13.31 0 … … … ... * Relative distance is the distance between the leading vehicle’s
Conflict Presence Identified by DRAC 0 0 0 0 0 0 0 … rear bumper
CRD Identified by TTCD 0.14 0.07 0.14 0.11 0.17 0.10 0.08 … and the
following vehicle’s front bumper. It is the same as “Range” in Table 1. **
Relative speed is the speed of the leading vehicle minus the speed of the following
vehicle.
18
Figure 6 shows the spatial distribution of rear-end crashes in 2013, risks in April, 2013 identified by TTCD on the selected highways, and AADT. R package ggmap (Kahle and Wickham 2013) was used for data visualization. Darker color indicates high density of crashes (in Figure 6 a), high aggregated risks (in Figure 6 b), and higher value of AADT (in Figure 6 c). High-risk locations identified by connected vehicle data was found to be similar to the ones identified by historical rear-end crash data for one year, even though risk data is extracted from only one month of CV data. It shows the potential of using CV data to detect risk and thus supports more proactive safety management. In this paper, in contrast with the distribution of AADT values, the distribution of conflicts is observed to be more similar to the distribution of crashes. This indicates that in this study conflicts identified by TTCD have greater potential to infer crash risks than AADT values. Further, this observation gives new insights to the discussion on whether traffic conflicts contribute sufficiently valuable additional information that justifies the costs incurred for their collection. From the findings of this study, it seems that it is not enough to model crashes using AADT values only, which is also the point made by Guttinger (1982).
(a)
(b)
(c)
Figure 6: High-risk locations identified by historical rear-end crash data (a) and by TTCD proposed (b).
6. Conclusions This study aims to explore the potential of using the CV data to identify high-risk locations in a more proactive manner, without relying on the historical crash data that often takes long time to collect. Real-world CV pilot test data collected in Ann Arbor, Michigan was used to generate SSMs for risk identification. A detailed procedure of cleaning and processing the SPMD data is presented in this study, which can serve as a guidance for other researchers who want to use this dataset. Traditional SSMs like TTC and DRAC consider any 19
scenarios when following vehicle’s speed is lower than the leading vehicle’s as safe, which ignores the potential risks of scenarios when following vehicle’s speed is lower but the distance between vehicles is small and speeds of vehicles are high. By imposing a hypothetical disturbance, TTCD is able to detect risks in various car following scenarios, even when the leading vehicle has a higher speed. Optimal threshold values for TTC, DRAC and TTCD were determined by maximizing the correlation coefficient between risk identified by those SSMs and rear-end crash rate. Results showed that risk data captured by TTCD could achieve the highest level of correlation with historical rear-end crash data compared with other traditional SSMs. In addition, high-risk locations identified by connected vehicle data was found to be similar to the ones identified by historical rear-end crash data. One major limitation of traditional safety analysis is that the time period required to collect sufficient crash data is generally more than three years. In this study, we tested the hypothesis that SSMs collected from connected vehicles during a much shorter time period can reduce the safety data collection time requirements substantially. The connected vehicle data has thus the potential to be used to advance real-time road safety management by developing more proactive safety solutions before crashes occur. Regarding the limitations of this study, the extent of measurement errors in the vehicle trajectory data was unknown, although the findings in this study were reasonable. Crash data obtained from MDOT could be subject to underreporting issue. All three SSMs used in this study, namely TTC, DRAC, TTCD, aim to capture the rear-end crash risk. SSMs accounting for lateral movements will be studied in future as additional work. Additionally, the number of crashes and conflicts are normalized by AADT and the number of data points (exposure), respectively. However, it should be pointed out that the relationship between AADT and crashes may not be linear. Thus, a careful investigation of the relationship between AADT and crashes as well as the relationship between number of conflicts and exposure are proposed as an important future study. In such a future study, after accounting for the exposure effect properly, the correlations between each SSM and crashes need to be recalculated to further verify the improvement of TTCD compared with TTC and DRAC. Additional data is needed to further verify the type of correlation of each SSM with observed crashes. Besides, another future research direction is to predict future high-risk locations dynamically. Additional CV data is needed to quantify the risk of the road network 20
continuously. The potential of using CV data to evaluate and reduce the risk of secondary crashes can also be studied Yang et al. (2018). Time series model can be trained to associate the future risk with the past. Traffic simulation might be implemented to isolate confounding factors. Prediction of future high-risk locations can also guide the development of short-term patrolling plans of police vehicles or safety measures in terms of modifying existing signs, traffic lights, etc.
Acknowledgment This study was partially supported by the Connected Cities for Smart Mobility towards Accessible and Resilient Transportation (C2SMART) a Tier 1 USDOT University Transportation Center (http://c2smart.engineering.nyu.edu/) at New York University. The contents of this paper reflect views of the authors who are responsible for the facts and accuracy of the data presented herein. The contents of the paper do not necessarily reflect the official views or policies of the funding agencies.
References Car and Driver (2014). "Car and Driver Track Sheet." . (March 25, 2017). Cooper, D. F., and Ferguson, N. (1976). "TRAFFIC STUDIES AT T-JUNCTIONS. 2. A CONFLICT SIMULATION RECORD." Traffic Engineering & Control, 17(Analytic). Cunto, F. J. C., and Saccomanno, F. F. "Microlevel traffic simulation method for assessing crash potential at intersections." Proc., Transportation Research Board 86th Annual Meeting of the Transportation Research Board. Davis, G. A., Hourdos, J., Xiong, H., and Chatterjee, I. (2011). "Outline for a causal model of traffic conflicts and crashes." Accident Analysis & Prevention, 43(6), 1907-1919. ESRI, R. (2011). "ArcGIS desktop: release 10." Environmental Systems Research Institute, CA. FHWA, U. S. D. o. T. (2005). "NGSIM–Next Generation SIMulation." . (March 25, 2017). Forbes, T. W. (1957). "Analysis of" near accident" reports." Highway Research Board Bulletin, 152, 23-37. Gao, J., Ozbay, K., Zuo, F., and Kurkcu, A. (2018). "A Life-Cycle Cost-Analysis Approach for Emerging Intelligent Transportation Systems with Connected and Autonomous Vehicles." Guttinger, V. "From accidents to conflicts: alternative safety measurement." Proc., Proceedings of the Third International Workshop on Traffic Conflict Techniques. Hayward, J. C. (1972). "Near miss determination through use of a scale of danger." Transportation Research Record: Journal of the Transportation Research Board, 384, 24-34. Henclewood, D., Abramovich, M., and Yelchuru, B. (2014). "Safety pilot model deployment-one day sample data environment data handbook." USDOT Research and Technology Innovation Administrations, 1.
21
Henclewood, D., and Rajiwade, S. S. (2015). "Safety Pilot Model Deployment –Sample Data Environment Data Handbook." Research and Technology Innovation Administration, US Department of Transportation, Mclean, VA. Ismail, K., Sayed, T., Saunier, N., and Lim, C. (2009). "Automated analysis of pedestrian-vehicle conflicts using video data." Transportation Research Record: Journal of the Transportation Research Board(2140), 44-54. Kahle, D., and Wickham, H. (2013). "ggmap: Spatial Visualization with ggplot2." R Journal, 5(1). Kamrani, M., Arvin, R., and Khattak, A. J. "Extracting useful information from connected vehicle data: An empirical study of driving volatility measures and crash frequency at intersections." Proc., 97th Annual Meeting of theTransportation Research Board. Kamrani, M., Khattak, A. J., and Wali, B. "Can Data Generated by Connected Vehicles Enhance Safety? Proactive Approach to Intersection Safety Management." Proc., 96th Annual Meeting of theTransportation Research Board. Kuang, Y., and Qu, X. (2014). "A Review of Crash Surrogate Events." Vulnerability, Uncertainty, and Risk: Quantification, Mitigation, and Management, 2254-2264. Kuang, Y., Qu, X., and Wang, S. (2015). "A tree-structured crash surrogate measure for freeways." Accident Analysis & Prevention, 77, 137-148. Kurkcu, A. (2018). "Connected Transportation System: Next Generation Traffic Simulation and Data Collection Tools and Techniques." New York University. LatLong.net (2017). "Ann Arbor, Michigan, the United States." . (March 25, 2017). Laureshyn, A., and Ardö, H. "Automated video analysis as a tool for analysing road user behaviour." Proc., ITS World Congress, London, UK, 8. Laureshyn, A., Johnsson, C., De Ceunynck, T., Svensson, Å., de Goede, M., Saunier, N., Włodarek, P., van der Horst, R., and Daniels, S. (2016). "Review of current study methods for VRU safety. Appendix 6–Scoping review: surrogate measures of safety in site-based road traffic observations: Deliverable 2.1–part 4." Liu, J., and Khattak, A. J. (2016). "Delivering improved alerts, warnings, and control assistance using basic safety messages transmitted between connected vehicles." Transportation research part C: emerging technologies, 68, 83-100. Liu, J., and Khattak, A. J. "Mapping Location-Based Driving Volatility for Connected and Automated Vehicles." Proc., 97th Annual Meeting of theTransportation Research Board. Machiani, S. G., Jahangiri, A., Balali, V., and Belt, C. "Predicting Driver Risky Behavior for Curve Speed Warning Systems Using Real Field Connected-Vehicle Data." Proc., 96th Annual Meeting of theTransportation Research Board. Minderhoud, M. M., and Bovy, P. H. (2001). "Extended time-to-collision measures for road traffic safety assessment." Accident Analysis & Prevention, 33(1), 89-97. Mobileye (2017). "Mobileye." . (March 25, 2017). Mousa, S. R., and Ishak, S. "An Extreme Gradient Boosting Algorithm for Freeway Short-Term Travel Time Prediction Using Basic Safety Messages of Connected Vehicles." Proc., 96th Annual Meeting of theTransportation Research Board. Nodine, E., Stevens, S., Lam, A., Jackson, C., and Najm, W. G. (2015). "Independent evaluation of light-vehicle safety applications based on vehicle-to-vehicle communications used in the 2012-2013 safety pilot model deployment." United States. National Highway Traffic Safety Administration. Ozbay, K., Yang, H., Bartin, B., and Mudigonda, S. (2008). "Derivation and validation of new simulation-based surrogate safety measure." Transportation Research Record: Journal of the Transportation Research Board(2083), 105-113.
22
Pearson, K. (1895). "Note on regression and inheritance in the case of two parents." Proceedings of the Royal Society of London, 58, 240-242. Perkins, S. R., and Harris, J. I. (1967). Criteria for Traffic Conflict Characteristics, Signalized Intersections, Research Laboratories, General Motors Corporation. Production Car Speed Record (2017). "Production car speed record." . (March 27). Souza, J. Q., Sasaki, M. W., and Cunto, F. J. C. "Comparing Simulated Road Safety Performance to Observed Crash Frequency at Signalized Intersections." Proc., Artigo aceito para apresentação in 3rd International Conference on Road Safety and Simulation. Team, R. C. (2013). "R: A language and environment for statistical computing." van der Horst, R., and Hogema, J. "Time-to-collision and collision avoidance systems." Proc., 6th ICTCT workshop Salzburg. Xie, K., Li, C., Ozbay, K., Dobler, G., Yang, H., Chiang, A.-T., and Ghandehari, M. "Development of a comprehensive framework for video-based safety assessment." Proc., Intelligent Transportation Systems (ITSC), 2016 IEEE 19th International Conference on, IEEE, 26382643. Xu, C., Wang, X., and Chen, X. (2012). "Urban Expressway Speed Spatial Inconsistency and Its Effect on Safety." Yang, H. (2012). "Simulation-based evaluation of traffic safety performance using surrogate safety measures." Rutgers University-Graduate School-New Brunswick. Yang, H., Ozbay, K., and Bartin, B. (2010). "Application of simulation-based traffic conflict analysis for highway safety evaluation." Proceedings of the 12th WCTR, Lisbon, Portugal. Yang, H., Wang, Z., and Xie, K. (2017). "Impact of connected vehicles on mitigating secondary crash risk." International Journal of Transportation Science and Technology, 6(3), 196-207. Yang, H., Wang, Z., Xie, K., Ozbay, K., and Imprialou, M. (2018). "Methodological evolution and frontiers of identifying, modeling and preventing secondary crashes on highways." Accident Analysis & Prevention, 117, 40-54. Zhang, M., and Khattak, A. J. "Identifying and Analyzing Extreme Lane Change Events Using Basic Safety Messages in a Connected Vehicle Environment." Proc., 97th Annual Meeting of theTransportation Research Board. Zhao, S., and Zhang, K. "Observing Space-time Queueing Dynamics at a Signalized Intersection using Connected Vehicles as Mobile Sensors." Proc., 96th Annual Meeting of theTransportation Research Board. Zheng, J., and Liu, H. X. (2017). "Estimating traffic volumes for signalized intersections using connected vehicle data." Transportation Research Part C: Emerging Technologies, 79, 347362.
23