Use of Software Metrics in Agile Software Development Process K.V. Jeeva Padmini, H. M. N. Dilum Bandara, and Indika Perera Dept. of Computer Science and Engineering, University of Moratuwa, Sri Lanka.
[email protected],
[email protected],
[email protected] Abstract— While software metrics typically help to assess the status of a project, process, product, and resource use, the suitability of metrics in Agile Software Development (ASD) process is frequently questioned due to the overheads involved. Moreover, many established metrics used in the Traditional Software Development (TSD) process, cannot be directly applied to ASD due to its iterative and incremental development process that is willing to incorporate changes throughout. Nevertheless, very little is explored about the use and suitability of metrics in the context of ASD. We fill this gap by exploring metrics suitable for the ASD process, use of those metrics in practice, perceived benefits, and related tools. Our survey and interview based analysis of 24 development companies identified 10 metrics that can be beneficial to the ASD process, where their benefits outweigh the overheads involved. Keywords—agile software development process; software metrics; traditional software development process; scrum development process
I. INTRODUCTION Software metrics can be used to gain a wide variety of information about the quality of the product delivered to the customer, progress of a software project, cost estimation, and size/complexity of a software system. Measurements need to be closely monitored when the requirements of a software system change frequently. Changing requirements are one of the major problems arising in the software development process. Agile Software Development (ASD) process successfully handles the reality of change. Therefore, while selecting software metrics to measure ASD-based projects, it should be handled with a deeper understanding about the differences between the Traditional Software Development (TSD) and ASD processes and those metrics. If properly measured, those metrics can be used to improve the next iteration in the ASD process. While many well-established software metrics are available for the TSD process, only a few can be applied directly to the ASD process. While some of the traditional metrics can be adapted to use with the ASD process, some are not suitable for the ASD process at all. This is because of the iterative and incremental development process, which is willing to incorporate changes throughout the process. While many surveys and published research analyze different angles of the ASD process, relatively less attention is given to the applicability of software metrics for ASD. The VersionOne annual survey [1] that focuses on the ASD process does 978-1-4799-1740-2/15/$31.00 ©2015 IEEE
not even cover what software metrics are applicable to the ASD process and their appropriateness. According to VersionOne [1], Agile adopted companies that practice Agile across five or more teams have increased from 33% in year 2011 to 48% in 2012. Given that, adaptation into the ASD process is rapidly increasing, it is imperative to identify a set of metrics that is more suitable for the ASD process. Due to the familiarity with the TSD process, many developers and project managers are inclined to use the same metrics for the ASD process. Such attempts lead to wrong interpretation of the progress of the software development project and quality of the deliverables to the customer. This could also lead to frustrations among the team members. We focus on the companies, whose core business is the software development, IT services, and consulting, as well as managing at least one project based on the ASD methodology. Some companies have projects based on both the ASD and TSD processes. In this context, the problem statement can be framed as follows: “What are the important software metrics and their usage in projects based on the ASD process?” To identify a suitable set of metrics for the ASD process, we conducted an online survey and a set of interviews with the industry experts. Our analysis also emphasized on the significance of a metric, its suitability to a given context, perceived benefits, as well as related tools and their usage. The analysis indicates that it is beneficial to adopt metrics in an Agile project, as it helps to track the project progress, monitor product quality, and enables better forecasting and project management. We identified ten metrics that are suitable for the ASD process. Among those the top five metrics include Delivery on Time, Work Capacity, Unit Test Coverage for the developed code, percentage of Adopted Work, and Bug Correction Time from new-to-closed state. Thumbs-up Rule, Noncompliance Index, and Top Hill View are three new metrics identified through the study. Moreover, it was found that companies fully into Agile practices mostly use specialized tools like JIRA/Greenhopper to keep track of metrics while others relied heavily on Microsoft Excel. The rest of the paper is organized as follows. Section II presents related work. Research Methodology is presented in Section III. Survey and interview data analysis is presented in Section IV. A set of recommendations is presented in Section V, and concluding remarks are presented in Section VI.
II. RELATED WORK Measuring software development projects and working product quality is important. It gives a better understanding of a project’s progress and assist in better project management [2]. Metrics provide visibility and insight about what we do and how well we did it [3]. However, to get the maximum benefits out of these measurements, it is also important to have a good understanding about what to measure and how to measure. Therefore, a standard set of software metrics is identified. A good software metric should be simple, precisely definable, measurable, and objective should be attainable at a reasonable cost. Moreover, metrics should be able to assist in developing models, which are useful in predicting process of the product spectrum [4]. Software metrics used in the TSD process can be divided into three types as product, process, and project metrics [5]. Furthermore, metrics can be used for process monitoring and improvement, product improvement, quality control, and for software estimations [6], [7]. TSD process typically uses Lines of Codes (LOC), Halstead Complexity Metric (HCM), and Cyclomatic Complexity Metric (CCM) to measure the software complexity. Defect Removal Efficiency is one of the important measurements of software quality [8]. Defect Density is a software reliability metric which measures the defects per function points or defects per KLOC (i.e., 1,000 lines of code) [9]. Oza and Korkala [10] classified the metrics used in the ASD process as Code level, Productivity/effort level, and Economic metrics. Code-level metrics try to provide visibility into the code quality. Productivity and Economic metrics support the decision making process. Oza and Korkala [10] later classified these metrics into seven categories. Good metrics in the ASD process could lead to enhanced team performance. Therefore, by using software metrics, teams can be managed to optimize the work. Selected metrics should not be a burden to the team members. It should be simple and easy to maintain [2]. Downey and Sutherland [2] identified ten essential metrics which are meaningful and can be used for managerial decision making. Those metrics include Velocity, Work Capacity, Focus Factor, Percentage of Adopted Work, Percentage of Found Work, Accuracy of Forecast, Targeted Value Increase (TVI+), Success at Scale, and Win/Loss Record. Manila [11] came up with a set of customized metrics by analyzing a selected organization that recently moved from the TSD to ASD process. These metrics include Fault Correction Time to Closed state, Delivery on Time, Technical Debt, Unit Test Coverage for the developed code, Smoke Test Cycle Time, and Regression Test Cycle Time. It seems that the studied organization is using customized metrics derived from commonly used TSD-specific metrics such as Unit Test Coverage for the developed code, Smoke Test Cycle Time, and Regression Test Cycle Time. Gustafsson [12] classified ASD metrics into five categories as Quality, Predictability, Business value, Lean, and Cost. He further described three metrics each under Quality and Lean, namely Defect Count, Technical Debt, Faults Slip Though, Lead Time, Work in Progress, and Queues, respectively. Average Cost per Function metric measures the cost attribute. Predictability and Business value are measured using Velocity, Running automated test cases, Customer satisfaction survey, and Business value delivered, respectively.
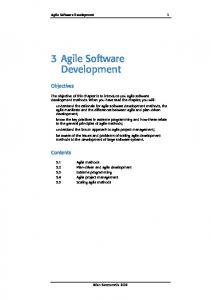
As product the quality in software has become very important, it is also important to understand the quality of the software we are building to achieve the desired expectations [3]. ISO/IEC 9126:1991 defines a software quality metric as a “quantitative scale and method that can be used to determine the value, a feature takes for a specific software product” [13]. Emam [13] stated that “software product metrics play a central role in software engineering, and their proper validation will ensure that there is a compelling case for their use in practice.” Since 1991, ISO has published and expanding international consensus for the quality characteristics with the purpose of standardizing the software product quality measurement process. However, these standards are specified only for the TSD process. Therefore, it is essential to identify an appropriate set of metrics, thresholds, and measurement artifacts, which are suited for the ASD process [14]. III. RESEARCH METHODOLOGY A. Research Method The research was conducted based on the qualitative and descriptive data analysis methodology. The initial objective and the focus of the research were to identify the benefits of the metric usage in the ASD process. However, after several discussions with the professionals, it was identified that the companies are still looking for a more suitable set of metrics to be used within a project based on the ASD process. Fig. 1 illustrates the data collection process. During stage 1 relevant literature was analyzed to identify a set of metrics used in both the TSD and ASD processes. Face-to-face interviews were then conducted with four professionals (from four different reputed IT companies in Sri Lanka) who were involved in projects based on the ASD process. These professionals included two Quality Assurance (QA) Leads, one Associate QA Manager, and a Delivery Manager. Each of them had more than four years of experience in the ASD process. One of them belongs to an organization in service delivery while the other three belong to product-based organizations. One of those organizations has projects based on both the TSD and ASD processes, while the other three had projects based on only the ASD process. Interviews were conducted based on a questionnaire developed using the information gathered from the literaStage 1
Stage 2
Stage 3
Literature Review
Online Survey
Data collection
Prepare interview questionnaire
Results and analysis Face-to-face interviews
Pilot Survey
Prepare online survey
Recommendations and conclusion
Fig. 1 – Process of data collection.
ture survey. The questionnaire was shared with the interviewees before the interviews. Associating the data collected from the interviews and knowledge absorbed from the literature survey, online survey questionnaire was developed. A pilot survey was conducted by sharing the questionnaire with three QA leads working in three different organizations. Each of these three survey participants had more than two years of experience in the ASD process. Findings from these responses and additional feedback on how participants interpreted the questions were used to measure the consistency of the survey questions and ensure that the wording, presentation, length and sequencing of questions were appropriate. The online survey was then shared with 26 software development organizations (listed in Table I), who have at least one project based on the ASD process. Accepted responses were analyzed and the findings were summarized accordingly. Follow-up interview questionnaire was then developed based on the summarized survey findings, to substantiate the research findings and to clarify the doubtful situations. Face-to-face interviews were conducted using the follow-up interview questionnaire along with a summary of research survey findings, to get the subject matter experts’ judgments. 11 experts participated during this stage. They belong to product based and service delivery organizations holding various positions such as handling Scrum-based Agile teams, manage Agile projects in a process team, and working in distributed Scrum teams. 16 metrics were identified during the initial interviews. Out of those, eight metrics (namely, Cost of Quality, Customer Satisfaction Survey, Defect Density, Defect Removal Efficiency, Defect Severity Index, Defect Slippage Rate, Requirement Clarity Index, and Sprint-Level Effort Burndown) were added to the online survey questionnaire, as they were used in more than one company. Three new metrics were also identified during the initial interviews. They are named as Thumbs-up Rule, Non-compliance Index, and Top Hill View. Thumbs-up Rule can be used to measure customer satisfaction at the end of each sprint. Non-compliance Index is used to check a project’s compliance as per their company standards. Top Hill View is used to track the project progress. Those three metrics were also considered in the online survey questionnaire. While Manila [11] discussed about seven metrics, only five of them (namely, Delivery on Time, Fault Correction Time to Closed State, Open Defect Severity Index, Technical Debt, and Unit Test Coverage for the Developed Code) were identified during the initial interviews. Therefore, those five metrics were also included in the online survey. Eight metrics out of the ten metrics mentioned in Downey and Sutherland [2] were also taken into consideration because Scott [16] identified those as useful metrics. Scott also mentioned that those eight metrics (namely, Accuracy of Estimation, Accuracy of Forecast, Focus Factor, Percentage of Adopted Work, Percentage of Found Work, Targeted Value Increase (TVI+), Velocity, and Work Capacity) were used by hyper-productive Agile teams. Net Promoter Score was also considered in the evaluation based on the recommendation given in [17]. B. Data Collection Software development projects based on the ASD process is the population of the research. Product or service oriented,
TABLE I. # 1 2 3 4 5 6 7 8 9 10 11 12 13 14 15 16 17 18 19 20 21 22 23 24 25 26
LIST OF COMPANIES USE FOR THE STUDY. Company Name
99x Technology Ltd Aeturnum Lanka (Pvt) Ltd Aepona Int Lanka (Pvt) Ltd Millenium InformationTechnologies (Pvt) Ltd Content Management and Solutions (Pvt) Ltd Dialog Business Services (Pvt) Ltd Mubasher (Pvt) Ltd (DirecFN) eBuilder Technology Centre (Pvt) Ltd Embla Solutions (Pvt) Ltd Exilesoft (Pvt) Ltd Hemnette Web Solution (Pvt) Ltd hSenid Business Solutions (Pvt) Ltd IFS R and D International (Pvt) Ltd Informatics Holdings Ltd Infosoft Lanka (Pvt) Ltd Innovative-e Pvt Ltd John Keells Computer Services (Pvt) Ltd Leapset (Pvt) Ltd Cambio Healthcare System (Pvt) Ltd Netstarter (Pvt) Ltd Pearson Lanka (Pvt) Ltd Ridgecrest Asia (Pvt) Ltd ShipXpress (Pvt) Ltd Sim Centric Technologies (Pvt) Ltd Virtusa (Pvt) Ltd Zone 24x7 (Pvt) Ltd
small, medium, and large scale software development organizations that have at least one project based on the ASD process was considered for the study. Snowball [15] sampling method was used to identify the potential software development companies in Sri Lanka. 26 organizations listed in Table I were selected to share the online survey. These organizations were members of one or more of the following professional organizations; Sri Lanka Association of Software and Service Companies (SLASSCOM), Sri Lanka Association for Software Industry (SLASI), Software Exporters Association (SEA), and Export Development Board (EDB). While these are international companies, only the Sri Lankan operations were considered in the survey and analysis. See [18] for further details on the survey questioner and data analysis. IV. DATA ANALYSIS While 51 responses were received, three of them were not answered properly. Hence, in the following discussion, we only considered the remaining 48 acceptable responses. This sample covers small, medium, and large scale organizations into service delivery and/or product-based development. When analyzing the ASD methodology practiced by the participants, Scrum Development (SD) process was the most used methodology (see Fig. 2). Out of the common Agile practices followed in the SD process, sprint planning, daily standup, and release planning meetings were conducted by most of the participants. Few participants were also using Analog or Digital task board. 57% of the participants indicated that their teams have 6-12 members. 75% of the participants indicated that their sprints span for two weeks. However, while most of the release plans were scheduled for two weeks (46%), it was not strictly maintained due to the project environment and client requirements; hence, varied between two to six weeks.
TABLE II.
75%
Other ASD processes
Fig. 2 – Practiced ASD methodology.
90% of the responses indicated that they like to use metrics in the ASD process because of their benefitts. Identified benefits include the ability to track the project progress, monitor product quality, and enables better forecaasting and project management. However, a few participants indicated i that they are unable to comprehend the benefits of mettric usage in Agile. This emphasizes that it is not only importantt to identify an appropriate set of metrics that is beneficial to the ASD process, but also the practitioners need to be made awaare of the benefits. Table II shows the ranking of metrics according a to their usage. In all cases of analysis, following resuults stand out: • •
Delivery on time was the most used metric w the least used Targeted Value Increase (TVI+) was metric
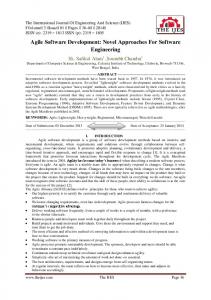
Ten metrics (out of the 22 evaluated) are used by more than 77% of the participants. Six of those metrics are Agile-specific a TSD mytholoand the rest can be used in both the ASD and gies. Agile-specific metrics include Work Capacity, C Adopted Work, Sprint-Level Effort Burndown, Veloccity, Found Work, and Focus Factor. Remaining four metrics innclude Delivery on Time, Unit Test Coverage for the developed code, Bug Correction Time from new-to-closed state, and Opeen Defect Severity Index. Fig. 3 summarizes the metric distribuution based on the software development process. Delivery on Time was the most frequeently used metric. While conducting follow-up interviews with the subject matter experts, they agreed this metric is very impportant to measure both in product based or service delivery orrganizations. Delivery on Time gives a good indication of whhether the scope is being managed or understood. Moreover, it is useful in tracking and predicting a project’s progress. While Unit Test Coverage for the develooped code is a metric used in the TSD process, subject matter experts e also agreed that it is useful in the ASD process too. It contributes to the quality of the code. One of the intervieweees from an ASD process only company mentioned that “we are a using separate tools to automate and run unit tests”. Therefoore, this metric can be used without much of a burden to the Agille team. Open Defect Severity Index metric can be b used to measure the quality of the product in each iteration. For example, an interviewee from an ASD process only company mentioned that they measure it at the end of each spriint. They thrive to maintain zero open defects at the end of eachh sprint. If they had
#
Metric Tittle
1 2 3 4 5 6 7 8 9 10 11 12 13 14 15 16 17 18 19 20 21 22
Delivery on time Work capacity Unit test coverage for the deveeloped code Percentage of adopted work Bug correction time from new--to-closed state Sprint-level effort burndown Velocity Percentage of found work Open defect severity index Focus factor Cost of quality Defect severity index Technical debt Defect slippage rate Customer satisfaction survey Accuracy of estimation Accuracy of forecast Net promoter score Requirements clarity index Defect density Defect removal efficiency Targeted value increase (TVI+ +)
% of Metric Usage 90% 88% 88% 81% 81% 81% 79% 79% 79% 77% 69% 67% 65% 63% 60% 58% 54% 54% 54% 54% 52% 35%
95% 85% 75% 65% 55% 45% 35% 25%
Delivery on time Work Capacity Unit test coverage for the… Percentage of Adopted Work Sprint Level Effort Burndown Bug correction time from new… Velocity Found Work Open Defect Severity Index F Focus FFactor t Cost of Quality Defect Severity Index Technical dept (Design debt or… Defect Slippage Rate Customer Satisfaction Survey Accuracy of Estimation Accuracy of Forecast Net promoter score Requirements Clarity Index Defect Density Defect Removal Efficiency Targeted Value Increase (TVI+)
Scrum m + Customized Scrum m development processses
Metric usage (%)
25%
METRIC DISSTRIBUTION WITH ITS USAGE.
M Metric
Fig. 3 – Metric distribution based on o the development process. Circles – metrics mostly used in the TSD proocess. Diamonds – Metrics most used in the ASD process.
any, they bring it into the sprrint retrospective and discuss to avoid those situations in the futture. Subject matter experts had mixed m ideas about the usefulness of bug correction time from new w-to-closed state metric. A certified scrum master from a produuct development company (practicing ASD process in every project) had mentioned that, “we k of measures as long as the are not concerned about this kind defects are closed”. According to his point of view, this metric focuses more on the individuaal developer. As Agile is more human-centric and encourages growing as a team, this metric does not give any value to thee Agile team. Further, he mentioned that, the metric could be b practiced within the team, if they find a value in using the metric. An interviewee from a
company which have projects based on both the ASD and TSD processes mentioned that “this metric brings value to them and gives an indication on the defect fixing efficiency of the team, which we use for future planning and estimation”. They also use a separate tool to measure the metric, which reduces the burden on the team. 11 of the metrics listed in Table II as used by 52 - 69% of the participants. Four of those metrics, namely Technical Debt (Design or Code Debt), Accuracy of Estimation, Accuracy of Forecast, and Net Promoter Score were identified as Agile specific. The rest was identified as mostly used in the TSD process. Among the 22 metrics considered, Targeted Value Increase (TVI+) was the least used metric. While this is an Agile-specific metric, practitioners believe that it does not add much value to the project or team and it is harder to measure, if the product backlog is not groomed properly. Agile-specific metrics were mostly used by ASD process only companies. All of them used the Sprint-Level Effort Burndown metric. While Defect Density metric had a moderate popularity, as seen in Fig. 4 it is mostly used in companies that practice both the ASD and TSD processes. Selection of this metric seems to be attributed to the developers’ familiarity with the TSD process. Hence, the metric selection tends to differ depending on the process that a company uses, their projects, as well as past experiences of team members. Five of the eight metrics introduced by Downey and Sutherland [2] were used by more than 77% participants. Those metrics include Velocity, Work Capacity, Focus Factor, Percentage of Adopted Work, and Percentage of Found Work. TVI+ metric was the least used. All five customized metrics proposed by Mannila [11] (included in the survey) were frequently used. Those metrics include Bug Correction Time from new-to-closed state, Delivery on Time, Unit Test Coverage for the developed code, Open Defect Severity Index, and Technical Debt. From the metrics that were identified during the initial interviews, only the Sprint-Level Effort Burndown was frequently used.
Metric usage (%)
In certain cases, it was also realized that organizations that adopt both the TSD and ASD process (depending on the project) get overloaded with metrics. For example, a couple of organizations that are transitioning from the TSD to ASD process, have asked their Agile teams to also practice some of 80% 70% 60% 50% 40% 30% 20% 10% 0% ASD process only companies
ASD and TSD process companies
SDLC methodology Fig. 4 – Defect density metric usage in ASD process only companies and ASD and TSD process companies.
TABLE III. #
SUBJECT MATTER EXPERTS’ POINT OF VIEW.
Metric
1
Delivery on Time
2
Targeted Value Increase (TVI+)
3
Unit Test Coverage for the developed code
4
Bug Correction Time from new-to-closed state
5
Open Defect Severity Index
6
Requirement Clarity Index
7
Defect Density
8
Defect Removal Efficiency
Subject Matter Experts’ Point of View Provides a good indication of whether the scope being managed or understood Assist in tracking project progress Useful for future prediction purposes Concern about actual against planned Doesn’t add value to the project or company If product backlog is not groomed properly, metric is hard to measure Contributes to maintain quality of product Reduce the time for re-testing Tool can be used to automate unit test cases Useful in ASD projects Better for pure maintenance of defect fixing project where product backlog is refreshed every time Measure defect fixing efficiency of the development team Used for future planning and estimations Not a problem as long as defect being closed Tends to measure individual than the team Contributes to maintain quality of product Make sure to maintain the “0” count of defects at the end of each sprint Due to high cost of communication, metric does not bring any value Often checked in sprint planning & stand ups Does not concern as long as defects were closed for the sprint Depends on the project type Does not concern as long as defects are closed for the sprint
the well-established TSD metrics such that the performance of Agile teams can be measured in relation to other TSD-based teams in the same organization. This has hindered the use of software metrics, their benefits, and has led to frustrations among the team members. Table III summarizes the subject matter experts’ point of view on a set of metrics selected based on their relevance. It gives an overview of why certain metrics can be used in both the TSD and ASD processes, and why certain metrics are not suitable for a given process. Tools are useful as they simplify the collection and analysis of parameters related to metrics. Hence, there is a correlation between the use of a certain metric and availability of supporting tools. Therefore, we also analyzed the tools used in the ASD process. There is a considerable difference in the tool preference depending on the projects, as well as based on whether a company adopts ASD and/or TSD processes. JIRA/Greenhoper has been the most frequently used tool, where it was used by 28 respondents out of 48. Microsoft Excel was the second most used tool with 23 responses. Organizations where ASD is the primary software development process tend to use Agile-specific tools with Microsoft Excel as a support tool. Whereas companies into both the ASD and TSD
MMARY VI. SUM
Fig. 5 – Recommended metrics to use in the ASD A process. TABLE IV.
METRICS THAT CAN BE MEA ASURE USING JIRA/GREENHOPPER TOOL.
We analyze the usage and benefits b of software metrics, and then propose a suitable set of metrics m to be used within projects based on the ASD process. Ourr analysis extends prior work by considering multiple projects and organizations where some p and other are into both are only into the ASD-based projects the ASD and TSD based projjects. We identified ten recommended metrics to be used in ASD process which focuses on the product quality, team prroductivity, and predictability. Thumbs-up Rule, Non-compliaance Index, and Top-Hill View are among the new metrics idenntified through the study. Use of appropriate, Agile-specific toolls reduces the burden of the data collection. Therefore, a propeer combination of metrics and tools can lead to better products and teams. We are currently in the process of evaluating how the use of metrics correlates to the success or failure of Agile-bbased projects. REFER RENCES
Directly
Indirectly
[1]
Work Capacity Percentage of Adopted Work Sprint-Level Effort Burndown
Focus Factor Open Defect Severrity Index Unit Test Coveragee for the Developed Code Bug Correction Tim me From New-to Closed State
[2]
Velocity Percentage of Found Work
[3] [4]
processes were mostly using Microsoft Exccel as the primary tool with other support tools. It was identified that companies that transitioned from TSD or adapt bothh ASD and TSD processes, try to use the tools that are alreadyy familiar to them, rather than going for new, Agile specific, annd expensive tool. This is one reason that Microsoft Excel is popular p as it is frequently used in projects based on the TSD process. p In certain cases, Bugzila and HP Quality Center werre also used along with the JIRA/Greenhopper. According to exxpert feedback this usually happens due to client requests, and soometimes even due to the lack of knowledge about how to use new n Agile-specific tools. V. RECOMMENDATIONS mes mainstream, it As the Agile development process becom is important to identify a suitable set of softw ware metrics to be used within the ASD process. First 10 metriccs listed in Table II are recommended to be used in most projects based on the ASD process. This list also includes four meetrics derived from the TSD process. As depicted in Fig. 5 theese metrics can be further categorized into three groups as product quality, team productivity, and predictability. These metriccs provide various benefits such as better tracking of project proogress, monitoring product quality, and forecasting and projject management. While other suitable metrics may also be used u based on the project, organization culture, and client requuirements, it is recommended to do a cost-benefit analysis before b introducing them to a given project or a team. While theere is an overhead involved in measuring and using these metrrics, the burden on the Agile team can be reduced with the use u of appropriate tools. It is recommended to use Agile-speccific tools such as JIRA/Greenhopper with supportive tools. Foor example, by using JIRA/Greenhopper metrics listed in Tablle IV can be measured directly and indirectly with minimum buurden on the team.
[5] [6]
[7] [8] [9]
[10]
[11] [12] [13]
[14]
[15]
[16] [17]
[18]
Version One, “The seventh annuual state of Agile development survey,” 2012, Available: http://www.veersionone.com/pdf/7th-Annual-State-ofAgile-Development-Survey.pdf S. Downey and J. Sutherland, “Scrum metrics for hyperproductive teams: How they fly like fighter aircraft,” in Proc. 46th Hawaii Intl. Conf. on System Sciences, Hawaaii, 2013, pp. 4870-4878. S. L. P. Eeger, “Software mettrics: Progress after 25 years?,” IEEE Trans. on Software, vol. 25, 20088, pp. 32-34. M. S. Rawat, A. Mittal, and S. K. K Dubey, “Survey on impact of software metrics on software quality,” Intll. J. of Advanced Computer Science and Applications, vol. 3, no. 1, 2012, pp. 137-141. S. H. Kan, “Metrics and models in software quality engineering,” Bos2 ton, MA: Longman Publishing, 2002. K. V. Siakas, E. Georgiadou, annd E. Berki, “Agile methodologies and software process improvement,”” in Proc. Intl. Virtual Multi Conf. on Computer Science and Informatioon Systems, 2005. B. A. Kitchenham, “Software metrics: Measurement for software process improvement,” NCC Blaackwell, 1996. C. Jones, “Measuring defect poteentials and defect removal efficiency,” J. of Defense Software Engineeringg, vol. 21, no. 6, 2008, pp. 11-13. Y. K. Malaiya and D. Jason, “Esttimating defect density using test coverage,” in Rapport Technique CS-98-104, C Colorado State University, 1998. N. Oza and M. Korkala,, “Lessoons learned in implementing Agile software development metrics,” in Proc. P UK Academy for Information Systems Conf., 2012. J. Mannila, “Key performance indicator in Agile software development,” Satakunta University of Applied Sciences, 2013. J. Gustafsson, “Model of Agile software measurement: A case study,” MSc Thesis, Chalmers Universityy of Technology, Sweden, 2011. K. E. Emam, “A methodology foor validating software product metrics,” Technical Report NRC 44142, National Research Council, Canada, 2002. N Zenker, “Software metrics for Agile M. Kunz, R. R. Dumke, and N. software development,” in. Prooc. 19th IEEE Australian Conference, 2008, pp. 673-678. N. Mack, C. Woodsong, K.M. MacQueen, G. Guest, and E. Namey, “Qualitative research methods: A data collectors field guide,” Family Health International, 2005. Scott. “Rapid Scrum,” Available:: http://www.rapidscrum.com/imagges/Scrum Kick Start Syllabus.pdf Scrum Day Europe, “Agile meetrics: Let the numbers tell the tale,” Available: http://www.scruumdayeurope.com/prowareness/website/ scrumday.nsf/ Agile_Metrics.pdff K. V. J. Padmini, “Use of softwaare metrics in the Agile software development process,” MBA Thesis, University U of Moratuwa, 2014.