ENDANGERED SPECIES RESEARCH Endang Species Res
Vol. 18: 179–191, 2012 doi: 10.3354/esr00445
Published online August 28
OPEN ACCESS
Use of stable isotopes and trace elements to determine harvest composition and wintering assemblages of belugas at a contemporary ecological scale Ève Rioux1, 2, Véronique Lesage1, 2, 3,*, Lianne Postma4, Émilien Pelletier1, Julie Turgeon3, Robert E. A. Stewart4, Gary Stern4, Mike O. Hammill1, 3 1 Maurice Lamontagne Institute, Fisheries and Oceans Canada, Mont-Joli, Québec G5H 3Z4, Canada Institut des Sciences de la Mer de Rimouski, Université du Québec à Rimouski, Rimouski, Québec G5L 3A1, Canada 3 Département de Biologie, Université Laval, Québec, Québec G1V 0A6, Canada 4 Freshwater Institute, Fisheries and Oceans Canada, Winnipeg, Manitoba R3T 2N6, Canada
2
ABSTRACT: Stable isotopes and trace elements reflect interactions between individuals and their environment over shorter periods than genetic tracers and may capture contemporary patterns relevant to stock conservation and management. The endangered eastern Hudson Bay (EHB) belugas Delphinapterus leucas and those from the non-endangered western Hudson Bay (WHB) population are harvested during migration through Hudson Strait (HS), making protection of the endangered stock difficult. We assessed whether chemical tracers of beluga feeding ecology, i.e. carbon and nitrogen isotope ratios and concentrations of 27 trace elements, can help delineate wintering assemblages and successfully define summering stocks and their relative contributions to aboriginal harvests in HS. Skin was obtained from 1032 belugas in 9 regions of Hudson Bay, HS and southeast Baffin Island from 1989 to 2009. Isotopic signatures and trace element concentrations varied regionally and seasonally and suggest that several summering stocks and at least 3 winter assemblages exist. The use of isotopically defined summering stocks as sources in a discriminant function analysis indicates that the endangered EHB belugas account for 20 to 49% of the southern HS fall harvest. Low misclassification rates (≤10%) when using haplotypes unique to, or typical of, EHB belugas as a validation indicate that the isotopic approach is reliable. The analysis combining isotopes with trace elements is promising, although sample size is currently too small to define summering stocks. Spring signatures suggest that Cumberland Sound belugas winter in a separate area and may be differentiated from belugas found elsewhere in southeast Baffin Island, a contemporary pattern relevant to management. KEY WORDS: Stable isotope · Trace element · Beluga · Stock · Arctic · Harvest Resale or republication not permitted without written consent of the publisher
INTRODUCTION An understanding of discontinuities in species distribution is important for effective management and conservation. Resource units, often referred to as stocks, may exist within populations and can usually be managed independently (Ihssen et al. 1981, Stew*Corresponding author. Email:
[email protected]
art 2008, Cope & Punt 2009). However, stocks must be defined over scales relevant to ecological sustainability and population resilience when they are defined from the perspective of human removals (i.e. harvest stocks) (Salt & Walker 2006, Cope & Punt 2009). Several methods have been proposed to define stocks (Ihssen et al. 1981, Stewart 2008), with genetic © Inter-Research 2012 · www.int-res.com
180
Endang Species Res 18: 179–191, 2012
approaches currently being the most popular. Genetics defines stocks over evolutionary scales; this approach is relevant for preserving genetic diversity and reducing risks of extinction of lineages (Palsbøll et al. 2007). However, ancestral patterns may no longer persist under existing conditions or selective exploitation (Harris et al. 2002). Chemical tracers such as stable isotopes and trace elements may complement genetics in respect of stock definition as they assess interactions between individuals and their environment over shorter ecological scales. This can be an individual’s lifetime or a shorter period, depending on tracers and tissue type (Kjellström & Nordberg 1978, Newsome et al. 2010). These approaches assume that animals sharing the same food resources and region have tissues with similar isotopic signatures and/or elemental compositions, as levels of these chemical tracers are strongly related to food ingestion in higher vertebrates, and, to a lesser extent, fish (Langston & Spence 1995, Campbell et al. 2005, Lin et al. 2007, Caut et al. 2009). In the Canadian eastern Arctic, at least 3 populations of beluga Delphinapterus leucas are recognized based on summering areas and mtDNA sequence variation: Cumberland Sound (CS), western Hudson Bay (WHB), and eastern Hudson Bay (EHB) belugas (Brennin et al. 1997, Brown Gladden et al. 1999, De March et al. 2002, De March & Postma 2003, see our Fig. 1). All 3 populations are harvested by Inuit for subsistence, and 2 populations (CS and EHB) are considered endangered by the Committee of the Status of Endangered Wildlife in Canada (COSEWIC 2004). Populations are considered equivalent to stocks, as their definition here is based primarily on the human activity of harvesting. The biological relationship of belugas summering in other areas of the Hudson Bay complex, for example, the north coast of Ontario, James Bay (JB), Hudson Strait (HS), Foxe Basin (FB), Frobisher Bay, Ungava Bay (UB), to the recognized stock, and their seasonal migration patterns, including the location of wintering areas, remain poorly understood (Richard et al. 1990, COSEWIC 2004, Richard 2005). Belugas from EHB and WHB migrate seasonally through HS (Lewis et al. 2009, Luque & Ferguson 2010) where they are harvested by aboriginal communities. HS is a known wintering area for WHB belugas (Luque & Ferguson 2010), but possibly also for belugas from other regions of Hudson Bay and from southeast Baffin Island (MacLaren Marex Inc. 1979, Finley et al. 1982, Luque & Ferguson 2010), but not CS (Stewart 1994, Richard & Stewart 2009). Genetics data indicate the removal of EHB belugas exclusively
from the south shore of HS, and removals of WHB belugas from along both shores (Turgeon et al. 2011), suggesting differences in migratory patterns among stocks. An accurate assessment of removal from the endangered EHB stock, and an understanding of summering, and particularly wintering, assemblages are crucial for meeting conservation objectives and evaluating the degree of mixing among stocks during late winter/spring when mating is expected to occur. Given the physiography of the Arctic Ocean basin, it is unlikely that belugas from the various stocks occupy areas homogenous in food web structure, carbon sources and geology (Powles et al. 2004). Satellite telemetry and survey data also suggest sex and age differences in habitat use and distribution in this species, at least in summer (Michaud 1993, Richard et al. 2001a, Loseto et al. 2006), which might lead to differential access to food resources (Vladykov 1946). The combination of stable isotope and trace element analyses offers an opportunity to gain insights into habitat use, to identify animals likely sharing common wintering areas, and to assess composition of the seasonal harvests in HS, including contributions from the endangered EHB stock to this harvest. Animals that are harvested during the spring/fall migration in HS have recently left their overwintering/ summering areas. With a skin turnover rate of approximately 70 to 75 d in belugas during periods of maximum epidermal proliferation (St. Aubin et al. 1990), skin isotopic signatures primarily reflect diet and habitat use over the last 2 to 3 months. As a result, skin signatures of belugas harvested during the fall and spring in HS should reflect summer and winter feeding, respectively. In this study, skin samples of over 1000 belugas from 9 regions of the Hudson Bay complex were used to characterize wintering assemblages and summering stocks, and to assess their relative contributions to the HS harvest. Our results were compared to those obtained using mtDNA haplotypes unique to, or typical of, the EHB stock (De March & Postma 2003, Turgeon et al. 2011) in indicating the persistence of ancestral patterns.
MATERIALS AND METHODS Sample collection Skin was obtained from 1032 belugas sampled from 1989 to 2009 across 9 regions of the Foxe Basin−Hudson Bay complex, including CS in southeast Baffin Island (Fig. 1, Table S1 in the supplement at www.intres.com/articles/suppl/n018p179_supp.pdf). Sampling
Rioux et al.: Harvest composition and wintering assemblages of belugas
181
deionized water saturated with NaCl (n = 744). Although DMSO affects carbon (δ13C) and nitrogen (δ15N) isotope 68° ratios, lipid extraction preceded by N Baffin Island Repulse Bay water rinsing can restore isotopic sigd Foxe Basin Pangnirtung 66° nature of marine mammal skin, including that of belugas, as if samples had Cumberland NUNAVUT Sound been frozen directly and lipid-extracted 64° Digges Island (Lesage et al. 2010). However, δ15N Hu Kimmirut ds values of cetacean skin are inflated by on Ivujivik Frobisher Str Bay ait lipid extraction by ca. 0.2 ‰ and re62° Salluit quired correction using regressions Kangiqsujuaq Akulivik Labrador Quaqtaq Arviat developed specifically for beluga skin Sea Hudson Puvirnituq Kangirsuk 60° (Lesage et al. 2010). Ungava Bay Aupaluk Bay DMSO-preserved and frozen skin Tasiujaq Inukjuak Kangiqsualujjuaq samples (n = 1032) were lipid-extracted 58° Kuujjuaq prior to isotope analyses following Lesage et al. (2010). Briefly, DMSOUmiujaq Sanikiluaq NUNAVIK 56° preserved samples were rinsed 3 times Belcher Islands (QUEBEC) Kuujjuaraapik in distilled water to eliminate some of MANITOBA +Long Island the DMSO. All samples were then 54° James freeze-dried for 24h and ground to a Bay ONTARIO fine powder before lipid extraction Eastmain River using a mixture of chloroform and + 52° methanol (2:1 v/v) (Folch et al. 1957). After 3 extractions, samples were 94° W 90° 86° 82° 78° 74° 70° 66° 62° dried by evaporation, water rinsed, Fig. 1. Study area with regions and communities where belugas were samdried overnight at 50°C and powdered pled. (×) Belcher Islands; (Z) Cumberland Sound; (M) Eastern Hudson Bay; (d) Foxe Basin; (Q) Hudson Strait North; ( ) Hudson Strait South; (+) James again. A sub-sample of 0.25 to 0.30 mg Bay; (f) Ungava Bay; (j) Western Hudson Bay of this powder was precisely weighed (± 0.005 mg) into a tin capsule and analocations were restricted to core summering areas lyzed for stable carbon and nitrogen isotope ratios where whale abundance is highest to eliminate possiusing an IsoChrom® continuous-flow stable isotope ble ambiguities as to stock affiliation of sampled animass spectrometer coupled to a Carlo Erba elemental mals. Samples came mainly from the aboriginal subanalyzer (CHNS-O EA1108) (Environmental Isotope sistence harvest, with a few biopsies collected when Laboratory, University of Waterloo, Ontario). By conmanipulating animals during satellite telemetry studvention, 13C and 15N isotope abundances are expressed in delta notation (‰), as δX = [(Rsample/ ies. Hunters provided information on harvest date Rstandard) − 1] × 1000 where X is 13C or 15N, and Rsample and sector, and a tooth for age determination from is the corresponding ratio 13C:12C or 15N:14N; Rstandard dentinal growth layer groups (Stewart et al. 2006). represents the ratios for the respective standards, i.e. Sex was determined genetically (92% of cases) Vienna Peedee Belemnite (PDB) and atmospheric (Bérubé & Palsbøll 1996), or in the field. With the exnitrogen (AIR). Replicates using laboratory standards ception of JB belugas, which were sampled excluindicated an analytical error of ± 0.2 and ± 0.3 ‰ for sively in the 2000s, belugas from all of the other reδ13C and δ15N, respectively, whereas the average gions were sampled both in the 1990s and 2000s. deviations observed between replicates of skin samples (n = 102) were 0.1 ‰ for δ13C and 0.2 ‰ for δ15N. Chemical analyses d Igloolik d Hall Beach
Davis Strait
×
Stable isotope ratios
Trace element concentrations
Skin samples were preserved frozen (n = 288) or in a dimethyl sulfoxide (DMSO) solution (20% v/v) of
Trace element concentrations are affected by DMSO in an unpredictable way (Lesage et al. 2010),
Endang Species Res 18: 179–191, 2012
182
and thus were determined from frozen samples only, all of which were also analyzed for isotope ratios. The 288 samples were prepared in the same way as for stable isotope analysis. Approximately 0.08 g of powdered tissue and 6 ml of HNO3 (ultrapure, Seastar Chemical) were transferred to a pre-weighted Teflon reactor (XP-1500 plus) and heated at maximum power for 30 min in a laboratory microwave oven. The use of a closed system improved digestion and the high temperatures ensured that volatile elements were retained. The 27 trace elements (V, Cr, Fe, Ni, Cu, Be, Na, Mg, Al, Ca, Mo, Ag, Cd, Sb, Ba, Tl, Pb, Bi, U, Mn, B, Li, K, Zn, Sn, Se, Ti) were analyzed using an inductively coupled plasma/mass spectrometer (ICP/MS DRC II Perkin Elmer Health Sciences). Precision and accuracy of the method were assessed using certified reference materials (Bovine muscle NIST-8414, Bovine liver NIST-1577b) and duplicate analyses of 60 random skin samples. Detection limits were obtained from samples of low value or blank samples and were 0.001 µg g−1 for all trace elements except Mn and B (0.002 µg g−1), Li and K (0.003 µg g−1), Zn and Sn (0.005 µg g−1), Se (0.007 µg g−1) and Ti (0.009 µg g−1). Concentrations are reported as µg g−1 dry weight.
Data analysis HS was divided into HS south (HSS) and north (HSN) to more adequately reflect the expected differential access of these communities to EHB belugas (Fig. 1). The community of Akulivik was assumed to be part of HSS, given that the harvest occurs mainly in the fall, and likely included beluga from both EHB and other stocks. Summer sampling sites were grouped into 7 summering areas, including those for 3 recognized stocks (EHB, WHB, and CS) and 4 areas occupied by belugas of unknown stock affinity, i.e. Belcher Islands (BI), JB, FB, and UB. When unavailable, sampling location was identified as that of the community reporting the catch because harvest activities generally occurred nearby. Samples with missing sampling location that were obtained from EHB and UB communities after 2000 were excluded from the analysis because these communities were forced to hunt regularly in other regions after that date due to regional allocations and closures. Seasons were defined as spring (15 Apr−7 Jul), summer (15 Jul−7 Sep), and autumn (15 Sep−30 Nov) based on sightings data in HS and summering areas, and seasonal peak harvest periods (MacLaren Marex Inc. 1979, Hammill & Lesage 2009). Too few winter samples (1 Dec−14 Apr) were available to be in-
cluded in the present analysis. Considering the 2 to 3 mo turnover for beluga skin (St. Aubin et al. 1990), spring signatures likely reflect the last few weeks spent in the wintering area and in early migration, whereas summer samples reflect the last part of the spring migration and summer feeding. Fall samples, which are taken approximately from early October to mid-November, also reflect mostly summer feeding, given that the fall migration is rapid, lasting about 10 ± 12 d and beginning around 16 Oct ± 18 d for EHB belugas (Bailleul et al. 2012). The ability to identify summer stocks contributing to the HS fall harvest was examined using discriminant function analyses (DFA), first using stable isotopes alone (i.e. δ13C and δ15N) to maximize sample size, then using a reduced set of individuals with both trace element and isotopic data. A principal components analysis (PCA) with VARIMAX rotation was used to examine correlations and reduce the number of trace element variables to a set of uncorrelated factors for input into the DFA and for statistical analyses. Group-specific probability densities in the DFA were calculated using the k-nearest neighbours non-parametric approach (data not multinormal). The model was iteratively run with different k values to select the one minimizing overall misclassification rate (De March & Postma 2003). Misclassification rates were estimated by cross-validation, i.e. by recomputing discriminant functions (DFs) while leaving out the one observation to be classified. Cutting scores in the classification step were unweighted for differences in sample size among summering groups to reduce the likelihood of misclassifying these endangered belugas as non-EHB animals, the groups with the largest sample sizes (Hair et al. 1995). The DFs defining summering groups were used to assess the origin of belugas harvested in the fall, and estimate relative contributions of the various stocks to the harvests in HSS and HSN. Given that the inclusion of improbable sources may bias modeling results, only the 5 summering stocks most likely contributing to the HS fall harvest were included in the model: BI, EHB, FB, JB and WHB. Animals harvested in UB, i.e. south of 60°N, during summer were excluded as a potential source for the fall harvest because UB is east of the locations where samples were collected during the fall, and the fall migrations generally proceed eastwards (Finley et al. 1982, Smith 2006, Lewis et al. 2009). While belugas may occasionally be seen in HS or other parts of the Hudson Bay complex during summer, they were not considered as potential sources for the fall harvest, given their rarity or low abundance. CS belugas were also
Rioux et al.: Harvest composition and wintering assemblages of belugas
excluded, based on satellite telemetry, Inuit traditional knowledge, and contaminant and isotopic data, which suggest that they remain within this region throughout the year (COSEWIC 2004, De March et al. 2004, Richard & Stewart 2009). Individual assignments based on chemical tracers were compared to those performed using mtDNA haplotypes that are unique to (H17), or typical of (H18), the EHB stock (De March & Postma 2003, Turgeon et al. 2011). Individuals were initially assigned to the summering area with the highest probability of assignment, regardless of its value; thereafter we used probability thresholds of 60 and, for the third analysis, 80%. Insights into wintering assemblages were gained from the comparison of spring harvests in various summering areas, including JB, BI, EHB, UB, and CS. The absence of a spring harvest in WHB and FB prevented the inclusion of these regions in the spring analysis. The SAS programming language (SAS Institute 1990) and R package (R Development Core Team 2009) were used for statistical analyses. Possible temporal trends in isotopic signatures were tested separately for each summer region using simple linear regressions. Variability among regions in seasonal beluga availability (and harvest) resulted in unbalanced designs and precluded the use of 3-way MANOVA or ANOVAs to simultaneously examine effects of season, sex and region on stable isotope ratios and trace element concentrations (as PCA factors). As a result, multiple 1- or 2-way MANOVAs or ANOVAs were used instead to examine regional patterns, while controlling for type I error using a global α = 0.05. Analyses of variance were repeated using ranks when assumptions for parametric tests were violated (Conover 1980). Statistically significant ANOVAs were explored for significant pairwise comparisons using post-hoc Tukey’s studentized range (HSD) tests and α = 0.05.
RESULTS Sex, regional and seasonal variations Stable isotopes None of the summer regions showed a trend in beluga δ13C or δ15N values over the 20 yr of sampling (linear regressions, all p > 0.05). However, isotope ratios varied among regions (2-way ANOVA: F8,1014 = 50.8 and 66.7 for δ13C and δ15N, respectively, both p
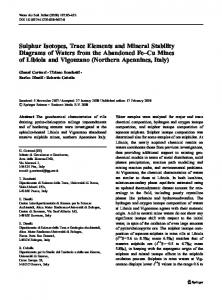
0.05 for all comparisons). Spring isotopic signatures reflect winter habitat use, and varied according to region of harvest (1-way ANOVA on ranks, 6 regions used, all p < 0.001). Belugas were distributed among 3 main clusters, suggesting the existence of at least 3 wintering assemblages (Fig. 3). Male and female belugas harvested in the spring in CS were isotopically different from those harvested in BI, and belugas from these 2 groups segregated isotopically from those harvested at the same time in EHB, HSN, HSS and UB (post-hoc Tukey’s HSD tests, with p = 0.05). JB belugas were intermediate in signature between the 3 groups and close to belugas from BI, but there were too few individuals, one of each sex, to test for their significance as a separate group.
Trace elements A PCA reduced the 27 trace element variables plus δ13C and δ15N values to 9 factors (eigenvalues
Endang Species Res 18: 179–191, 2012
184
17.5
17.2
Male HSN
17.0
CS
Male
CS
17.0 WHB
16.8
FB
16.6
16.5
16.4
BI
15.5
16.2
UB HSS
16.0
JB
16.0
EHB
15.8
JB
EHB
15.6 15.4
15.0
HSS BI
14.5 –19.0 17.0
–18.5
–18.0
–17.5
–17.0
–16.5
Female
δ15N (‰)
15.2
δ15N (‰)
UB
15.0 –18.6 16.8
–18.2
HSN
–17.8
Female
–17.4
–17.0
–16.6
CS
16.6
CS
16.5
16.4 FB WHB HSN
16.0
16.2 16.0
HSN
15.8 JB
15.5 EHB BI
HSS UB
UB
15.4
15.0
15.2 14.5 –20.0
JB
–19.5
–19.0
–18.5
–18.0
δ13N (‰)
–17.5
–17.0
EHB
15.6
–16.5
Fig. 2. Delphinapterus leucas. Mean isotopic signatures (± SD) of male and female belugas harvested in various locations of the eastern Canadian Arctic. BI: Belcher Islands ( ), CS: Cumberland Sound (y), EHB: Eastern Hudson Bay (n), FB: Foxe Basin (s), HSN: Hudson Strait North (q), HSS: Hudson Strait South ( ), JB: James Bay ( ), UB: Ungava Bay (e), WHB: Western Hudson Bay (h)
>1), revealing strong correlations among sets of variables while retaining 76% of variance (Table 1). Patterns in trace element concentrations were observed among regions (MANOVA, F72, 2088 = 9.72, p < 0.0001) and between sexes within regions (sex: F9, 254 = 2.26, p = 0.019). Sex differences came exclusively from Factor 3, which was dominated by stable isotopes. Regional effects were observed for a majority of trace elements (1-way ANOVA, p < 0.0005 for all factors) except those associated with Factors 4 and 9 (i.e. Cu, Sn and Ag). JB and HSS belugas were strikingly different in trace element signatures compared to belugas from other regions. JB belugas, which were all sampled during summer, were characterized by high concentrations of V, Cr, Fe, Mn, Ni, Mo, Na, Al, Li, Ti and the lowest concentrations
15.0 –19.0
BI HSS
–18.5
–18.0
–17.5
δ13N (‰)
–17.0
–16.5
–16.0
Fig. 3. Delphinapterus leucas. Mean isotopic signatures (± SD) of male and female belugas harvested in the spring in various locations. Symbols as in Fig. 2
of Zn and Se, and thus scored high on Factor 2 and Factor 6, and low on Factor 3 compared to other groups (post-hoc comparisons, all significant at p = 0.05) (Table S2 in the supplement at www.intres.com/articles/suppl/n018p179_supp.pdf). Belugas from HSS, which were predominantly (78%) taken in the spring, showed the highest concentrations of Se, Ti, Li and scored high on Factor 6, and had high levels of all 5 elements associated with Factor 1 (U, Tl, Sb, Cd, Be). Belugas harvested in this region are known to come from a mixture of stocks based on genetic data, but their trace element signatures did not resemble any of the summer stocks from Hudson Bay. HSS belugas were most similar isotopically to UB belugas, which comprised an equal mixture of spring and summer samples and scored high on Factors 1 and 6 (post-hoc Tukey’s test, NS). Seasonal effects within regions could not be tested statistically due to small seasonal sample sizes (Table S2).
Rioux et al.: Harvest composition and wintering assemblages of belugas
185
The DFA using 5 nearest neighbors to estimate probability densities and Variable VARIMAX-rotated factor loading define summering groups correctly F1 F2 F3 F4 F5 F6 F7 F8 F9 classified 83% of males and 78% of females to their putative summer Aluminum (Al) − − − − − 0.51 − − − groups (Table 2). Chances of errors Antimony (Sb) 0.95 − − − − − − − − Boron (B) − − − − − − − 0.60 − between classes most likely contributBarium (Ba) − − − − − − − 0.75 − ing to the harvest, i.e. EHB and Beryllium (Be) 0.96 − − − − − − − − WHB&FB were 10% or less, except for Bismuth (Bi) − − − − − − 0.75 − − female WHB&FB which had a 22% Calcium (Ca) − − − − − − –0.43 − − Cadmium (Cd) 0.96 − − − − − − − − chance of being confounded with EHB Chromium (Cr) − 0.90 − − − − − − − belugas. A classification of the HS fall Copper (Cu) − − − 0.94 − − − − − harvest using DFs from summering Iron (Fe) − 0.73 − − − − − − − stocks indicated that EHB accounted Lead (Pb) − − − − − − 0.33 − − for half (49%) of the HSS harvest, or Lithium (Li) − − − − − 0.41 − − − Magnesium (Mg) − − − − 0.89 − − − − 41% males and 60% females (Table 3). Manganese (Mn) − 0.95 − − − − − − − When setting a minimum probability Molybdenum (Mo) − 0.69 − − − − − − − for accepting a classification as EHB, Nickel (Ni) − 0.91 − − − − − − − contributions from this stock decreased Potassium (K) − − − − 0.85 − − − − Selenium (Se) − − − − − 0.63 − − − to 37% (25 and 53% for males and feSilver (Ag) − − − − − − − − 0.88 males, respectively) and 20% (14 and Sodium (Na) − 0.84 − − − − − − − 28% for males and females, respecThallium (Tl) 0.97 − − − − − − − − tively) for threshold probabilities inTin (Sn) − − − 0.93 − − − − − Titanium (Ti) − − − − − 0.74 − − − creasing from 60 to 80%. Uranium (U) 0.97 − − − − − − − − The same approach applied to the Vanadium (V) − 0.53 − − − − − − − HSN fall harvest suggests that the latZinc (Zn) − − 0.41 − − − − − − ter is constituted mostly (30 of 33 ind.) δ13C − − 0.84 − − − − − − of WHB&FB belugas. Raising the δ15N − − 0.82 − − − − − − probability threshold to 60 or 80% for 6.4 4.6 2.3 2.0 1.8 1.4 1.2 1.1 1.0 Eigenvalue acceptance of a beluga as originating % variance 22 16 8 7 6 5 4 4 4 Cumulative 22 38 46 53 59 64 68 72 76 from EHB reduced the EHB stock con% variance tribution to 1 ind. (3%). Several males harvested in the fall in HSN had δ15N values higher than those from any of Stock structure of the HS harvest the summer stocks considered (Fig. 4). Although trends were not as clear for females, values were in The composition of the fall harvest in HS was the upper range of those possible for nitrogen. These first assessed using an isotope-only, sex-specific belugas might have come from a summer area unDFA to determine the discrimination power of isoaccounted for in the analysis. topes alone, while exploiting the larger dataset. A second classification of summering stocks using a Belugas from BI and JB were indistinguishable isoDFA and the reduced dataset with both isotopes and topically (post-hoc pairwise comparisons, all p > trace element variables correctly classified 95% of 0.05 for both isotopes) and thus were combined in cases (n = 82 out of 86) to 1 of 3 summer regions (JB, the DFA analysis and will be referred to as BI&JB. EHB or WHB; sample sizes for BI and FB were too A similar pattern was observed for belugas from small to be included in this analysis) (Table 4). While WHB and FB, which were also combined as the error rate for EHB belugas was substantial (3 of 6 WHB&FB in the DFA analysis. Belugas from EHB EHB belugas being confounded with WHB animals), and those from WHB and FB had similar carbon no beluga from any other group was misclassified as signatures, but the former had depleted δ15N EHB, indicating that EHB contributions to the harvest values compared to WHB and FB belugas and so represent a lower bound. Applying the DFs from sumwere considered as a separate source, resulting in mer groups to the 24 belugas with isotope and trace a 3-source DFA model, i.e. EHB, BI&JB, and element data that were harvested in HS during the WHB&FB (Fig. 4). fall, it was estimated that 8 of 9 belugas in HSS came Table 1. VARIMAX-rotated component analysis factor (F) matrix
Endang Species Res 18: 179–191, 2012
186
18.0
Table 2. Cross-validated classification for summer harvest in various regions of Hudson Bay using linear discrimination functions based on δ13C and δ15N values. EHB: eastern Hudson Bay; BI: Belcher Islands; JB: James Bay; WHB: western Hudson Bay; FB: Foxe Basin; n: no. of individuals
Male
17.5 WHB
17.0
FB
16.5
Sex (n)
Origin
16.0 EHB
BI
15.5
JB
15.0
δ15N (‰)
% classification (n) BI&JB WHB&FB
EHB
14.5 –20 18.0
–19
–18
–17
–16
Female 31 EHB 13 BI&JB 50 WHB&FB
87 (27) 0 (0) 22 (11)
3 (1) 85 (11) 8 (4)
10 (3) 15 (2) 70 (35)
Male 43 25 72
81 (35) 8 (2) 6 (4)
12 (5) 80 (20) 8 (7)
7 (3) 12 (3) 85 (61)
EHB BI&JB WHB&FB
Female
17.5 17.0
Table 3. Contribution of various summering stocks to the Hudson Strait fall harvest as determined from a linear discrimination functions analysis based on δ13C and δ15N values. HSS: Hudson Strait South; HSN: Hudson Strait North; other regions as in Table 2. n: no. of individuals
FB
16.5 WHB
16.0 BI
Region
EHB
15.5 15.0
HSS JB
14.5 –20
HSN –19
–18
–17
–16
Sex
n
Female Male Female Male
61 87 11 22
% classification (n) EHB BI&JB WHB&FB 60 (36) 41 (35) 0 (0) 9 (2)
1 (1) 9 (8) 9 (1) 0 (0)
39 (24) 51 (44) 91 (10) 91 (20)
δ13N (‰) Fig. 4. Delphinapterus leucas. Mean (± SD) carbon and nitrogen isotope ratios for the fall harvest in Hudson Strait South ( ) and Hudson Strait North (q) and for groups summering in various locations of the eastern Canadian Arctic. Symbols as in Fig. 2
from EHB (with one from WHB), whereas 1 of 15 belugas in HSN came from EHB and the rest from WHB.
DISCUSSION Isotope ratios revealed patterns which suggest differences in habitat use among belugas from the same region. Differences were generally small, but males were consistently enriched in 13C and 15N relative to females from the same region, a pattern consistent with that observed for belugas elsewhere (Lesage et al. 2001). Although some of the 13C enrichment of males over females probably relates to their higher δ15N values and trophic positions, it suggests a greater dependency of males either on benthic or nearshore resources (France 1995). In other populations, such as the Beaufort Sea and the St Lawrence
Table 4. Cross-validated classification for summer harvest in various regions of Hudson Bay using linear discrimination functions based on factor scores derived from a principal components analysis using 27 trace elements and δ13C and δ15N values as input variables (regions as in Table 2) Origin
n Other
EHB JB WHB
6 9 72
− 11 (1) −
% classification (n) EHB JB 50 (3) − −
− 89 (8) −
WHB 50 (3) − 100 (72)
Estuary beluga, females and not males appear to be those making greater use of nearshore shallow waters (Michaud 1993, Barber et al. 2001, Loseto et al. 2006), possibly for accrued protection from predators or greater access to food for juveniles with limited diving capacities (Martin et al. 2001). While a sex/age segregation similar to that documented in the Beaufort Sea and the St Lawrence Estuary might exist in Hudson Bay and CS belugas, isotopic data alone were insufficient to identify such a sex/age difference in habitat use in our study.
Rioux et al.: Harvest composition and wintering assemblages of belugas
The naturally occurring markers we examined represent diets, hence different feeding areas, and differences among groups of whales indicate that belugas are occupying, and feeding in, different areas. Carbon isotope ratios were particularly consistent with basin physiography and water mass movements documented in the eastern Arctic (Powles et al. 2004, Saucier et al. 2004). The 13C-depletion of belugas from JB and BI probably resulted from the strong influx of 13C-depleted freshwater into JB, which spills into southeastern Hudson Bay and the BI area. The Foxe Basin–Hudson Bay complex, which includes HS and UB, receives waters of high salinity and likely has food webs that are typically more marine. Accordingly, belugas from these regions had the highest δ13C values. Freshwater inputs are not as strong in the Baffin Bay–Davis Strait ecoregion, leading to intermediate δ13C values in belugas from this area, i.e. CS and HSN. Regional patterns in δ15N values were harder to interpret as they are strongly influenced by diet, local productivity, and regional nitrogen sources and availability (Montoya 2007). A higher productivity has been reported for FB and eastern Baffin Island (CS) compared to Hudson Bay (Powles et al. 2004), possibly contributing to regional differences in δ15N, and to the relative enrichment for belugas from CS and FB. Regions where belugas had the most depleted δ15N values (JB, BI, EHB and UB) were those where freshwater runoffs and riverine inputs of nitrate or ammonia were the most intense (Powles et al. 2004, St-Laurent et al. 2011). Whether observed patterns in beluga δ15N values among regions resulted from the animals’ usage of nitrogen sources with different characteristics or consumption of prey from different trophic positions, or from similar trophic positions but more productive food webs, cannot be determined. Trace elements also contributed to regional differentiation among groups. The relatively high concentrations of several trace elements in JB belugas, including V, Cr, Fe, Mn, Ni, Mo, Na, Al, Li, Ti, probably arose from natural geochemistry as well as from industrial inputs (Loring 1976, Gong et al. 1977). This area receives substantial freshwater discharges from rivers originating in the heavily industrialized part of central Canada, which are in some cases also regulated via hydroelectric dams. Similarly, although we did not statistically examine single elements, the order of magnitude higher levels of cadmium documented in belugas from HSS and UB may have arisen from local geochemistry (Painter et al. 1994, Outridge et al. 1997), as cadmium natural abundance
187
is generally greater in marine ecosystems compared with freshwater and terrestrial environments (Outridge et al. 1994). Several marine mammals from this region also show elevated liver Cd levels (reviewed in Outridge et al. 1994, Wagemann et al. 1996), supporting the existence of a regional source with elevated cadmium concentration, most probably from rivers eroding the Canadian Shield, which is known for its substantial deposits of metals. Geochemistry affects marine mammals through diet, and diets vary in their transfer of elements to the marine mammals. Cadmium strongly bioaccumulates in cephalopods (Bustamante et al. 1998), and also attains high concentrations in squid consumers such as narwhals Monodon monoceros and pilot whales Globicephala melas (Wagemann et al. 1983, Caurant & AmiardTriquet 1995). The absence of high cadmium concentrations in belugas from Hudson Bay, and the fact that most belugas from HSS were sampled in the spring while on their migration back from their wintering areas, suggests that cephalopods may be more important in their diets during winter and while outside of Hudson Bay, than during summer or for those belugas which remain in Hudson Bay year-round. These observations also suggest that the turnover of cadmium and possibly other trace elements in skin is much faster than the 10 to 30 yr established from other tissues (Friberg et al. 1974, Kjellström & Nordberg 1978), emphasizing the usefulness of this tissue as an archive for seasonal habitat use. Two independent studies (Stavros et al. 2007, Bryan et al. 2007) examined trace element concentrations in skin of bottlenose dolphins Tursiops truncatus. Both studies found trace elements in skin a useful tool to monitor dolphin populations, as geographical location appeared to be a more important factor than other biological factors (age, sex) to explain differences in trace element concentrations. In addition, a significant correlation for total mercury in skin and liver of stranded and free-ranging dolphins was recently reported (Stavros et al. 2011), suggesting that skin can be useful in predicting mercury concentrations in the liver of free-ranging dolphins. Such a correlation is also an indication of a fast turnover of mercury and possibly other metals in marine mammal skin. Spring isotopic signatures also provided indications for the existence of at least 3 main wintering areas. One could be located in southern Hudson Bay, as evidenced by the limited seasonal movements documented for JB belugas using satellite telemetry (Bailleul et al. 2012); repeated anecdotal ice entrapments of belugas near the Belcher Islands (Freeman
188
Endang Species Res 18: 179–191, 2012
1967, Richard 1993, Heide-Jørgensen et al. 2002, Lewis et al. 2009); Inuit traditional knowledge studies reporting beluga wintering at the floe edge near the Belchers (Stewart & Lockhart 2005). Although the sample size for JB was small in our study, the similarity of belugas from this region with those from BI is consistent with them overwintering either together or close to each other. The 15N enrichment of belugas sampled in CS during spring relative to those sampled elsewhere in the same period suggests that they occupy a distinct wintering area. The location of this wintering area cannot be ascertained based on isotope ratios, but the body size differences between belugas summering in CS and those known to winter in HS indicate that it is unlikely to be HS (Stewart 1994). The limited satellite telemetry data, and Inuit traditional knowledge suggest instead that it is most probably located near the entrance to the Sound (Richard & Stewart 2009). The similarity in spring isotopic signatures of EHB and UB belugas suggests similarity in the characteristics of their wintering areas. According to recent telemetry data, the main wintering area for EHB belugas is the Labrador Sea, but includes eastern HS off the Ungava Bay (Lewis et al. 2009, Bailleul et al. 2012). Both telemetry and mtDNA data from springsampled belugas suggest that the fraction of the population wintering in HS is small (Turgeon et al. 2011, Bailleul et al. 2012). There is no information on wintering areas for UB belugas. This population, which once numbered several hundreds of animals, was considerably reduced by commercial whaling, and currently numbers less than 100 individuals (DoniolValcroze & Hammill 2012). The large number of belugas reported in UB and in HS during winter (Finley et al. 1982) suggest that this represents a 4th wintering area which is used by at least part of the WHB beluga population, as indicated by satellite telemetry data (Luque & Ferguson 2010). Some individuals from WHB end up in UB as they contribute to the spring harvest there (Turgeon et al. 2011). The absence of a spring harvest in WHB did not allow for the isotopic characterization of this stock and, thus, comparison with belugas wintering elsewhere. Stock structure of the HS harvest A recent study using mtDNA suggested that CS belugas comprise 26 to 32% of the spring harvest in the HS (Turgeon et al. 2011). The depletion of δ15N in spring HSS belugas relative to CS animals, and their similarity to EHB and UB belugas, makes it improbable that CS belugas contribute significantly to the
spring harvest in HSS or UB, although the confidence intervals around mean estimates overlap. There are a number of markers reflecting shorter time scales than genetics which indicate that CS whales do not contribute to HS harvests. Inuit traditional knowledge, satellite telemetry and differences in beluga size between CS, Frobisher Bay and HSN animals all indicate that the CS population is isolated from the HS area (reviewed in De March et al. 2004, see also Kilabuk 1998, Richard & Stewart 2009, Luque & Ferguson 2010). In addition, whales harvested in the spring in CS are clearly different than those harvested in HS at the same time (Stewart 1994, our Fig. 3), indicating separate wintering areas. Successive aerial surveys suggested that Frobisher Bay belugas migrated towards eastern HS and northern UB in the mid-1970s (MacLaren Marex Inc. 1979), and animals from Frobisher Bay are not genetically differentiated from CS belugas (Turgeon et al. 2011). If these migrations still occur, they might explain the detection of CS-type genetic signals in HS (Turgeon et al. 2011, but see De March et al. 2002) and account for the unknown source identified in the fall harvest for HSN. However, summer samples from Frobisher Bay are not available to test the hypothesis of their isotopic similarity with CS animals. Individual assignments based on chemical tracers were compared to those performed using mtDNA haplotypes that are unique (H17) to, or typical (H18) of, the EHB stock (Turgeon et al. 2011). When defining summer stocks based on stable isotope signatures alone, all but one of the 15 individuals bearing the haplotype H17, unique to EHB, were classified as originating from EHB (i.e. 7% error rate). Three of 24 were incorrectly classified when considering only those individuals bearing haplotype H18 that typifies EHB (De March & Postma 2003). In the case of the fall harvest, mtDNA data for the same sample of 148 individuals that were classified based on isotope ratios indicated a contribution of 18% from EHB to the HSS harvest when using probabilistic assignments (EHB vs. non-EHB) based on haplotype relative frequencies (De March et al. 2002, B. G. E. de March & L. D. Postma unpubl. data) and of 23% when using a genetic mixture analysis (Debevec et al. 2000, Turgeon et al. 2011). Our assignment of 20% of the HSS harvest (14% for males and 28% for females) using an 80% threshold probability for assignment is consistent with these estimates. However, misclassification errors were low (