multivitamin supplementation. BMJ. 1993;306:1645â8. 3. Medical Research Council Vitamin Study Research Group. Prevention of neural tube defects: results of ...
The Journal of Nutrition Methodology and Mathematical Modeling
Use of the Affinity/HPLC Method for Quantitative Estimation of Folic Acid in Enriched Cereal-Grain Products1 Rosalia Po´o-Prieto,2,4 David B. Haytowitz,3 Joanne M. Holden,3 Gail Rogers,2 Silvina F. Choumenkovitch,2 Paul F. Jacques,2 and Jacob Selhub2* 2 Vitamin Metabolism Laboratory and Nutritional Epidemiology Program, Jean Mayer USDA Human Nutrition Research Center on Aging, Tufts University, Boston, MA and 3Nutrient Data Laboratory, USDA-ARS, Beltsville Human Nutrition Research Center, Beltsville, MD
In 1998, the United States introduced mandatory fortification of enriched cereal-grain products with folic acid to reduce the incidence of neural tube defects. As a consequence, substantial amounts of folic acid, the synthetic form of folate, were added to the American diet, and the ability to assess folic acid intake took on greater importance. The purpose of the current study was to separate and quantify folic acid and 5-methyltetrahydrofolate, the most prominent naturally occurring folate in fortified foods, with a reliable and robust method. Folates were heat-extracted from food samples. A trienzyme treatment (a-amylase, rat plasma conjugase, and protease) was applied to the extracts followed by purification by affinity chromatography. Folic acid and 5-methyltetrahydrofolate were separated and quantified by reversed-phase HPLC with fluorescence and UV detection. A gradient elution with phosphate buffer and acetonitrile was used to separate the different forms of folates. The method gave a linear response in a range of 0.1–3 mmol/L and 0.0125–0.25 mmol/L for folic acid and 5-methyltetrahydrofolate, respectively. These ranges were similar to the expected levels in the samples. The CV of the peak areas of folic acid and 5-methyltetrahydrofolate for 5 commercial wheat flour samples extracted and run separately on the same day was 2.0 and 5.7% and, run over 5 consecutive days, was 7.2 and 7.3%, respectively. Total folate values in 45 samples of fortified food measured by HPLC and by the traditional microbiological assay demonstrated a high correlation (r2 ¼ 0.986). J. Nutr. 136: 3079–3083, 2006.
Introduction In 1996, the United States Food and Drug Administration (FDA) issued a regulation, effective January 1998, to fortify all enriched cereal-grain products (flour, rice, breads, rolls, buns, pasta, corn grits, corn meal, farina, macaroni, noodle products, etc.) with folic acid (1). The primary reason for this policy was the recognition that periconceptional folate supplementation significantly reduced the incidence of neural tube defects (2,3). A secondary benefit of fortifying foods with folic acid might be a reduction in the incidence of cardiovascular disease (4) and certain types of cancer (5). The amount of folic acid added to different products ranges from 95 to 309 mg/100 g of product. This range of fortification was selected on the basis of a target level of 140 mg of folic acid/ 1 Supported by the NIH through a grant from Office of Dietary Supplements and the National Institute of Diabetes and Digestive and Kidney Diseases (R01 DK058715) and through agreement Y1-HV-8116, and by the USDA, Agricultural Research Service (agreement 58-1950-4-401). Any opinions, findings, conclusion, or recommendations expressed in this publication are those of the author(s) and do not necessarily reflect the view of the USDA. 4 Present address: Dpto. de Nutricio´n, Bromatologı´a y Tecnologı´a de los Alimentos, Universidad San Pablo CEU, Madrid, Spain. * To whom correspondence should be addressed. E-mail: jacob.selhub@tufts. edu.
100 g of the cereal-grain product. Initial estimates by the FDA anticipated an increase in folate intake of between 70 and 130 mg/d in adults depending on age and consumption patterns (6). This projection assumed that each enriched cereal-grain product contained the amount of folic acid required by the applicable regulation. However, actual measurements of total folate content in enriched cereal-grain products previously showed that a considerable proportion of these products contained total folate levels that were higher than the amounts required by regulations. These results could have resulted in part from the addition of excess folic acid to fortified foods to ensure that the product contains at least the minimum amount required by regulation throughout the shelf-life of the product. Another possible explanation for these higher values is the use of improved assay methods, which measure endogenous folate at levels considerably higher than those using older methods (7). With so much more folic acid in the American diet and the uncertainty regarding the amount of natural folate and added folic acid in enriched cereal-grain products, along with the need to explicitly establish the amount of folic acid in these foods to estimate folate intake as Dietary Folate Equivalents (8), it was deemed essential to develop a reliable analytical method to distinguish between folic acid and endogenous folates in enriched cereal-grain products.
0022-3166/06 $8.00 ª 2006 American Society for Nutrition. Manuscript received 23 January 2006. Initial review completed 20 February 2006. Revision accepted 20 September 2006.
3079
Downloaded from jn.nutrition.org by Pamela Pehrsson on December 18, 2006
Abstract
Several chromatographic methods have been used for separation and measurement of folates in food (9). These procedures use different types of clean-up of folates like ion-exchange or affinity columns, different kinds of HPLC techniques, such as ion-pair or reversed-phase, and the most common detection systems used were UV, fluorescence, and electrochemical detection. In this article we describe a method for the quantitative estimate of folic acid and 5-methyltetrahydrofolate (the most abundant form of naturally occurring folate in foods) that combines several procedures, including a modified trienzyme extraction, affinity chromatography, and reversed-phase HPLC with UV and fluorescence detection.
Materials and Methods
Samples. Samples of enriched cereal-grain products and other products fortified with folic acid were obtained from the National Food and Nutrient Analysis Program (NFNAP), an interagency agreement between the NIH and the USDA (11). Samples of one or more brand-name products were collected from retail outlets in 12 cities in the U.S. and shipped to the Food Analysis Laboratory Control Center at Virginia Polytechnic Institute and State University in Blacksburg, Virginia, for preparation and processing. For the present study, samples were collected between April 1999 and November 2003. In most cases, national composites were prepared by brand. For a few items, regional composites were prepared, although not all of the regional composites were analyzed in this study. Aliquots of the composite homogenized samples were delivered, ground and frozen, in tightly sealed glass jars with Teflon-lined lids and were stored in the same conditions. Commercial wheat flour used to determine recovery and precision was purchased from a local supermarket. The amount of folate declared in the label was expressed as percentage of daily value (% DV) per serving of the food, which is 400 mg for folate. This flour had the 10% DV of folate per serving (30 g); therefore, based on the label’s claim, the calculated folate content was 133mg/100 g of product. Enzymes. Rat plasma was obtained from Charles River Laboratories and was used as a source of folate conjugase (12). Endogenous folate in rat plasma was removed by mixing the fresh rat plasma (200 mL) with 10 g of AG 1 3 8 Resin 100–200 mesh chloride form (Bio-Rad) overnight at 4�C. Then, the suspension was centrifuged for 15 min at 3500 xg at 4�C. The supernatant fraction was collected and filtered. Aliquots of filtrate were stored at 220�C until used. a-Amylase from Bacillus sp (Sigma) was dissolved in water at a final concentration of 20 mg protein/mL. Protease (Sigma) was dissolved in water at a final concentration of 2 mg protein/mL. Extraction of folates from fortified food. Samples were thawed and were suspended (1 g/10 mL final volume) in a 0.026 mol/L Tris-HCl extraction buffer (pH 7.4) containing 1% (w:v) sodium ascorbate and 0.02 mCi/L [3H] folic acid tracer (specific activity: 69 Ci/mmol; Movareck Biochemicals). The samples were capped and heated in an autoclave for 15 min at 120�C (1.034 bar), cooled in an ice bath, then homogenized with a polytron homogenizer for 30 s at medium setting (Brinkmann Instruments). The homogenates were subjected to a modification of the trienzyme treatment method of Martin et al. (13). The homogenates were 3080
Po´o-Prieto et al.
Folates purification by affinity column. Sample extracts were applied onto a 0.6 mL (bed volume) folate binding protein (FBP)–Affigel 10 (BioRad Laboratories) affinity columns as previously described (14). The columns were washed sequentially with 5 mL of 1 mol/L potassium phosphate buffer (pH 7.0), 5 mL of water, and 3 mL of water. Bound folates were eluted from the columns with 2.5 mL of 20 mmol/L trifluoracetic containing 10 mmol/L dithioerythritol. The acid eluate was promptly neutralized with 40 mL of 1 mol/L piperazine, and a 50 mL aliquot was used for tritium counting to assess folate recovery. The FBPaffinity columns had a binding capacity .4 mg of folate. Recovery should be at least 78% (15) (if ,78%, too much extract was applied to the column and the procedure was repeated with a lower amount of starting material). A second aliquot (1.8 mL) was injected into the HPLC column for folate analysis. HPLC measurement of folic acid and 5-methyltetrahydrofolate. A reversed-phase gradient HPLC method was performed as a modification of the procedure recently described (16). The folates were separated on an ODS-Hypersil (5 mm, 4.6 3 250 mm i.d.) analytical column (Keystone Scientific). A flow rate of 1 mL/min was used. The mobile phase program consisted of 3 min with 100% A (28 mmol/L dibasic potassium phosphate and 60 mmol/L phosphoric acid in water) followed by a linear gradient of 10 min to 70% A:30% B (28 mmol/L dibasic potassium phosphate and 60 mmol/L phosphoric acid in 200 mL/L acetonitrile and 800 mL/L water). A second linear gradient from 70% A:30% B to 45% A:55% B was then run over the next 17 min, followed by a third linear gradient to 43% A:57% B over the next 15 min. At 45 min, the column was equilibrated for 5 min in the initial conditions and another sample analysis could be initiated immediately. The absorbance of folic acid was monitored with a diode array detector set at 280 nm, and of 5-methyltetrahydrofolate with a fluorescence detector set at 295 nm excitation and 360 nm emission wavelengths. Peak identification was based on a combination of the retention time and the spectral characteristics. Quantification. Quantification was based on an external standard method in which peak areas for both UV (folic acid) and fluorescence (5-methyltetrahydrofolate) were plotted against concentration. Calibration plots using linear regression analysis were prepared for 5-methyltetrahydrofolate and for folic acid. The standard solutions were purified through FBP–Affigel 10 affinity columns, and the calibration curves were prepared from those using similar standard levels as expected in the samples. Both standards and samples were adjusted for tritium folic acid recovery. Microbial assay of total folate. Aliquots of supernatant fractions from extracted food products were also used to measure the total folate contents using a Lactobacillus casei microbial assay using multiple dilutions as described by Horne and Patterson (17) with modifications by Tamura et al. (18). The CV for this assay is 13%.
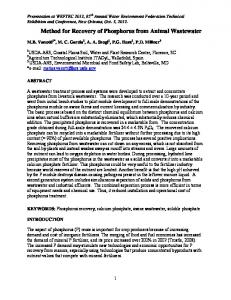
Results Representative chromatograms of 5-methyltetrahydrofolate and folic acid standards are shown in Figure 1 using UV absorption at 280 nm for folic acid determination and fluorescence spectroscopy for the determination of 5-methyltetrahydrofolate. This different modality of spectroscopic detection stems from the high levels of folic acid in fortified foods that allow UV detection. Detection of endogenous folate in these foods, however, was not
Downloaded from jn.nutrition.org by Pamela Pehrsson on December 18, 2006
Standards. Folic acid and 5-methyltetrahydrofolate were obtained from Sigma Chemical. Standard stock solutions were prepared by dissolving folic acid and 5-methyltetrahydrofolate separately in 0.01 mol/L NaOH to a concentration of 20 mmol/L. Concentrations were determined in pH 7.0 buffered solutions, using UV absorption at 280 nm for folic acid and a molar extension coefficient of 27,600 L � mol21 � cm21 and at 290 nm for 5-methyltetrahydrofolate and a molar extension coefficient of 32,000 L � mol21 � cm21 (10). Following spectral determinations, the standard stock solutions were stored in small aliquots in 1% sodium ascorbate at 220�C. These standards were further purified by affinity column chromatography before use (see below).
incubated for 4 h at 37�C with 1.25 mL of a-amylase solution and 0.2 mL of rat plasma folate conjugase. Subsequently, the samples were treated with 1 mL protease for an additional 1 h at 37�C, then heated for 5 min in a boiling water bath, cooled in ice, and centrifuged for 20 min at 36,000 3 g and 4�C. The supernatants were filtered through a microfilter (Millex-AA, 0.8 mm, Millipore) and radioactivity in an aliquot of the sample was measured. If analysis was within 12 h, the filtrates were stored at 4�C until folate analysis. For longer storage, the folate extracts were stored at 220�C until analysis.
TABLE 1
Intra- and interassay CVs and folic acid and 5-methyltetrahydrofolate concentration from commercial wheat flour
Folate form
Folic acid 5-Methyltetrahydrofolate
Intraassay, n ¼ 5
Interassay, n ¼ 5
Mean
CV
Mean
CV
mg/100 g 164.9 5.9
% 2.0 5.7
mg/100 g 150.4 5.7
% 7.2 7.3
Discussion
Figure 1 Chromatograms of commercial wheat flour sample fortified with folic acid at 10% DV of folate per serving. UV detection at 280 nm (A) fluorescence detection at excitation 295 nm and emission 360 nm (B).
Folic acid in enriched cereal grain products
3081
Downloaded from jn.nutrition.org by Pamela Pehrsson on December 18, 2006
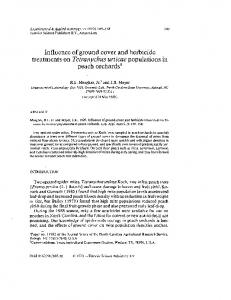
possible under these conditions. According to Pfeiffer et al. (19), endogenous folate content in cereal products amounts to ;0.028 mg/100 g. This value is ;1/5000 of the amount of folic acid in enriched cereal. Because of the limited capacity of the affinity column, the amount of endogenous folate in the purified sample was not sufficient for UV detection. Therefore, we used fluorescence detection, which is more sensitive for measuring 5-methyltetrahydrofolate content. This is the only folate species that can be detected under these conditions. 5-Methyltetrahydrofolate content in grain products ranges from 11 to 35% of total endogenous folate (19). Calibration curves show a linear response (y ¼ 820.41x 1 13.401, r2 ¼ 0.999) for folic acid in a concentration range of 0.1–3 mmol/L at UV detection and also give a linear response (y ¼ 28229x 1 476.83, r2 ¼ 0.988) for 5-methyltetrahydrofolate in a concentration range of 0.0125–0.25 mmol/L at fluorescence detection over the normal working condition range. Net recovery values, using the extraction procedure for commercial wheat flour, spiked with 40 mg/g of folic acid and 0.4 mg/g of 5-methyltetrahydrofolate, were 88.8 6 11.1% and 82.4 6 4.3%, (mean of 3 determinations 6 SD), respectively. Intra- and interassay precision was determined using commercial wheat flour. Intra-assay precision was expressed as the CV of the peak areas of folic acid and 5-methyltetrahydrofolate for 5 flour samples extracted and run separately on the same day. Interassay precision was determined in the same manner as intra-assay precision but the samples of flour were extracted and analyzed over 5 consecutive days. The mean values and CVs for both forms of folate are presented in Table 1. The total folate content of 45 samples of enriched cerealgrain products and other products fortified with folic acid of the NFNAP was assessed by both the affinity/HPLC method and by the L. casei microbial assay (Table 2). The correlation between the HPLC and the microbial assay was quite good (r2 ¼ 0.986, Fig. 2), indicating that one can closely predict the results of one assay with the other. However, the absolute values for the 2 methods do not agree. The HPLC assay values were, on average, 17% higher across the range of total folate values from different foods. Table 2 also displays the folic acid values reported in the USDA National Nutrient Database for Standard Reference 18 (20). For most foods, the reported and measured values were comparable. The notable exceptions to this were rice, corn meal, and corn taco shells, for which the measured values were substantially less than those from the USDA nutrient database.
The mandatory fortification of enriched cereal-grain products with folic acid in 1998 has made folic acid an important source of folate for all segments of the U.S. population and amplified our need to determine the amount of folic acid in the American diet. Direct estimates of folic acid are critical, as previous estimates of folic acid, based on the assumption that enriched cereal-grain products contained the amount of folic acid required by the FDA regulation, appeared to underestimate folic acid intake (21–25). They are also critical for estimating total folate intake as Dietary Folate Equivalents (8). Postfortification measures of folate content for a large number of foods by Rader et al. (7) proved useful, particularly in highlighting the problem of higher-than-anticipated folic acid in the diet (26), but were nevertheless limited. These measures were based on the microbial assay for total folate determination, but could not distinguish folic acid from endogenous folate. Our study describes the use of the affinity/HPLC method for quantitative estimation of folic acid in fortified foods. The method was originally adapted for the quantitative estimation of individual folate forms in both tissue and food products. The advantage of this method is that it is highly specific, and any peak activity emerging from the analytical column, irrespective of whether it is determined by UV absorption, fluorimetry, or electrochemical activity, represents folate activity (14,16). The method is relatively simple and 8–10 samples can be analyzed per day in triplicates. In this study we also determined the amount of endogenous 5-methyltetradyrofolate, which comprises the major form of naturally occurring folate in many foods (27,28). This determination was facilitated because of the fluorescence properties of 5-methyltetrahydrofolate, which allow detection of small quantities of folate. Our data show that the integration of the folic acid and 5-methyltetrahydrofolate values, based on the HPLC method, is highly predictive of the total folate in fortified foods measured by the microbiological assay as denoted by the very high correlation between these 2 methods. Although the values from the HPLC were, on average, 17% higher than those derived from the traditional microbiological assay, the difference was constant across the range of folate values, thus allowing for good prediction. The higher values obtained by the HPLC method is probably a consequence of a small loss of folate in the microbiological assay during the required 24-h incubation period. The high correlation between the microbial assay and the affinity/ HPLC method, combined with the higher observed values for the latter method, suggest that the nonmethylated folates contributed little to the variability of total folate values in these fortified foods. The high amount of folic acid in many fortified foods renders the contribution of the nonmethylated endogenous folate in fortified foods practically negligible. Before fortification, these folates contributed significantly to the overall amount of total folate as indicated when compared with microbial assay values vs. those obtained with the affinity/HPLC method (19).
TABLE 2
Folate vitamers and total folate contents in 45 selected food samples Affinity/HPLC
Product
USDA FA
FA1
MTF1
Total folate2
Total folate microbial
mg DFE 3/100 g product
mg/100 g of product
Ready-to-eat breakfast cereals General Mills Cheerios General Mills Whole Grain Total Kellogg's All Bran Post Raisin Bran Kellogg's Rice Krispies Kellogg's Corn Flakes Kellogg's Froot Loops Post Shredded Wheat Control composites Cake Mixed dish Pasta/rice 1 2 3 4
10.0 58.0 55.0 88.0 24.0 24.0
2.0 25.0
17.7 6 1.4 34.0 6 5.9 22.9 6 3.4 69.2 6 5.8 29.2 6 1.5 38.8 6 1.6 nd 0.6 6 0.2 9.5 6 1.0 nd 250.1 6 16.4 58.4 6 2.8 195.1 6 6.8 70.4 6 1.3 66.5 6 11.2 24.6 6 2.0 85.5 6 5.4 6.8 6 0.5 42.9 6 4.1 49.0 6 2.6 42.4 6 9.2 73.2 6 6.2 85.3 6 9.2 84.6 6 5.7 101.5 6 8.7 130.4 6 13.2 38.3 6 4.1 20.1 6 1.2 28.8 6 1.6 23.2 6 2.4 35.8 6 5.5 2.2 6 0.4 nd 28.2 6 1.2
648.0 1571.0 1269.0 322.0 454.0 446.0 333.0 0.0
709.2 6 24.6 1153.0 6 84.7 1281.5 6 98.4 299.3 6 35.9 411.3 6 48.2 492.1 6 10.4 320.1 6 15.3 nd
219.0 66.0 223.0 55.0 185.0 125.0
44.0
116.0 103.0 142.0
37.0 21.0
31.0 6 1.6 14.8 6 0.3 43.7 6 18.0
1.1 6 0.1 14.0 6 1.1 nd4 nd 22.4 6 1.8 24.1 6 2.2 12.6 6 2.2 1.4 6 0.1 1.0 6 1.5 1.3 6 0.3 18.3 6 3.3 1.3 6 0.2 9.4 6 0.3 3.6 6 0.1 15.2 6 1.9 1.0 6 0.1 28.0 6 2.7 11.5 6 1.5 0.0 6 0.0 nd 6.1 6 0.5 21.0 6 0.2 25.7 6 3.9 5.9 6 0.4 6.9 6 0.6 4.5 6 0.6 27.9 6 4.4 26.3 6 4.5 25.1 6 2.3 5.1 6 1.1 16.7 6 2.4 7.8 6 0.4 23.0 6 0.4 9.2 6 3.1
18.9 47.9 22.9 69.2 51.6 62.9 12.6 2.0 10.5 1.3 268.4 59.8 204.5 74.0 81.7 25.6 113.6 18.3 43.0 49.0 48.4 94.3 111.0 90.5 108.4 134.9 66.2 46.4 53.9 28.3 52.5 10.0 23.0 37.4
14.8 25.1 60.9 81.5 34.0 35.0 11.7 2.9 18.4 3.1 193.4 35.8 238.3 77.1 62.9 23.2 101.8 12.1 37.0 37.1 43.9 108.9 86.4 81.0 75.4 95.9 37.0 20.1 52.7 29.8 31.7 4.2 9.7 34.8
31.3 71.7 38.9 117.6 72.0 90.1 12.6 2.4 17.2 1.3 443.5 100.7 341.1 123.3 128.3 42.8 173.4 23.1 73.0 83.3 78.1 145.5 170.7 149.7 179.4 226.2 93.0 60.5 74.1 44.6 77.6 11.5 23.0 57.1
0.3 1.1 0.1 0.4 0.1 2.2 0.1 0.3
722.1 1160.3 1284.5 304.2 413.5 529.6 323.5 4.3
625.9 1091.5 1055.4 170.1 325.1 422.4 285.5 10.4
1218.5 1967.4 2181.5 513.7 701.4 874.1 547.6 4.3
13.8 6 0.8 7.4 6 0.5 nd
44.7 22.3 43.7
26.4 11.3 36.3
66.4 32.7 74.4
12.8 6 7.2 6 3.0 6 4.9 6 2.2 6 37.5 6 3.4 6 4.3 6
Values are means 6 SD of 3 determinations for HPLC. FA, folic acid; MTF, 5-methyltetrahydrofolate. Sum of the individual vitamers. mg of DFE, dietary folate equivalent, ¼ mg of natural folate (5-methyltetrahydrolate) 1 mg of folic acid 3 1.7. nd, not detectable.
It is difficult to compare the measured amounts of folic acid for foods included in Table 2 with the amount required by regulation because most of the products are mixed products in which flour or bread is one of the ingredients. In addition, not all products in Table 2, such as breakfast cereals and instant oatmeal, fall under 3082
Po´o-Prieto et al.
the regulation for enriched cereal-grain products. However, we did include some of the foods for which the regulation states, in the standard of identity, the amount of folic acid that the food should contain. The regulation requires that bread, rolls, and buns contain 94.8 mg folic acid/100 g whereas our data on folic
Downloaded from jn.nutrition.org by Pamela Pehrsson on December 18, 2006
Cupcakes, chocolate Blueberry muffins English muffins, plain English muffins, plain, toasted Fish sticks, breaded, frozen, raw Fish sticks, breaded, frozen, baked Oatmeal, old fashioned, raw Oatmeal, old fashioned, boiled Oatmeal, quick cooking, raw Oatmeal, quick cooking, boiled Oatmeal, instant, raw Oatmeal, instant, boiled Regular spaghetti, raw Regular spaghetti, cooked Long grain white rice, raw Long grain white rice, cooked Corn meal, yellow, de-germed Taco shells, corn, hard, ready-to-eat Toaster pastries, strawberry, not frosted, raw Toaster pastries, strawberry, not frosted, toasted Doughnuts, cake, plain Bagels, plain, frozen Bagels, plain, frozen, toasted Bagels, plain, fresh Bagels, plain, fresh, toasted Pretzels Grilled chicken sandwich Chocolate cake mix (prepared) Hamburger Chicken sandwich Single hamburger, no cheese, 1/4 lb (0.11 kg) Chicken nuggets Crunchy taco Bean burrito
Total folate
6.
7.
8.
9.
10. 11.
acid content in fresh English muffins and bagels was between 22.9 and 84.6 mg of folic acid/100 g. The regulation requires that macaroni and noodle products contain between 198.4 and 264.6 mg folic acid/100 g, whereas our data on folic acid content in raw spaghetti was 195.1 mg of folic acid/100 g. The regulation requires that rice contains between 154.3 and 308.6 mg folic acid/ 100 g, but our data on folic acid content in raw rice was only 66.5 mg of folic acid/100 g. The regulation requires that corn meal contains between 154.3 and 220.5 mg folic acid/100 g product, but our data on folic acid content in corn meal was only 85.5 mg of folic acid/100 g product. Based on the HPLC method, the measured amount of folic acid in fortified foods tended to be lower than the amount required by regulation. We did not observe the folic acid overages reported in the past (7). We can only speculate on the basis for this difference with earlier findings. Although different methodologies may account for assessing varying amounts of total folate in these products, it is also possible that food manufacturers over time have modified the amount of folic acid added to fortified foods. The samples in which Rader et al. (7) demonstrated overages for many fortified products were purchased between February 1998 and April 1999, shortly after the implementation of folic acid fortification. The availability of the affinity/HPLC method in conjunction with the NFNAP food samples has allowed for the determination of the actual folic acid content of many enriched cereal grain and ready-to-eat cereal products and for the initial development of a database for directly measured folic acid. This database is essential for estimating the dietary intake of folic acid and for determining total folate intake as Dietary Folate Equivalents.
13.
Literature Cited 1.
2. 3.
4.
5.
Food and Drug Administration. Food standards: amendment of standards of identity for enriched grain products to require addition of folic acid. Fed Regist. 1996;61:8781–97. Czeizel AE. Prevention of congenital abnormalities by periconceptional multivitamin supplementation. BMJ. 1993;306:1645–8. Medical Research Council Vitamin Study Research Group. Prevention of neural tube defects: results of the medical research council vitamin study. MRC Vitamin Study Research Group. Lancet. 1991;338:131–7. Boushey CJ, Beresford SA, Omenn GS, Motulsky AG. A quantitative assessment of plasma homocysteine as a risk factor for vascular disease. Probable benefits of increasing folic acid intakes. JAMA. 1995;274: 1049–57. Choi SW, Mason JB. Folate and carcinogenesis: an integrated scheme. J Nutr. 2000;130:129–32.
12.
14. 15.
16.
17.
18.
19.
20.
21.
22.
23.
24.
25. 26.
27.
28.
Folic acid in enriched cereal grain products
3083
Downloaded from jn.nutrition.org by Pamela Pehrsson on December 18, 2006
Figure 2 Comparison of total folate concentration of 45 samples of enriched cereal-grain products and other products fortified with folic acid of the National Food and Nutrient Analysis Program measured with both the affinity/HPLC and L. casei microbial assay.
Food and Drug Administration. Food standards: food labeling: health claims and label statements’ folate and neural tube defects. Fed Regist. 1993;58:53254–95. Rader JI, Weaver CM, Angyal G. Total folate in enriched cereal-grain products in the United States following fortification. Food Chem. 2000;70:275–89. A Report of the Standing Committee on the B Vitamins, and Choline and Subcommittee on Upper Reference Levels of Nutrients. Dietary reference intakes for thiamin, riboflavin, niacin, vitamin B6, folate, vitamin B12, pantothenic acid, biotin, and choline. Washington (DC): National Academies Press; 1998. Hyun TH, Tamura T. Trienzyme extraction in combination with microbiologic assay in food folate analysis: an updated review. Exp Biol Med. 2005;230:444–54. Blakley RL. The biochemistry of folic acid and related pteridines. Amsterdam: North-Holland Publishing; 1969. Pehrsson PR, Haytowitz DB, Holden JM, Perry CR, Beckler DG. USDA’s national food and nutrient analysis program: food sampling. J Food Compos Anal. 2000;13:379–89. Horne DW, Krumdieck CL, Wagner C. Properties of folic acid gammaglutamyl hydrolase (conjugase) in rat bile and plasma. J Nutr. 1981; 111:442–9. Martin JI, Landen WO, Jr., Soliman AG, Eitenmiller RR. Application of a tri-enzyme extraction for total folate determination in foods. J Assoc Off Anal Chem. 1990;73:805–8. Bagley PJ, Selhub J. Analysis of folates using combined affinity and ionpair chromatography. Methods Enzymol. 1997;281:16–25. Ruggeri S, Vahteristo LT, Aguzzi A, Finglas P, Carnovale E. Determination of folate vitamers in food and in Italian reference diet by high-performance liquid chromatography. J Chromatogr A. 1999;855:237–45. Bagley PJ, Selhub J. Analysis of folate form distribution by affinity followed by reversed-phase chromatography with electrical detection. Clin Chem. 2000;46:404–11. Horne DW, Patterson D. Lactobacillus casei microbiological assay of folic acid derivatives in 96-well microtiter plates. Clin Chem. 1988;34: 2357–9. Tamura T, Freeberg LE, Cornwell PE. Inhibition of EDTA of growth of Lactobacillus casei in the folate microbiological assay and its reversal by added manganese or iron. Clin Chem. 1990;36:1993. Pfeiffer CM, Rogers LM, Gregory, 3rd JF. Determination of folate in cereal-grain food products using trienzyme extraction and combined affinity and reversed-phase liquid chromatography. J Agric Food Chem. 1997;45:407–13. USDA National Nutrient Database for Standard Reference. Release 18. Beltsville (MD): U.S. Department of Agriculture, Agricultural Research Service, USDA Nutrient Data Laboratory. 2004 - [cited 2006 July 18]. Available from: http://www.ars.usda.gov/Services/docs.htm?docid¼8964 Choumenkovitch SF, Jacques PF, Nadeau MR, Wilson PW, Rosenberg IH, Selhub J. Folic acid fortification increases red blood cell folate concentrations in the Framingham study. J Nutr. 2001;131:3277–80. Dietrich M, Brown CJ, Block G. The effect of folate fortification of cereal-grain products on blood folate status, dietary folate intake, and dietary folate sources among adult non-supplement users in the United States. J Am Coll Nutr. 2005;24:266–74. Jacques PF, Selhub J, Bostom AG, Wilson PW, Rosenberg IH. The effect of folic acid fortification on plasma folate and total homocysteine concentrations. N Engl J Med. 1999;340:1449–54. Pfeiffer CM, Caudill SP, Gunter EW, Osterloh J, Sampson EJ. Biochemical indicators of B vitamin status in the US population after folic acid fortification: results from the National Health and Nutrition Examination Survey 1999–2000. Am J Clin Nutr. 2005;82:442–50. Quinlivan EP, Gregory, 3rd JF. Effect of food fortification on folic acid intake in the United States. Am J Clin Nutr. 2003;77:221–5. Choumenkovitch SF, Selhub J, Wilson PW, Rader JI, Rosenberg IH, Jacques PF. Folic acid intake from fortification in United States exceeds predictions. J Nutr. 2002;132:2792–8. Finglas PM, Wigertz K, Vahteristo L, Wittho¨ft C, Southon S, de Froidmont-Go¨rtz I. Standardisation of HPLC techniques for the determination of naturally occurring folates in food. Food Chem. 1999;64: 245–55. Doherty RF, Beecher GR. A method for the analysis of natural and synthetic folate in foods. J Agric Food Chem. 2003;51:354–61.