The present investigation was conducted on Erbil wastewater channel to evaluate water quality and pollution strength by using water quality index and oxygen ...
J. Duhok University
Vol.(13) No.(2) 2010
USE OF WATER QUALITY INDEX AND DISSOLVED OXYGEN SATURATION AS INDICATORS OF WATER POLLUTION OF ERBIL WASTEWATER CHANNEL AND GREATER ZAB RIVER. YAHYA A. SHEKHA 1 & JAMAL K. AL-ABAYCHI 2
1 Environmental Science Department, College of Science, University of Salahaddin- Erbil,
Kurdistan Region – Iraq.
2 Biology Department, College of Science, University of Baghdad. Iraq.
ABSTRACT The present investigation was conducted on Erbil wastewater channel to evaluate water quality and pollution strength by using water quality index and oxygen saturation percentage. Seven sites were chosen for the present survey, three of them were within Erbil wastewater channel and the other four sites located in Greater Zab River. Water samples were collected at regular monthly interval periods beginning at May 2006 to April 2007. Some water parameters were analyzed in both water ecosystems including, water temperature, pH, EC, turbidity, DO, BOD5, COD, NH4, NO2, NO3, and total dissolved phosphate. Water quality index was varied from 47, 53.7 to 55.4% for Erbil wastewater channel sites respectively, which classified as bad to medium type of water or as marginal type of water, while for Greater Zab River sites was varied from 71.8% at site 4 then decreased to 68% at site 5 and increased gradually from 71.1 and 71.3% at last two sites of river respectively, which classified as medium to good type according to European Union classification and as fair type water depending on Canadian classification. The variation of oxygen saturation appeared to be directly proportional to the water quality index.
KEY WORDS: Water quality index, Dissolved oxygen saturation, Water pollution.
with the importance of the parameter as an indicator of water quality (Nives, 1999). Dissolved oxygen (DO) and Oxygen saturation (OS %) are parameters frequently used to evaluate the water quality on different water bodies. These parameters are strongly influenced by a combination of physical, chemical, and biological characteristics of stream of oxygen demanding substances, including algal biomass, dissolved organic matter, ammonia, volatile suspended solids, and sediment oxygen demand (Mullholand et al., 2005). The objective of the present work was to the use of WQI and OS % as indicators of the environmental quality of Erbil wastewater channel and Greater Zab River watershed to compare between both water bodies. For the determination of the WQI, Canadian standard (4) as shown in (Table, 1) and European Standard (EU, 1975) as shown in (Table, 2), for clean water were used as references in each case.
INTRODUCTION
of surface waters is a very sensitive issue. Quality Anthropogenic influences as well as natural processes degrade surface waters and impair their use for drinking, industry, agriculture, recreation and other purposes(Simeonov et al., 2003). A water quality index has been considered as an important criterion for surface water classification (Hernandez-Romero et al., 2004). (Jonnalagadda and Mhere, 2001) Showed that this index provides a single number of that expresses overall water quality at a certain location and time based on several water quality monitoring. An index is a useful tool for describing the state of water column, sediments and aquatic life and for ranking the suitability of water for use by humans, aquatic life, wildlife, etc.( CCME, 2001). The determination of WQI requires a normalization step where each parameter is transformed into a 0- 100 scale, where 100 represents the maximum quality. The next step is to apply a weighting factor in accordance Cited from PhD Dissertation
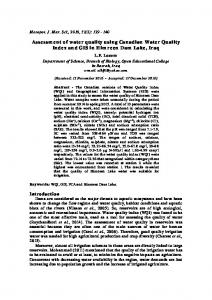
village, Unkown , Kaparan village and Guwer subdistrict respectively) (Figure, 1). Field determinations of pH, conductivity, and temperature were carried out using portable equipments pH meter (Philips PW 9414) and conductivity meter (Philips PW 9525) respectively. Turbidity by using turbidity meter (HF Scientific, inc. model BRF- 15 CE). Laboratory analyses were carried out for the determination of BOD5, COD, NH4, NO2, NO3 according
MATERIALS AND METHODS
Sampling for water variables was performed from seven sites at monthly intervals during May 2006 to April 2007. Three sites have been chosen along Erbil wastewater channel (Tooraq village, Qadria village and Gameshtapa bridge respectively) and four sites selected in distal part of Greater Zab River ( Near Gameshtapa
1
J. Duhok University
Vol.(13) No.(2) 2010 (Dodson et al., 1998). Moreover, the values of BOD5 and COD decreased from (89.3 to 38.3 mg.l-1) and (474 to 192 mg.l-1) respectively, accompanied by an increase of DO level, as an indication of relatively self-purification (Hynes, 1960). According to (EU, 1975) the water can be classified as bad for site 1 and as medium for site 2 and 3, while depending on (CCME, 2001) classification, all sites were regarded as poor or marginal type (Grade D). That was considered as impaired water, condition often depart from natural or desirable levels. On the other hand, the water quality improved considerably downstream of Greater Zab River, the values of WQI were 71.8% in site 4 then decreased to 68% in site 5 which coincided with effluent from Erbil wastewater channel, then increased to 71.1% and 71.3% respectively (Figure 5). Taking into account all the points sampled, the water from Greater Zab River may be classified as fair (Grade C) depending of the classification of (CCME, 2001), meanwhile according to (EU, 1975) classification the water of site 4 can be regarded as good to medium in site 5 then good in sites 6 and 7. The water quality index increased through the sampling sites 4-7, showing a certain self-purification capacity of Greater Zab River (Figure 5). The variation of OS % appeared to be directly proportional to the WQI, the maximum value being at site 3 in Erbil wastewater channel and in site 7 in Greater Zab River. However, the values of OS% improved the above results in which the OS value in site 4 was 73.74% decreased to 71.48% then increased to 74.14% and 81.33% respectively (Table 4). According to (Key, 1956) based on OS% content the water quality of polluted channel was regarded as badly polluted, while Greater Zab River can be classified as doubtful for all sites except site 7 that was considered as a fair type. (Klein, 1959) Stated that OS % levels below 60-80% can be harmful to many aquatic animals. Generally, there is directly proportional relationship between water organic matter load with OS% in water bodies. Therefore, WQI well be affected by increasing and decreasing of OS%.
to methods described in (APHA, 1998). While for total dissolved phosphate (TDP) as recommended in (Lind, 1979) and total dissolved nitrogen as described in (Mackereth et al., 1978). As well as, dissolved oxygen concentration (DO) was determined using azid modification of winkler method as described in (APHA, 1998), and oxygen saturation calculated from the following formula:
Where: C = dissolved oxygen concentration obtain from laboratory analysis. Cs= saturation concentration of pure water at a similar temperature and pressure. For the determination of water quality index (WQI), the following empirical equation was used (Sanchez et al., 2007):
Where: K= is a subjective constant, Ci= is the normalized value of the parameter Pi= is the relative weight assigned to each parameter. Table (3) shows the values suggested for parameters Ci and Pi, used in the calculation of WQI, which were based on European Union standards (EU, 1975).
RESULTS AND DISCUSSION
In order to evaluate the feasibility of the WQI and oxygen saturation (OS %) as an indicator of water pollution level in water sample analyzed the values of these parameters were determined in the different sampling sites. Figures 2-5 show, the plots of the variation of WQI and OS % values for both studied water ecosystems. The values of WQI increased throughout the Erbil wastewater channel from 47 to 53.7 then to 55.4% respectively which was coincided with the increase in OS % from 7.8 % to 27 % then to 43.2% respectively. The reason of this result was related to the characteristics of the polluted channel. As can be seen, the mean values of EC decreased from site 1 to site 3. Also, ammonium concentration decreased, while the concentration of NO3 increased in site 2 but decreased in site 3 (Table, 4), which showing that the nitrification process took place
2
J. Duhok University
Vol.(13) No.(2) 2010
Table (1): Grading scale and rationale used for the all Water Quality indicators (WQI), (4): Indicator (100- point scale) 95- 100 80- 94 65- 79 45- 64 0-44
Ecological condition Excellent: water quality is protected with virtual absence of threat or impairment; conditions very close to natural or pristine levels Good: water quality is protected with only minor degree of threat or impairment; conditions rarely depart from natural or desirable levels Fair: water quality is usually protected but occasionally threatened or impaired; conditions some-times depart from natural or desirable levels Poor (marginal): water quality is frequently threatened or impaired; conditions often depart from natural or desirable levels Very Poor: water quality is almost always threatened or impaired; conditions usually depart from natural or desirable levels
Grade point 4
Grade
3
B
2
C
1
D
0
F
A
Note: Canadian water quality guidelines for the protection of aquatic life ( After Canadian Council of Ministers of the Environment, 2001)
Table (2): WQI values according to European standard (7). Range
Quality
0-25
Very Bad
25-50
Bad
51-70
Medium
71-90
Good
91-100
Excellent
Note: European Union (1975).
Table (3): Values of Ci and Pi for different parameters of water quality. Parameter
Pi 100
pH EC Turbidity NH4 NO2 NO3 TDP COD BOD5 DO T (°C)
1 2 4 3 2 2 1 3 3 4 1
7