well-child care programme. The measurements were made by nursing staff, who reported that the additional work involved did not add significantly to the patient ...
Bulletin of the World Health Organization, 63 (6): 1137-1140 (1985)
Li
World Health Organization 1985
Use of growth charts as a simple epidemiological monitoring system of nutritional status of children T. H. TULCHINSKY,' C. ACKER, K. EL MALKI, R. S. SOCOLAR,4 & A. RESHEF5 Community monitoring of the nutritional status of children has hitherto involvedfield surveys and lengthy computer analysis. These procedures are complex and cannot always be carried out on a routine basis. In addition, they do not provide immediate feedback or longitudinal information on the population under surveillance. This study describes a simple, universally applicable community survey system for monitoring the growth of infants and children that affords both cross-sectional and longitudinal data. A widely accepted method of assessing the nutritional status of children consists in recording anthropometric data such as height, weight, and head circumference at regular intervals and then comparing plots of weight-for-height obtained from these data with internationally accepted growth standards (1, 2). However, there is a need for a method of carrying out nutritional surveillance that is inexpensive, easy to perform, and capable of providing immediate feedback (3). This study describes such an approach to the nutritional surveillance of children attending routine maternal and child care clinics. The method uses a standard set of wall charts on which anthropometric data are recorded for each child who visits the health centre as part of routine preventive care (4, 5). The method facilitates the rapid and easily assimilable display of the nutritional status of the individual child relative to his cohort in the community, as well as to the reference growth curves. (see Fig. 1 and 2). Such information provides immediate feedback to the staff of child welfare clinics, in contrast to other approaches used to analyse anthropometric data (6, 7). The method therefore represents an important tool for use in community diagnosis and health education. The West Bank has a population of 767 300 (1983 figures) living in 10 urban areas and 450 villages spread throughout an area of 5600 km2 and is served by 106 maternal and child health centres (90 government run and 16 run by the United Nations Director of Personal and Community Preventive Health Services, Ministry of Health, 2 Ben Tabai Street, Jerusalem 91010, Israel. Author to whom requests for reprints should be sent. 2 Chief Nursing Supervisor, Health Department, West Bank. 3Chief Nurse, Public Health Service, West Bank. 4 Intern, Children's Hospital of Philadelphia, Philadelphia, PA, USA. 5Director, Nutrition Department, Ministry of Health, Israel.
4625
Relief Works Agency) and 148 government community clinics. Villages with no maternal and child health centre or community clinic are visited by public health immunization teams every 6 weeks. For villages with a maternal and child health centre, immunization and child growth monitoring are carried out in this centre. The overall immunization coverage of infants is greater than 90'7o in the West Bank. MATERIALS AND METHODS
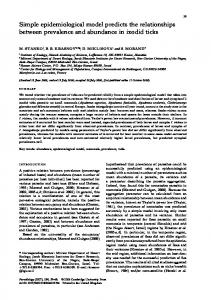
A field trial of the community nutritional surveillance method described here was undertaken between June 1983 and January 1984 in 36 maternal and child health centres in towns and villages in three districts of the West Bank. Approximately 4800 observations were carried out on children aged 0-2 years who attended 16 such centres in Tulkarm district, 16 centres in Jenin district, and 4 centres in Ramalla district. The nursing staff at the centres were told how to obtain and record height-for-age, weight-for-age, head-circumference-for-age, and weight-for-height measurements. At each well-baby clinic, anthropometric data were recorded from each of the children on a common set of National Center for Health Statistics/Centers for Disease Control (NCHS/CDC) reference growth curves (Fig. I and 2). The age of each child was determined from the health records. Nurses were instructed to record approximately 100 observations on each chart for both males and females. These curves were then collected and reviewed by the study group to assess the feasibility, ease of application, and utility of the method as a routine procedure in maternal and child health clinics, as well as to assess the validity of the standard measurements
-1137-
1138
H. TULCHINSKY ET AL. I~~~~~~~~.
1138
used for the study population. The data obtained
Ags (wnks)
were analysed to reveal the number and proportion of
children in each of the following categories: below the 10th percentile, between the 10th and the 49th percentiles, between the 50th and the 89th percentiles, and above the 90th percentile for each of the observations
(i.e., head-circumference-for-age, height-for-age, weight-for-age, and weight-for-height). In addition, the total population was categorized by sex and age and these subgroups were analysed.
52
so
52
Hoid-
circurnforeno
so
E
i
40 38
.........
............
34
RESU LTS
32
The results of the field trial indicated that the method was efficacious as an adjunct to the routine well-child care programme. The measurements were made by nursing staff, who reported that the additional work involved did not add significantly to the patient care time during routine well-child care clinics. The staff also reported that the group surveillance technique of child growth patterns provided an opportunity to explain to the mother the nutritional status of her child relative to that of other
.
............ ...
.....
.............
9 ............
I
................ -,
7
7
.
.........
wow 4
3
.............. ..........
.................
2
Long.th (cmn)
.50 .00
'5 70
Fig. 2. Growth curves for boys aged 0-2 years. The curves show head circumference and weight plotted against length.
I I 6 13
:12 11
:10 I:6
37
Fig.
1.
curves
against
Growth show age.
curves
length
Aps
(weeks)
for
boys aged 0-2 years. The weight-for-height plotted
and
children in the community as well as to an international standard. Supervisory nursing personnel saw the method as a way of emphasizing the importance of accurate weight and height recording for the individual child and as a method of monitoring the effectiveness of the maternal and child health programme in nutrition education. They also reported that the child growth charts provided a quick and effective method of analysing the growth pattern of children in the care of the local maternal and child health centres. In some of these centres, the observed growth patterns were consistent with the standard growth curves during the entire first year of life (see Fig. 1 and 2). Other centres recorded observations that fitted the standard data during the first 6 months of life but thereafter tended to level off towards the lower percentiles of the standard growth curves.
GROWTH CHARTS FOR NUTRITIONAL STATUS OF CHILDREN DISCUSSION
The method outlined here is straightforward and enables rapid identification of nutritional problems in infants or young children in a particular community or district. Previously described child nutrition survey methods using anthropometric data lack widespread applicability and immediate visual feedback because of their complex survey methods and data processing (1, 3). The method described is practical and does not add significantly to the time health personnel spend with patients. In addition, it provides the staff of maternal and child health centres with a visual means of demonstrating to mothers the nutritional status of their own children with respect to an accepted international standard as well as relative to other children in the community. Caution must be applied in interpreting the results obtained using this method compared to those obtained using more sophisticated prevalence studies. The growth chart method is a community surveillance tool, not an absolute prevalence study method. In order to prevent overrepresentation of children who visit the centre frequently because of intercurrent illness or any other reason, measurements are limited to the routine visits of well children for immunization and routine growth monitoring. Some of the child growth patterns recorded follow the NCHS curves; others exhibit a plateau in the
1139
second 6 months of life, probably owing to inadequate or delayed introduction of supplementary solid foods. Thus, the community nutrition surveillance method serves to highlight specific areas or communities where there is a need for intensive maternal education on infant feeding practices. The approach described here uses growth as a measure of nutritional status and does not consider various related factors such as intake of food, intercurrent infections, socioeconomic status, or weight at birth. Instead, the method summarizes the community nutritional status of infants and children and monitors their growth relative to an acceptable international standard (7-9). In addition, it facilitates identification of communities and age groups that vary in their nutritional growth patterns from those of the overall region, permits easy identification of groups at risk of malnutrition, and provides a monitoring system for maternal and child health programmes (10, 11). The basic method is now utilized for in-service instruction of local nursing personnel and for routine monitoring of child growth in maternal and child health centres in the West Bank. Areas or regions identified by means of this system as being at risk of nutritional deficiency will be the focus of intervention efforts in community health education. Further refinements of the method are also being implemented, including differentiation between groups such as breast-fed and non-breast-fed infants.
ACKNOWLEDGEMENTS We wish to thank the public health nursing supervisors and the nursing staff of the maternal and child health centres of the West Bank for their enthusiastic cooperation in this field trial.
RESUME UTILISATION DE COURBES DE CROISSANCE COMME SYSTEME EPIDEMIOLOGIQUE SIMPLE DE CONTROLE DE L'STAT NUTRITIONNEL DES ENFANTS
Le controle de la croissance des enfants est depuis longtemps considere comme un des elements cle de la sante maternelle et infantile. Ce contr6le comprend des mesures bien precises: poids, taille et circonference cranienne en rapport avec l'age, et rapport poids-taille. Le National Center for Health Statistics (NCHS) des Etats-Unis d'Amerique a mis au point des normes, acceptees par la communaute internationale, de developpement de l'enfant qui sont maintenant considerees comme representant son potentiel de developpement dans des conditions normales de sante et de nutrition, et ceci quelle que soit son origine
ethnique. Jusqu'a maintenant, le controle de la croissance d'une population d'enfants a et effectue en utilisant des methodes
d'enquete complexes, tres sophistiqu6es, et le traitement par ordinateur des donnees, moyens dont on dispose rarement sur le terrain, meme dans les pays les plus developpes. 11 en resulte que le contr6le de routine des populations d'enfants n'est pas largement repandu. Cette etude decrit un essai sur le terrain d'un systeme simple, applicable partout, de contr6le de la croissance et du developpement des nouveau-nes et des enfants a l'echelon de la communaute. Une analyse transversale et longitudinale est possible car les observations anthropometriques faites sur les enfants le sont a des ages donnes et les memes enfants sont contr6les regulierement a l'occasion d'un calendrier de vaccination determine. La methode a et mise au point et essayee dans les centres de sante maternelle et
1140
T. H. TULCHINSKY ET AL.
infantile de la Rive occidentale ou 90% de la population infantile locale est suivie pour les vaccinations de routine. La methode est simple, peu couteuse et fournit immediatement une information visuelle. De plus elle permet, pour un enfant donne, de comparer son etat a celui des
autres enfants de la communaute et de le situer par rapport aux normes de croissance souhaitables. La methode est un instrument de travail valable maintenant applique dans les 110 centres de sante maternelle et infantile de la Rive occidentale.
REFERENCES 1. WHO Technical Report Series No. 593, 1976 (Methodology of nutritional surveillance: report of a Joint FAO/UNICEF/WHO Expert Committee). 2. GRAITCER, P. L. & CRENTRY, E. M. Measuring children: one reference for all. Lancet, 2: 297-299 (1981). 3. MASON, J. B. & MITCHELL, J. T. Nutritional surveillance. Bulletin of the World Health Organization, 61: 745-755 (1983). Resources Health Charts. Growth 4. NCHS Administration, Serial No. HRA-76-1120, 25, 3. Rockville, MD, USA, 1976. 5. WATERLOW, J. C. ET AL. The presentation and use of height and weight data for comparing the nutritional status of groups of children under the age of 10 years. Bulletin of the World Health Organization, 55: 489-498 (1977). 6. HABICHT, J. -P. ET AL. Height and weight standards for preschool children: how relevant are ethnic differences in growth potential? Lancet, 1: 611-615 (1974).
7. Measuring change in nutritional status. Guidelines for assessing the nutritional impact of supplementary feeding programmes for vulnerable groups. Geneva, World Health Organization, 1983. 8. WHO Technical Report Series No. 477, 1971. (Joint FAO/WHO Expert Committee on Nutrition: eighth report). 9. WATERLOW, J. C. Note on the assessment and classification of protein-energy malnutrition in children. Lancet, 1: 87-89 (1973). 10. Arab Republic of Egypt Nutrition Status Survey, 1978. Washington, DC, Office of Nutrition, Development Support Bureau, Agency for International Development. 11. BRINK, E. W. ET AL. The Egyptian National Nutrition Survey, 1978. Bulletin of the World Health Organization, 61: 853-860 (1983).