ELECTRONICS AND ELECTRICAL ENGINEERING ISSN 1392 – 1215
2010. No. 4(100) ELEKTRONIKA IR ELEKTROTECHNIKA TELECOMMUNICATIONS ENGINEERING
T 180 ──────────────────────── TELEKOMUNIKACIJŲ INŽINERIJA
User Access Link Impact on Web Browsing Quality A. Kajackas, A. Šaltis, A. Vindašius Telecommunications Engineering Department, Vilnius Gediminas Technical University, Naugarduko str. 41, LT-03227 Vilnius, Lithuania, e-mails:
[email protected],
[email protected],
[email protected] simple Web browsing experience indicates that content value and page opening time are two things of major importance to the user. Web page download delay depends on user’s estimate of the size and page processing time. Graphical elements make pages to open slowly, which might be acceptable on an index pages viewed for the first time, but not on navigational pages. If a user is interested in the content, he will likely spend more time there compared to other pages in the session. The time spent on a page is a good measure of the user’s interest in that page, providing an implicit rating for it [3]. An important observation in perceived Web browsing quality modeling is the fact, that the expected maximal session time will dominate the perceived quality [4]. Perceived Web browsing quality evaluation often is based on Opinion Model for Web-browsing Application, proposed by ITU [4]. This model suggests relating user perceived quality under MOS (Mean Opinion Score) scale with service processing time – weighted session time Tsw, by applying regression line (1). Rules of Tsw calculation are described in [4].
Introduction Many telecommunication services, including Web browsing, currently are provided to users over cellular networks. It is natural to mobile networks that throughput and quality varies depending on user location and time. Therefore, the time to locate and download a Web page with a browser application is also variable together with quality of service perceived by user. Users seek for trusted connections to be sure they can rely upon connectivity service of high importance Web operations such as online banking and shopping. However, customer premise equipment is not capable of keeping track of objective data which allows evaluating perceived quality of service [1]. It is justifiable, since the precise estimation of online service quality is a problem difficult to solve – a service has many interdependent quality attributes influenced by several contextual factors. This work presents analysis of Web browsing service – one of the major internet services today. Web browsing traffic makes 50 – 70 % of all HTTP traffic in today’s internet networks [2]. Web browsing quality is related to user access technology characteristics. This paper analyzes the possibility to develop a method of user perceived quality of service estimation and to create impartial monitoring system for user perceived quality tracking. We also propose passive method for user perceived quality estimation, which allows evaluating if actual quality of service achieved by network meets the quality declared by operator, and allows discovering if it is degraded.
MOS = A − H ⋅ ln Tsw .
(1)
This ITU methodology of Web browsing quality evaluation is applicable directly to Web page and specialized quality evaluation tool development, when special dedicated Web pages are used for browsing quality evaluation. In reality, every Web page is represented by different data volume and thus page download times are different. Therefore, measured session time is not a suitable characteristic for user perceived quality evaluation, because session time depends not only on link conditions, but also on particular Web page characteristics. This way, methodology described in [4] cannot be applied directly to Web browsing quality evaluation, because expected session time is unknown. However, this idea is a clear guideline for developing other methods. Most important factors, influencing session time, is the size of HTML object, server processing and transfer delays. Session time noticeably depends on transfer link
Perceived Quality of Web Browsing General issues on Web browsing quality have been discussed in many works [1-4]. The Web browsing model is bidirectional and differentiates between user requests and responses. Single Web session can be divided into several phases. Browsing process starts when user requests a Web page, whereas server responds with a data packet burst. User needs reading time between Web page loadings. Therefore, single browsing session can contain many alternating download and idle periods. Research and 59
throughput. Session time is also stretched by bottlenecks – low throughput links in the transmission path. 3G and 3.5G technologies have become very popular recently. Real throughput of such access technologies reaches several Mb/s. High throughput determines good Web browsing quality, however in some places 3G network is not available and user is switched to GPRS/EDGE network. This way throughput offered by cellular network degrades and becomes significant bottleneck of the transmission link. This paper proposes a method to evaluate if user perceived Web browsing quality fits the network characteristics, declared by operator. If perceived quality is impaired, the degree of impairment is determined. The throughput of access link can be expressed as:
B = B dec − ∆B ,
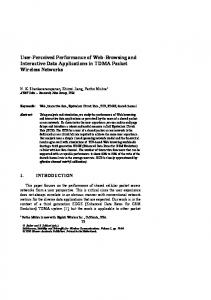
known data blocks. Throughput then is calculated dividing transferred data volume by transmission time. Unfortunately, active measurements are not suitable for real-time user perceived quality evaluation. While searching for passive access link throughput measurement methodology, it is worth noticing that this task is similar to bottleneck bandwidth measuring problem [7, 8]. The bottleneck bandwidth sets the upper limit on how quickly the network can deliver the sender’s data to the receiver. Thus, available bandwidth never exceeds bottleneck bandwidth. Passive Web Browsing Monitor Web page retrieval, simply called Web browsing, is based on mutual user-server communication. User generates requests for particular pages by entering domain names or clicking on links. Server responds with data, containing complete Web page, including all prerequisites it may have. What is seen as a single Web page in fact is complex set of objects – script files, images, inline text, style sheets, etc. Today’s internet browsing is based on HTTP protocol version 1.1, which uses single TCP session to communicate between user device and Web server. Therefore, the effectiveness of HTTP is fully dependant on TCP/IP stack performance. Unlike HTTP version 1.0, version 1.1 can reuse TCP connection to transfer Web objects, therefore TCP handshake and slow start has to be experienced only once, no matter how many objects are held in particular Web page. This routine is presented in Fig. 1.
(2)
where Bdec is nominal declared throughput of access link, ΔB – throughput degradation. Thus, the Web session time can be expressed as: (3) Tsw = T0 + S s ( B dec − ∆B) , where T0 is the sum of all waiting (processing) times, Ds – data volume transferred in given session. By joining (3) and (1) we get Web browsing process MOS evaluation:
MOS = A − H ⋅ ln[T0 + S s ( B dec − ∆B)] ,
(4)
which may be approximated by
MOS = MOS 0 − δ ⋅
∆B . B dec
(5)
Web browser
MOS 0 = H ⋅ ln[T0 + S s B dec ] .
(6)
tDATA1
∆B . Bdec
TCP ACK Data packet #1 Data packet #2 TCP ACK Data packet #3 Data packet #4 Data packet #n HTTP GET TCP ACK Data packet #1
t1 t2
(7)
t3 t4 tn
tGET2
κ =δ ⋅
TCP ACK TCP SYN ACK HTTP GET
tGET1
δ is proportional coefficient, estimating throughput degradation influence on quality of service, and κ (7) refers to impairment factor, caused by throughput degradation. κ is inversely proportional to ΔB
tfin tDATA2
It is noticeable that MOS expression (5) is similar to E-model (ITU rec. 107) expression for voice quality estimation. Several research works ties quality of service to throughput. Paper [5] proposes to use the throughput as QoS indicator perceived by a video conferencing application in the presence of a bottleneck. Another publication [6] presents expression for video clip, coded in MPEG-2, evaluated by heuristic equation DMOS = m /(a bitrate) n , where DMOS (Difference MOS) is the quality metric, with values between 0 and 1, bitrate is expressed in Mb/s , for Low Movement n=1.125 and m= 0.21, a=3.57. Most common link throughput methods intend to measure average throughput and work as active measures by presenting special server, where user sends and receives
HTTP Server TCP SYN
tinit
In formula (5) MOS0 represents MOS score, when observed access link throughput is equal to declared one:
TCP FIN
TCP ACK
t
t
Fig. 1. Packet-level view of Web page retrieval
Additional time is taken by TCP connection establishment (tinit) and release (tfin), however, this is done only once at the page opening and lasts as long as you browse on same server. HTTP connection setup starts with TCP SYN packet, initiated by user. It is the beginning of three-way TCP hand-shake. After successful connection, user sends page 60
Web page object transfer times tDATA. To do so, agent tracks every packet leaving and entering network interface and looks for HTTP headers (Fig. 4). Depending on type of transaction (request or response), separate timers are used to measure tGET and tDATA. An effective bandwidth, experienced at that particular time, is calculated afterwards. Object retrieval speed can be calculated easily, since Web page object sizes are known. However, few objects can be downloaded at same time (if content is distributed among different hosts), for this reason agent additionally keeps track of total interface bandwidth, allowing to measure total access link bandwidth.
request, which is called HTTP GET and usually is small enough to fit in one packet. Server acknowledges the request with TCP ACK, this way concluding page request procedure, which is measured as tGET. Next, server starts sending Web page with required objects to show on user’s Web browser. Object downloads follow standard TCP acknowledgement routine. Duration of the phase, where data of single object is being downloaded, is measured as tDATAn. In HTTP 1.1, next object download can be carried out on the same TCP session, therefore HTTP GET message can be sent right away for next Web page object. Finally, TCP connection is released with two-way user initiated handshake: TCP FIN, TCP ACK messages. TCP data delivery mechanism is important to consider, because it allows adapting and dynamically utilizing all available channel bit rate. However, the adaptation requires time, therefore, bit rate fluctuations can be observed and available channel resources underutilized at some periods of slow start and congestion avoidance. We have collected a large array of object sizes by grabbing random Web page objects from random internet Web pages. It can be seen (Fig. 2) that over one third of Web page objects have size under 5 KB, and second most commonly distributed range is from 30 to 50 KB. Thus, most common object sizes are relatively small.
Fig. 3. Web page browsing quality estimation experimental setup
The tool is transparent to any user application software; therefore, user may use any Web browser or Web page retrieval method. Operation of the tool is based on jnetpcap [9] libpcap [10] libraries, which allow reading packet headers and retrieving the contents. The tool has been written on Java programming language and tested under Linux OS.
Fig. 2. Distribution of object sizes in random internet Web pages
The size of tGET is influenced by physical channel bandwidth and channel delay. The higher packet delay is introduced in transmission channel, the higher tGET value is observed, meaning that user will have to wait more time for object to be downloaded. This time delay will directly influence satisfaction and the perceived quality as well. Meanwhile, tDATA represents the time, which is used to actually download the object. This value is also dependent on available channel bit rate, but again, the delay introduced in channel will have high impact if object size is as small as several TCP packets.
Fig. 4. Simplified algorithm of perceived quality tracking agent
Experimental measurements with the prototype of the tool were performed by downloading popular news portal lrytas.lt index page with inline objects – images, scripts, etc. The dedicated server was used with precise original Web page copies in order to eliminate server load influence, make testing environment fully controllable and to focus on access link evaluation.
Experimental Testbed We developed a Web browsing tracker tool to evaluate how radio access network performance influences Web browsing quality. It acts as passive agent on user device (Fig. 3), logs HTTP GET response time tGET and 61
Additional software based on wget [11] was developed to automate Web page browsing process and make long testing sessions possible (24-hour, week or longer runs). This software simulates Web browsing by requesting to download predefined Web pages as a regular Web browser would do. The tool additionally continuously logs time, received signal strength indicator (RSSI) and coordinates for later data analysis. This allows data to be analyzed based on different correlations: throughput over time, place or RSSI.
decreases. Short-term fluctuations usually are caused by changing radio environment. Even though the presented results have been taken in stationary conditions, quality of the radio link varies due to fading effects, interference or weather conditions, as well as non-stationary nature of channel resource provision. The wide range of achievable object download throughputs is also related to HTTP transmission specifics. Analysis of separate object achieved throughputs shows that intensity of fluctuations is more evident on small objects. Fig. 6 presents instantaneous download speeds of 1.6 kB, 6.3 kB and 96.6 kB objects. It can be seen that smaller objects achieve significantly lower throughput, however they are much more stable even at period of higher link utilization rate.
Experimental Results Several sets of experimental results have been collected. All measurements were made on real GPRS access link using usb-dongle modem in stationary environment with satisfactory network conditions: RSSI between -75 and -85 dBm. The modem was forced to work in GPRS-only mode. From logged tGET and tDATA values we can see the instantaneous object retrieval duration values over period of time. However, those values are not informative, since object sizes are different. To make the measurements object size independent, we calculate achieved throughput
Bn =
t GETn
1.6 kB 6.3 kB 96.6 kB
70 60 50
Bn, kb/s
Sn , + t DATAn
80
(8)
40 30 20
where Bn is the achieved throughput of n-th object, Sn – n-th object size, tGETn + tDATAn – n-th object retrieval time, measuring from the moment of request departure to moment of last object data packet arrival.
10 0 00:00
04:00
08:00
12:00 Time
16:00
20:00
24:00
Fig. 6. Instantaneous different size object download throughput
60
70
50
60
40
50
Bn, kb/s
Bn, kb/s
70
30 20
40 30
10
20
0
10
00:00
04:00
08:00
12:00
16:00
20:00
24:00
min mean max
0
Time
1
Fig. 5. Instantaneous object download throughput during 24-hour measurement period
10 Object size, KB
100
Fig. 7. Download throughput dependency on object size
Instantaneous object download throughput values show great fluctuations over time. In Fig. 5 we can observe great range of achieved object throughputs, scattered from less than 10 kbps to almost 70 kbps. Even average of single Web page objects (average is shown in Fig. 5 as continuous line) show short-term and long-term fluctuations. Long-term fluctuations represent alternating network load: throughput decreases due to higher access network utilization at peak times – roughly from 10 a.m. to 22 p.m.; at this time maximum achievable throughput also
If we look at minimum, average and maximum achievable throughputs for objects of different sizes in Fig. 7, we can see clear tendency of higher throughputs for bigger objects. The statistics has been collected from measured Web site lrytas.lt title page, which contained over 60 different size objects. The reason again lies in HTTP transfer principle. Every object is requested by GET command. Even though GET carries relatively small amount of data, it has to reach the server before object data download starts. Considering 62
GET as fixed time overhead to any object download time period, the short objects suffer from relatively smaller achieved throughput.
1.0 0.8
Analysis of Available Bit Rate Maximum achievable throughput or average throughput of the object cannot be used as browsing quality evaluation, because different size objects behave differently even in channel with the same available bandwidth. Therefore, we propose to use lower-level statistics for available bit rate evaluation to mitigate result dependency on Web page design characteristics. Our developed monitoring agent is capable of logging every packet size Sn (to exclude overhead, we take TCP payload into account only), packet arrival times t1, t2, … tn and inter-packet time Δtn = tn+1–tn (Fig. 1). Available bit rate at given moment of n-th packet transmission will be calculated as follows
Bn =
Sn . ∆t n
PDF
0.6 0.4 off-peak peak
0.2 0.0
0 10 20 30 40 50 60 70 80 90 100 110
Bn, kb/s Fig. 8. Probability density function of measured available bit rate
With passive monitoring tool the measurement data can be processed in real time and presented to perceived quality analysis module, which, using information about access network capabilities and user’s service level agreement with operator, can monitor, indicate quality impairments and account quality grade.
(9)
Since transport of the HTTP traffic is implemented on TCP, values of Δtn and therefore Bn will vary a lot when packet pair includes waiting for ACK as congestion control related delay. Max and average Bn values can be calculated per page object or per Web page. The major disadvantage to perform calculations on whole Web page basis is that short-time network impairments may be integrated over long page opening time. On other hand, more precise evaluations than per-page score will not be needed for user, however it may integrate short term impairments and eventually will lead to inaccuracy of quality evaluation of analysis software. Calculations, based on object basis is not reasonable due to risk unequally handle different size objects – smaller objects will have lower probability of reaching available channel bit rate. Fig. 8 presents the probability density function of all Bn measurements in complete index.html Web page including all Web page objects. Comparing values, obtained at peak usage times (higher access network utilization), and off-peak times (underutilized access network), we can see different distribution of available bit rates. Peak time measurements have approx. 45 kbps mean and 95 kbps max value, while off-peak measurement show over 57 kbps mean and over 102 kbps max value. Note, that maximum observed bit rate values are higher than highest possible net TCP throughput, reachable in GPRS link. Inter-packet time observation based bit rate measurement represents instantaneous per-packet throughput, which naturally reaches higher values. Only average packet-pair bit rate values are comparable with those observed with net TCP throughput. Therefore, proposed methodology allows evaluating both short-term and long-term available bit rate in wireless user access link. Short-term evaluation allows ignoring TCP rate control and focusing on access network related impairments. This way it will be possible to avoid unwanted correlation between Web page structure and perceived quality of service evaluation.
Conclusions Perceived QoS is not measured during service delivery in today’s mobile wireless networks. In reality, the actual perceived quality of service is close to impossible to measure, but methodologies and tools to monitor and evaluate quality impairments can be created. In this paper we analyze the evaluation of quality of Web browsing service – one of the major internet services today. We propose to implement passive perceived quality monitor, relying on testing and measurement tools for network impairments, including available bit-rate, latency and packet drop characteristics. In this paper we present development and testing of passive non-intrusive software agent, residing in user device for obtaining channel available bit-rate, which can be used to evaluate perceived quality of Web browsing service. The experiments with sample Web page show, that neither Web page download time, nor Web page object download speed measurement can directly be used for available channel bit rate evaluation. The main problem lies in nature of HTTP transmission mechanism, based on TCP. Today’s Internet Web pages are complex object structures, composed of many different objects and their behavior may differ from site to site even with same access network conditions. Therefore, we propose to evaluate available bit-rate of the radio access channel by tracking packet sizes and calculating time period between received packet pairs. This way available channel bit rate is evaluated objectively and can be used for quality of service in access network indication for user. Even though perceived quality of Web browsing is proportional to average bit rate of the channel, additional research is needed to define the exact input of channel bandwidth to perceived Web browsing quality. This research shall 63
5. Fiedler M., Tutschku K., Carlsson P., Nilsson A.A. Identification of performance degradation in IP networks using throughput statistics // Proceedings of the 18th International Teletraffic Congress (ITC–18). – Berlin, Germany, 2003. – P. 399–407. 6. Joskowicz J., López–Ardao J. C., Ortega M. A. G., García C. L. A Mathematical Model for Evaluating the Perceptual Quality of Video // Proceedings of the 2nd International Workshop on Future Multimedia Networking, FMN 2009. – Vol. 5630. – P. 164–175. 7. Benko P., Malicsko G., Veres A. A Large–scale, Passive Analysis of End–to–End TCP Performance over GPRS // Proceedings of IEEE Infocom 2004. – Vol. 23, no. 1. – P. 1883–1893. 8. Ricciato F., Vacirca F., Svoboda P. Diagnosis of Capacity Bottlenecks via Passive Monitoring in 3G Networks: an Empirical Analysis // Computer Networks, 2007. – No. 57. – P. 1205–1231. 9. Jnetpcap. jNetPcap OpenSource A Libpcap/WinPcap Wrapper. [Interactive] http://www.jnetpcap.org. 10. Libpcap. TCPDUMP/LIBPCAP public repository. [Interactive] http://www.tcpdump.org. 11. Wget. GNU WGET. [Interactive] http://www.gnu.org/software/wget.
include analysis of bit rate evaluation dynamics and perceived quality classification by assigning quality scores. Future work will include perceived quality indication algorithms, which base their decisions on objective passive real-time measurements at user device. Acknowledgement The research was supported by Lithuanian State Science and Study Foundation Project reg. No. B-08008. References 1. Kajackas A., Anskaitis A., Guršnys D. Individual Quality of Service concept in Next Generations Telecommunications Networks // Electronics and Electrical Engineering. – Kaunas: Technologija, 2005. – No. 4(60). – P. 11–16. 2. Wei Li, Andrew W. Moore. Classifying HTTP Traffic in the New Age. – 2008. 3. Gunduz S., Tamer O. M. A Poisson model for user accesses to Web pages // Proceedings of the ISCIS'2003. Lecture Notes in Computer Science. – Springer, Berlin. – Vol. 2869. – P. 332–339. 4. ITU G.1030. Annex A. Opinion model for Web–browsing applications.
Received 2010.02.15 A. Kajackas, A. Šaltis, A. Vindašius. User Access Link Impact on Web Browsing Quality // Electronics and Electrical Engineering. – Kaunas: Technologija, 2010. – No. 4(100). – P. 59–64. This paper analyzes the possibility to develop method of user perceived quality of service estimation and to create impartial monitoring system to track user perceived quality. We also propose passive method for user perceived quality estimation, which allows evaluating if actual quality of service achieved by network meets the quality declared by operator, and allows discovering if it is degraded. It is seen, that degradation of Web browsing quality is proportional to degradation of user access link available bit rate. In this paper presented development and testing of passive non-intrusive agent, implemented using tcpdump and libcap libraries, residing in user device for obtaining channel available bit rate, which can be used for evaluation of perceived quality of Web browsing service. Experimental data shows that throughput, perceived by user, depends not only on instantaneous available bit rate of the physical access link, but also on TCP transmission characteristics. Even though perceived quality of Web browsing is proportional to average bit rate of the channel, additional research is needed to define the exact input of channel bandwidth to perceived Web browsing quality. Ill. 8, bibl. 11 (in English; abstracts in English, Russian and Lithuanian). А. Каяцкас, А. Шалтис, А. Виндашюс. Влияние линий доступа на качество просмотрa сайтов // Электроника и электротехника. – Каунас: Технология, 2010. – № 4(100). – C. 59–64. В данной работе анализируется возможность создания метода оценки качества веб броузинга, воспринятого пользователем при работе по мобильной линии связи. Вторая часть работы посвящена поиску способа создания программного агента, в реальном времени дающего оценку качества. Учитывая особенности мобильных линий связи, предложено качество оценивать косвенным способом, по тому насколько реальное качество понижено по сравнению с декларируемым оператором связи. Показано, что понижение качества просмотрa сайтов пропорционально понижению скорости передачи данных. Создано экспериментальное устройство пассивной оценки скорости передачи данных. В устройстве использованы программы tcpdump и libpcap. Оно определяет времена передачи компонент веб сегментов и объемы этих сегментов. По этим данным вычисляется кратковременная скорость передачи. Проведенные многократные эксперименты показывают, что реальная скорость передачи данных зависит не только от пропускной способности линии, на колебания скорости передачи существенное влияние оказывает специфика TCP протокола. Качество просмотрa сайтов, воспринятое пользователем, очевидно, пропорционально средней скорости передачи данных. Продолжение исследований планируется сосредоточить на определении количественного вклада скорости передачи данных по линии связи на воспринятое качество просмотрa сайтов. Ил. 8, библ. 11 (на английском языке; рефераты на английском, русском и литовском яз.). A. Kajackas, A. Šaltis, A. Vindašius. Vartotojų prieigų įtaka Web naršymo kokybei // Elektronika ir elektrotechnika. – Kaunas: Technologija, 2010. – Nr. 4(100). – P. 59–64. Darbe analizuojama galimybė sukurti metodą Web naršymo metu vartotojo patirtai kokybei vertinti. Kita darbo dalis skirta ieškoti būdo, kaip sukurti priemonę, kuri realiu laiku parodytų vartotojo patirtą kokybę. Atsižvelgiant į mobiliojo ryšio specifiką, pasiūlyta vartotojo patirtą kokybę vertinti ne tiesiogiai, bet pagal tai, kiek ta kokybė yra prastesnė palyginti su deklaruojama paslaugų teikėjo. Parodoma, kad Web naršymo kokybės suprastėjimas proporcingas prieigos linijų perdavimo spartos sumažėjimui. Sukurta eksperimentinė pasyvinė perdavimo spartos vertinimo priemonė, naudojanti tcpdump ir libpcap programas ir nustatanti Web puslapio dedamųjų perdavimo trukmes ir duomenų masyvus. Pagal šiuos duomenis apskaičiuojama momentinė perdavimų sparta. Daugkartinių eksperimentų duomenys rodo, kad reali sparta priklauso ne tik nuo prieigos linijos laidumo, spartos įverčių kitimui daug įtakos turi ir TCP protokolo specifika. Vartotojo Web naršymo paslaugos patirta kokybė, aišku, yra proporcinga vidutinei perdavimų spartai. Toliau numatoma tirti prieigos linijos spartos įtaką kokybės suprastėjimui. Il. 8, bibl. 11 (anglų kalba; santraukos anglų, rusų ir lietuvių k.).
64