AbstractâYouTube is the largest video-sharing social network where users (aka ... order to analyze the impact of the community structure in social networks ...
User and group networks on YouTube: A comparative analysis Malek Jebabli
Hocine Cherifi
Chantal Cherifi
Atef Hamouda
University of Burgundy Dijon, France Email: Malek.Jebabli @u-bourgogne.fr
University of Burgundy Dijon, France Email: hocine.cherifi @u-bourgogne.fr
University of Lyon 2, France Email: Chantal.BonnerCherifi @univ-lyon2.fr
University of Tunis El-Manar Tunis, Tunisia Email: atef hammouda @yahoo.fr
Abstract—YouTube is the largest video-sharing social network where users (aka channels) can create links to any other users. Moreover, initially, users were allowed to create and join special groups of interest. Therefore, two types of online social networks can be defined. First, a user network where the nodes represent the users and the edges represent the social ties (friendship) between users. Second, a group network where the nodes represent the groups and the edges represent the social ties between groups, due to shared users. As the group network can be apprehended as the ground-truth overlapping community graph (where the nodes are the discovered communities and the links represent the overlap between the communities) of the user network, it is of prime interest to analyze and compare their topological structure. In this paper, we report the results of an extensive comparative evaluation of various macroscopic topological properties of both networks based on data from over one million users. Additionally, the community structure of the networks are uncovered using an overlapping community detection algorithm and the relationship between their community structure is investigated. The results of this study allow a better understanding of the relations between the mesoscopic and the macroscopic properties of online social networks, both from a topological and a functional point of view.
I.
I NTRODUCTION
YouTube is the most popular video sharing repository, organized around content and users. It enables users to post, share and discuss videos. From a complex networks perspective, it can be apprehended either through its content organization or online social relationships shared by its users. Indeed, YouTube provides users with personal pages on which they can create links to any other users. Although it is not often perceived as an online social networking site, it provides common tools for maintaining social relationship between users. It is therefore of prime interest to have an in-depth understanding of the various networks associated to it. If we restrict our attention to users rather than content, the most familiar representation considers that the users are the nodes of the network. One of the first Large-Scale analysis of YouTube user network is reported by Mislove et al [1]. The data obtained by crawling publicly accessible information on YouTube sites is constituted by 1157827 nodes (users) and 4945382 (friendship) links. Moreover, 8% of YouTube users are distributed into 30087 groups (channels). By joining different groups, users could have access to a set of contents of their interests, all gathered in one location. Note that since December 2010, Google has decided to revoke access to YouTube groups, and
has integrated it with Google+. Their investigations showed that the user network contains a densely connected core of high-degree nodes that links small groups of low-degree nodes at the fringes of the network. Furthermore, their results confirm the Power-Law and Small-World properties of the network. The reported negative value of the assortativity coefficient is due to the fact that nodes tend to connect to nodes with very different degree from their own. The few statistics collected about groups showed that user groups represent tightly clustered communities of users and that members of larger groups tend to be less clustered than those of smaller groups. Further, low-degree user nodes tend to be part of very few groups, while high-degree user nodes tend to be members of multiple groups. More recently Rad et al. [2] studied the same dataset in order to analyze the impact of the community structure in social networks content propagation. Indeed, social network content propagation is believed to depend on the similarity of users as well as on the existence of friends in the social network. They measured interest similarity between YouTube users based on their group and community membership. Note that groups and communities do not cover the same notions. Indeed, groups are commonly referred as functional communities or ground truth communities. They are linked to a node labeling while structural communities are revealed by the topological structure of the network. Various similarity measures have been used in order to investigate the degree of similarity in communities versus the entire social network. Results demonstrate that the average similarity within the communities is greater than the average similarity within the entire social network. In other words, communities are formed from similar users. Additionally, it turns out that there are no large similarity values between friends in YouTube communities. Note that they discard from the analysis the users who did not use YouTube group feature. The community structure of the remaining dataset has been uncovered using the Walktrap algorithm. This non overlapping community detection algorithm is based on random walks, in order to detect cohesive subsets of nodes corresponding to structural communities [3]. There are some other interesting studies in the same context [4] and [5]. Generally, authors are interested either in the user network or in its community structure. Furthermore, although a user can be part of multiple communities, non-overlapping community detection algorithms are used for discovering the community structure. To date, to our knowledge, there is no comprehensive study aimed at a better understanding of
the relationship between the topological structure of user and group networks on YouTube. Unfortunately, there is only some incomplete results, because authors focus either on user or on group network analysis. To overcome these drawbacks, we conduct an extensive comparative evaluation of both networks. Our objective is to answer the question: what are the common features of user and group networks, and to what extend the group network can be apprehended as a summary of the user network. In other words, do we get the same information at different scales from user to group networks. In this paper, we focus on functional groups. Indeed, structural communities are too dependent of the community detection algorithm used, and there is no consensual solution to this problem. Furthermore, according to sociologists, online communities are characterized by groups of interacting people brought together by a shared interest, and this does not necessarily mean strong interactions between members of the same groups. We use the data given by Mislove et al [1]. In the user network, users are the nodes while the friendship represents the links. In the group network, groups are the nodes and there is a link between two nodes when there is at least a user that belongs to both groups. First of all, we analyze the most basic properties of user and group network of YouTube. We also investigate, with more details, the macroscopic topological properties of some important local network features. Then, we compare the mesoscopic properties of the networks. Note that we use an overlapping community detection method to uncover the community structure. The rest of the paper is organized as follows. Section 2 recalls briefly the main characteristics of the dataset and the community detection method used. Section 3 presents the results of our analysis. Finally, in Section 4 we present conclusions. II.
M EASUREMENT M ETHODOLOGY
For our experiments, we use the undirected, unweighted YouTube real-world network with known functional overlapping groups provided by Mislove et al [1]. Users of YouTube, are linked with friendship relations. Each user can create groups that other users can join. We consider such userdefined groups as ground-truth groups. Our analysis is based on both networks i.e. user and group network. The group network nodes are the functional groups of YouTube. The links represent the fact that at least one user belongs to both groups. Among the large dataset of over 1.15 million users, more than 290 thousands recorded group membership. As it covers more than 30 thousands groups, on average, every user is a member of 4 groups. The user with the highest number of membership has joined more than 1 thousand groups. Table 1 summarizes the basic properties of these networks. For simplicity, YouTube group network is denoted by YouTube* while user network is denoted by YouTube. A detailed description of the data format and downloading instructions are available at http://snap.stanford.edu/data/comYouTube.html. As planned, the structural communities are detected using the Speaker Listener Label Propagation Algorithm (SLPA) on YouTube and YouTube*. This algorithm introduced by Xie et al [6] is an extension of the Label Propagation Algorithm
(LPA) dedicated to overlapping community detection. While in LPA, each node holds only a single community label that is iteratively updated by adopting the majority label in the neighborhood, in SLPA each node possesses multiple labels to account for communities overlaps. The choice of SLPA is due to several reasons. First of all, SLPA is one of the most effective overlapping community detection algorithm in Large-Scale networks [7]. Its time complexity scales linearly with the number of edges, therefore, it is very efficient for the calculation in Large-Scale networks. In addition, extensive experiments on both synthetic and a wide range of realworld networks have been performed. Results show that SLPA achieves the highest average modularity compared to alternative methods such as COPRA, GCE, LFM, CIS, Link, Infomap [6]. TABLE I.
N UMBER OF NODES AND LINKS OF THE ANALYZED NETWORKS
Number of nodes
Number of edges
Density
YouTube
1134890
2987624
4.63 ∗ 10−6
YouTube*
14170
386366
3*10−2
III.
DATA A NALYSIS AND D ISCUSSION
Structural analysis of complex networks can be performed at different scales ranging from the microscopic (features of the nodes), macroscopic (statistical measures are used to summarize some of the overall network features) to the mesoscopic level (characteristics of the modular structure). In this study, we focus on macroscopic and mesoscopic levels. In this section, we briefly recall and discuss some measures commonly used to capture, in quantitative terms, the networks organizing principles. A. Global topological properties The discovery of basic topological properties of many real systems has stimulated a great deal of interest in order to understand various complex systems. In this analysis, we compute the most influential measures on YouTube and YouTube*. Table II reports the average shortest path, the global clustering coefficient, the degree correlation as well as the diameter for YouTube and YouTube*. The Small-World property refers to the low average distance value between any two nodes of a network. Both networks possesses the Small-World characteristic, with an average shortest path around 3. If one sticks to this property, the networks are very similar. Indeed, the difference around 2% is not statistically significant. The Average clustering coefficient reflects the tendency of triangles formation between neighboring nodes in a network. According to this parameter, YouTube and YouTube* are quite different. Hence, it appears that groups are much more clustered than users. This may account for the fact that users share more interest relations rather than friendship relations in YouTube. Anyway, the friend of friend phenomenon is much more pronounced in the group network. The degree correlation measures the tendency of nodes to associate with other nodes sharing the same characteristics and especially the same degree values. In assortative networks,
●
●
●
10000
●
●
●
1000
●
●
●
●
●
●
● ● ● ● ● ●● ●● ● ● ● ● ● ●● ● ●
● ● ●● ●
● ● ● ● ● ● ● ● ● ● ● ● ●● ●● ●● ●● ● ● ● ● ●● ●
● ● ●●
●
●
Average Average clustering Degree Diameter shortest path coefficient correlation YouTube
3.14
0.08
0.12
12
YouTube *
3.05
0.293
0.24
9
●●●●● ● ● ●●
● ● ●● ● ●● ● ● ●● ● ●● ●● ● ● ●● ● ● ● ●●● ●● ●
G LOBAL PROPERTIES OF YOU T UBE AND YOU T UBE * 1
TABLE II.
Empirical Theoretical
●
Count 100
The distance between two nodes is defined to be the length of the shortest path between them. The diameter is defined to be the maximum of all possible distances. It turns out that the diameter values for YouTube and for YouTube* are very close.
(a) YouTube
10
the nodes tend to associate with their connectivity peers, and the degree correlation is positive. In disassortative networks, high-degree nodes tend to associate with low-degree ones, and the degree correlation is negative. Social networks appear to be assortative while information, technological and biological networks appear to be disassortative. YouTube and YouTube* show a relatively similar behavior, as both are assortative networks. Nevertheless the degree correlation value is two time higher for YouTube*.
1
5
10
● ●● ●● ●● ● ●●●● ●●● ●●●● ●● ● ● ●● ●● ● ●● ●●● ● ●
50 degree
100
● ●● ●
●
500
●
1000
(b) YouTube*
B. Macroscopic topological properties ●
●
2) Average clustering coefficient as a function of nodes degree: This property gives details of a network’s triangular
●
●
Empirical Theoretical
●
500
● ● ● ● ● ● ● ●●
●
●
● ●
● ● ●
100
● ●● ● ● ● ● ● ● ● ● ●● ●● ●● ● ●●●
●
●●
10
Count 50
● ●● ● ● ● ● ● ● ● ● ●● ● ●●●● ● ● ●● ● ● ● ●● ● ●● ● ● ●● ●● ● ● ● ● ● ● ● ● ● ● ●● ● ●● ● ● ● ● ● ● ● ● ●●● ● ● ●● ● ● ● ● ●● ● ● ● ●● ● ● ●●● ● ● ● ● ●●● ●● ● ● ● ● ● ● ●● ● ●● ● ● ●● ●● ● ●● ● ● ●●●●● ● ●●●●●●●●● ●● ● ●●●● ●●● ● ● ● ● ● ●●
5
● ● ●● ● ●● ● ●●● ●● ● ●● ● ● ● ●● ● ●● ● ●●●●●● ●● ●●●● ●
●
● ● ●● ●● ●● ●● ● ●●● ● ●●● ● ●●● ● ● ● ● ● ● ● ●
● ● ● ● ●● ● ●● ●● ●● ● ●●● ● ● ●● ● ●●●●● ●● ●
●●● ●● ● ● ● ●● ● ● ●● ● ● ● ●● ● ● ● ● ●● ● ● ●● ●●● ●● ●
1
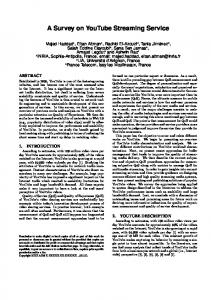
1) Degree distribution: The Degree distribution measures the statistical repartition of the network nodes degrees. For a large number of networks, it can be adequately described by a Power-Law distribution (P (k) ∼ k −α ), where α is a positive exponent. These networks are often referred as ”scale-free networks” because their degree distribution does not depend on their size. Related experimental studies show that the exponent value of the Power-Law usually ranges from 2 to 3. Fig.1 reports the empirical degree distribution of the original YouTube and YouTube* networks together with the estimated Power-Law distributions using a log-log plot. According to these results, the Power-Law distribution seems to be a good fit. In order to confirm this hypothesis, we tested nine alternative distributions (Beta, Cauchy, Exponential, Gamma, Logistic, Log-Normal, Normal, Uniform and Weibull) using the Kolmogorov-Smirnov test. Results are reported in Table III. Undoubtedly, the Power-Law is the most suitable hypothesis for the user network. However, the results are more ambiguous for YouTube* since the KS-Test values for Power-Law and Log-Normal are very close. Log-Normal and Power-Law distributions connect quite naturally, and hence, it is not surprising that Log-Normal distributions is a possible alternative to Power-Law distributions. Indeed, very similar basic generative models can lead to either Power-Law or LogNormal distributions, depending on seemingly trivial variations [8]. The Power-Law exponent values (α = 3.04 for YouTube and α = 3.5 for YouTube*) are in the range generally observed for most real-world complex networks. However, we must notice that the max degree values are quite different. It is more than 8 times higher for YouTube (28901) as compared to YouTube* (3581). The differences are more pronounced if we refer to the average degree. Indeed, its value is equal to 847 for YouTube and 54 for YouTube*. This reflects the fact the network sizes are not in the same magnitude. Despite these variations, we can therefore conclude that the degree distributions are quite similar.
●●● ● ● ●● ● ● ● ● ● ● ●● ● ● ● ●● ● ● ● ● ● ● ● ● ● ● ● ● ● ● ● ● ● ● ● ● ● ● ● ● ● ● ● ● ● ● ● ● ● ● ● ● ● ● ● ● ● ● ● ● ● ● ● ● ●● ● ● ● ● ● ● ●● ● ●● ● ● ● ●● ● ●● ● ● ● ●● ●● ● ● ●● ●● ● ● ●● ●
1
5
10
50 100 degree
●● ●
500
Fig. 1. Log-log empirical degree distribution (blue) and Power-Law estimating (red) of YouTube (a) and YouTube* (b) TABLE III.
KS-T EST VALUES FOR THE DEGREE DISTRIBUTION . T HE DISTRIBUTION UNDER TEST ARE THE P OWER -L AW (PL), B ETA (BE), C AUCHY (CA), E XPONENTIAL (E), G AMMA (GM), L OGISTIC (LO), L OG -N ORMAL (LN), N ORMAL (N), U NIFORM (U), AND W EIBULL (WB) PL YouTube
BE
CA
E
GM
LO
LN
N
U
WB
0.01 0.56 0.23 0.35 0.56 0.39 0.36 0.41 0.98 0.28
YouTube* 0.03 0.31 0.23 0.29 0.28 0.32 0.05 0.33 0.88 0.31
clustering structure. In order to estimate this distribution, we calculate for each node, its degree and its local clustering coefficient. Thereafter, we calculate the average clustering coefficient for the nodes with the same degree value. The plots of average clustering coefficient of nodes grouped by their degree, are reported in Fig.2. X-axis denote the degree while Y-axis is the average clustering coefficient. For a large number of networks, this distribution can be adequately represented by a Power-Law [9]. The estimated Power-Law coefficients are respectively α = 3.51 for YouTube and α = 4.15 for YouTube*. Note that these values are in the usual range. The
KS-Test values are reported in Table IV. For YouTube, it is clear that this distribution follows a Power-Law. However, the KS-Test values for YouTube* are very similar for three distributions (Power-Law, Beta and Gamma). Therefore, we cannot say for sure which one is a better fit. However, if we focus only on the tail of the distributions, in both cases, they can be approximated by a Power-Law.
2e−03
(a) YouTube
●
●
● ●
5e−04
●
● ●
● ●
● ●
● ●
● ●
Aver. Clustering coefficient 2e−05 5e−05 2e−04
● ●
● ● ● ● ● ●
● ●
●
●
●●
● ● ●●
● ●● ●
●
●
●
●
●● ● ● ●●
● ●
● ●
● ● ●
●
● ●
●
●● ●● ● ● ● ●● ● ● ● ● ●
●
●
●
● ● ●
●
●
● ●● ●● ●
● ● ● ●
●
●●
●
interconnectivity. It shows the proportion of node pairs separated by a given distance. Usually authors prefer to represent it as a cumulative distribution. In this case, it shows the fraction of nodes that can be reached on average within N hops in a network. This representation allows to read off the figure other statistics such as the diameter (100-percentile), the effective diameter (90-percentile) and the median path length (50-percentile). Fig.3 represents the cumulative distribution. We extracted from the plot the median path length, the effective diameter and the diameter. The results are shown in Table V. Fig.4 represents the empirical hop distance distribution together with the Normal distribution estimates for the networks. Indeed, according to the KS-Test values reported in Table VI, the gaussian distribution hypothesis outperforms all the other alternative hypotheses under test. Note that the parameters of the hop distance distribution are very similar, with a mean value µ = 5.6 and standard deviation σ = 1.2 for YouTube as compared to µ = 3.56 and σ = 1.12 for YouTube*.
●
●
● ● ●
● ●
●
● ● ● ●
(a) YouTube
●
2e−06
5e−06
●
1.0
●
●
●
● ●
Diameter
●
●
● ●
1
5
10
50 Degree
100
500
1000
Effective Diameter 0.8
Cumulative
(b) YouTube*
● ●
0.6
● ●
Median
1.00
0.4 ●
●
●
Aver. Clustering coefficient 0.10 0.20
0.50
●
● ● ● ● ● ● ● ● ● ●● ●● ●● ● ● ● ● ● ● ● ● ● ● ●●●●● ● ●● ● ● ● ● ●●● ● ● ●● ● ● ● ● ●● ● ●●●●●●●●● ● ●● ● ● ● ● ● ●●● ●●● ● ●● ● ●● ● ● ●● ● ● ●● ● ●● ● ● ● ● ●● ● ● ● ● ● ● ● ● ● ● ● ●●● ● ● ● ●● ● ●● ● ● ● ● ● ● ● ●● ● ●●●● ● ● ● ● ● ●● ● ●● ● ● ●●● ●● ● ●● ●●● ●●●●● ●● ●● ●● ● ● ●●●●● ● ● ● ● ● ● ● ● ● ●● ●● ● ● ●● ●● ● ● ● ● ● ●● ● ● ● ●● ●●● ●●● ●● ● ●●●● ● ● ● ●● ● ●● ● ● ●● ● ●●●● ● ●● ● ● ● ● ● ●● ● ● ● ● ●● ● ● ● ● ● ●●● ● ● ● ● ●●● ● ● ●● ● ● ●●● ●●●● ●● ● ● ● ●● ● ● ●●●● ● ●● ●● ● ● ● ● ● ●● ●● ● ● ●●● ●● ● ● ● ● ● ● ●●●● ● ●● ●●● ●● ●●●●● ●● ● ● ● ● ● ● ● ● ● ● ● ●● ● ●● ●●●● ● ● ●● ● ● ● ●●● ● ● ●● ● ●●● ● ● ● ●● ● ●● ●● ● ● ● ● ● ● ●●●● ● ● ● ●● ● ●● ● ●● ● ●●● ● ● ● ● ●● ● ● ● ●●●● ● ● ● ●● ●● ● ● ● ●●● ● ●● ● ●● ●● ●● ● ●● ● ● ● ● ●● ● ● ● ● ● ● ●● ● ● ● ● ● ●●● ● ●● ●● ● ● ● ● ●● ● ●● ● ●● ● ● ●●●● ● ● ● ●● ● ● ● ● ● ● ●●● ● ●●● ● ●● ● ● ● ● ● ●● ● ● ● ● ● ● ● ●● ● ● ●● ● ● ●● ● ● ● ●● ● ● ● ● ● ●● ● ● ● ●● ● ● ● ● ●
● ●
0.0
●
10
20
50
100 Degree
200
500
4
6
8
10
12
(b) YouTube* ●
●
● ●●
5
●
Distance
●
2
2
Empirical Theoretical
●
● ●
●
●
●
0
●● ●
●
0.05
0.2
1.0
1000
Diameter
● ●
● ●
● ●
●
●
Effective Diameter ● ●
Fig. 2. Log-log probability empirical and theoretical density functions of Average clustering coefficient distributions as a function of the degree of YouTube (a) and YouTube* (b)
Cumulative
0.8
0.6 ●
Median
●
0.4
TABLE IV. KS-T EST VALUES FOR THE AVERAGE CLUSTERING COEFFICIENT AS A FUNCTION OF NODES DEGREE . T HE DISTRIBUTION UNDER TEST ARE THE P OWER -L AW (PL), B ETA (BE), C AUCHY (CA), E XPONENTIAL (E), G AMMA (GM), L OGISTIC (LO), L OG -N ORMAL (LN), N ORMAL (N), U NIFORM (U), AND W EIBULL (WB) PL YouTube
BE
CA
E
GM
0.04 0.13 0.19 0.17 0.1
LO
LN
N
U
WB
0.2 ● ●
●
0.0
●
0
● ●
●
2
4
6
Empirical Theoretical 8
Distance
0.25 0.11 0.27 0.84 0.3
YouTube* 0.03 0.04 0.19 0.07 0.04 0.12 0.1
0.13 0.78 0.26
3) Hop distance distribution: The Hop distance is a distance related distribution that indicates the level of the network
Fig. 3. Hop distance cumulative distributions for YouTube (a) and the associated network of groups YouTube* (b)
TABLE V.
D IAMETER ,
EFFECTIVE DIAMETER AND THE MEDIAN OF THE CUMULATIVE HOP DISTANCE DISTRIBUTIONS FOR YOU T UBE AND THE ASSOCIATED NETWORK OF GROUPS YOU T UBE *
Median
Effective Diameter
Diameter
YouTube
4,99
6,55
12
YouTube*
2,92
4,36
9
(a) YouTube
1.0
●
Empirical Theoretical
●
●
●
●
●
Frequence
0.8
In order to investigate the community structure of the networks, we performed a series of experiments. Indeed, due to the probabilistic labeling rules, the SLPA algorithm is nondeterministic. Moreover, a parameter r, which represents the decision threshold of nodes membership has to be tuned. To get the best configuration, we repeated on each network under study, the community detection algorithm, while changing the decision threshold from 0.05 to 0.5 with an interval of 0.05. As a performance criterion, we used the overlapping modularity value. Results show that for r = 0.01, the overlapping modularity is maximum. The reported results are given with the optimum r value. Note that this methodology is inspired by previous work of Xie et al. [7], [6] and Dickinson et al. [10]. Although various measures have been proposed in order to quantify a network community structure [11] [12], in the following, we restrict our attention to the four distributions introduced by Palla et al. [13] in order to characterize the overlapping community structure (the community degree, the community size, the membership number, the overlap size).
0.6 ●
● ●
C. Mesoscopic topological properties
●
0.4
0.2
1) Community degree distribution: The Community degree is defined as the node degree of the network of communities, where the nodes are the communities and the links represents the fact that two communities overlap. Palla et al. tested the community degree distribution on co-authorship network of the Los Alamos Condensed Matter e-print archive, as well as the network of autonomous systems. They found that the lower part of the community degree distribution is Exponential. However, the tail of the distribution is a Power-Law for both networks.
● ● ● ●
0.0
●
● ●
● ●
●
0
2
4
6
● ●
8
●
10
●
12
Distance
(b) YouTube*
1.0
●
●
●
●
●
Empirical Theoretical
This is not the case in our analysis. The community degree distribution of YouTube uncovered by the SLPA algorithm is represented in Fig.5. It is clearly decaying as a Power-Law. The exponent is equal to α = 3.15. We remark the same behavior for the community degree distribution of YouTube*. In this case, the Power-Law exponent value is α = 2.27. The KS-Test values are shown in Table VII. This is clear that the Power-Law is the best fit for both networks.
●
Frequence
0.8
0.6
●
●
0.4
●
●
TABLE VII. KS-T EST VALUES FOR THE C OMMUNITY SIZE DISTRIBUTION . T HE DISTRIBUTION UNDER TEST ARE THE P OWER -L AW (PL), B ETA (BE), C AUCHY (CA), E XPONENTIAL (E), G AMMA (GM), L OGISTIC (LO), L OG -N ORMAL (LN), N ORMAL (N), U NIFORM (U), AND W EIBULL (WB)
0.2 ● ●
●
●
0.0
● ●
●
●
0
2
4
6
● ●
● ●
8
Distance
PL
Fig. 4. Hop distance distribution for YouTube (a) and the associated networks of groups YouTube* (b)
TABLE VI. KS-T EST VALUES FOR THE H OP DISTANCE DISTRIBUTION . T HE DISTRIBUTION UNDER TEST ARE THE P OWER -L AW (PL), B ETA (BE), C AUCHY (CA), E XPONENTIAL (E), G AMMA (GM), L OGISTIC (LO), L OG -N ORMAL (LN), N ORMAL (N), U NIFORM (U), AND W EIBULL (WB) PL YouTube
BE
CA
E
GM
LO
LN
N
U
0.21 0.14 0.15 0.44 0.14 0.14 0.14 0.03 0.3
WB 0.12
YouTube* 0.23 0.17 0.16 0.41 0.16 0.16 0.16 0.05 0.25 0.17
BE
CA
E
GM
LO
LN
0.23 0.18 0.29 0.28 0.1
N
U
WB
0.3
0.9
0.25
YouTube
0.02 0.3
YouTube
0.08 0.15 0.29 0.61 0.14 0.34 0.14 0.37 0.15 0.35
2) Community size distribution: The Community size is defined as the number of its nodes. Its distribution has been largely studied in real-world networks. In general, the community sizes are heterogeneous, with many small communities and only a few very large ones. It is therefore adequately described by a Power-Law. Fig.6 reports the empirical distribution together with the Power-Law estimates. The Power-Law exponent is α = 3.14 for YouTube as compared to α = 3.16 for YouTube*. However, the largest community in YouTube contains 821 nodes while it is more than fifteen times bigger in YouTube* which contains 12691 nodes. Consequently, the
(a) YouTube
(a) YouTube
Empirical Theoretical
Number of community
103
102
101
100 1
2
5
10 20 50 Community Degree
100
200
(b) YouTube*
(b) YouTube*
Number of community
Empirical Theoretical
101
100 1
2
5
10 20 Community Degree
50
100
Fig. 5. Log-log community degree distribution of YouTube (a) and YouTube* (b) structural communities
Fig. 6. Log-log community size distribution of YouTube (a) and YouTube* (b) structural communities
average group sizes of YouTube and YouTube* are quite different with 14.04 for YouTube and 36.92 for YouTube*.
3) Membership distribution: The membership number mi of a node i is the number of communities the node belongs to. In the case of YouTube, the node membership distribution is clearly a Power-Law with α = 3.01 as shown in Fig.7. Indeed, the KS-Test value of the Power-Law fit reported in Table IX is close to zero, while the other values are much higher. We note the same behavior for YouTube*. The best fit is obtained for the Power-Law node with α = 3.12. YouTube and YouTube* average membership values are quite close with 1.66 for YouTube and 1.38 for YouTube*. However, the highest number of communities that a node can belong to is equal to 13 for YouTube and 6 for YouTube*.
Looking at the KS-Test values reported in Table VIII, it appears that the Power-Law is a good fit in both cases, even if the Log-Normal distribution with estimated parameters meanlog µ = −4.84 and standard deviation-log σ = 1.11 is also suitable to describe the community size distribution of the YouTube network. TABLE VIII. KS-T EST VALUES FOR THE C OMMUNITY SIZE DISTRIBUTION . T HE DISTRIBUTION UNDER TEST ARE THE P OWER -L AW (PL), B ETA (BE), C AUCHY (CA), E XPONENTIAL (E), G AMMA (GM), L OGISTIC (LO), L OG -N ORMAL (LN), N ORMAL (N), U NIFORM (U), AND W EIBULL (WB) PL YouTube
BE
CA
E
GM
LO
LN
N
0.02 0.31 0.22 0.14 0.29 0.28 0.07 0.3
YouTube* 0.03 0.5
0.33 0.81 0.5
0.5
0.23 0.5
U
WB
0.91 0.23 0.99 0.35
4) Overlap size distribution: The Overlap size of two communities is the number of nodes they share. In Fig.8, the empirical overlap size distribution and the Power-Law estimates are reported. The Power-Law exponents are respectively α = 3.2 for YouTube and α = 2.57. According to the KS-Test values reported in Table X, the Power-Law is
(a) YouTube
(a) YouTube
(b) YouTube*
(b) YouTube*
Fig. 7. Log-log membership distribution of YouTube (a) and YouTube* (b) structural communities
Fig. 8. Log-log overlap size distribution of YouTube (a) and YouTube* (b) structural communities
TABLE IX. KS-T EST VALUES FOR THE M EMBERSHIP DISTRIBUTION . T HE DISTRIBUTION UNDER TEST ARE THE P OWER -L AW (PL), B ETA (BE), C AUCHY (CA), E XPONENTIAL (E), G AMMA (GM), L OGISTIC (LO), L OG -N ORMAL (LN), N ORMAL (N), U NIFORM (U), AND W EIBULL (WB) PL YouTube
BE
CA
E
GM
LO
LN
N
U
WB
TABLE X. KS-T EST VALUES FOR THE OVERLAPS SIZE DISTRIBUTION . T HE DISTRIBUTION UNDER TEST ARE THE P OWER -L AW (PL), B ETA (BE), C AUCHY (CA), E XPONENTIAL (E), G AMMA (GM), L OGISTIC (LO), L OG -N ORMAL (LN), N ORMAL (N), U NIFORM (U), AND W EIBULL (WB) PL YouTube
BE
CA
E
0.03 0.42 0.22 0.3
YouTube* 0.1
GM
LO
0.4
0.35 0.08 0.36 0.91 0.22
LN
N
U
WB
0.55 0.82 0.36 0.52 0.55 0.77 0.36 0.91 0.38
0.02 0.63 0.63 0.38 0.34 0.35 0.24 0.46 0.76 0.28
YouTube* 0.05 0.74 0.65 0.44 0.64 0.38 0.47 0.29 0.97 0.47
IV.
the best fit. Indeed, for YouTube the lowest KS-Test value is obtained with the Power-Law, followed by the Log-Normal distribution (mean-log µ = −4.02 and standard deviation-log σ = 1.52) with a KS-Test value in the same range. However, this result is not as clear for YouTube*. Note that the maximal number of shared nodes in YouTube and YouTube* structural communities are not in the same range (1671 for YouTube and 5277 for YouTube*).
C ONCLUSION
The main objective of this study is to investigate the relationship between users and groups social networks. The user network is classically defined with users as nodes and links account for friendship between users, while in the group network nodes are groups and a link between groups represents the fact that at least one user belongs to both groups. This work is on the same vein that the analysis on DBLP presented in [14]. Table XI summarizes the main topological properties ex-
tracted from both networks. Globally, results are quite convincing. YouTube and YouTube* exhibit remarkable similarities. First of all, they share the fundamental properties of most real-world networks, namely Small-Worldness and high clustering coefficient. Furthermore, YouTube* is assortative which is also the case for YouTube. So, at this basic level, both networks are very typical complex networks. The degree distribution is a Power-Law in both cases. Indeed, there is a very few users with many friends and a great majority of users with few friends. The same behavior for the group network reflects the fact that there is few users that belongs to many groups while remaining users belongs to few groups. In other words there is a few popular users and a few popular groups.
TABLE XI.
S UMMARY OF EXPERIMENTAL RESULTS YouTube YouTube* Global topological properties
Small-World
3
3
Average clustering coefficient
High
Higher than YouTube
Degree correlation
Assortative
Assortative
Diameter
12
9
Macroscopic topological properties Degree distribution
Power-Law (α = 3.04)
Power-Law (α = 3.5)
Avg clust coef as a function of nodes degree
Power-Law (α = 3.51)
Power-Law (α = 4.15)
Normal
Normal
Hop Distance distribution
The average clustering coefficient as a function of nodes degree also confirm the similarity between YouTube and YouTube*. Both distributions follow a Power-Law and this is especially true in the tails of the distribution. The hop distance distributions are nearly identical. Both distributions follows a Normal law with very close median, effective diameter, and diameter value. This is another important property shared by the networks. Since community structures are part of the fundamental properties of real networks, we also examined the similarity between the overlapping community structure of YouTube and YouTube*. We applied one of the most influential algorithm on both networks and we analyzed the usual properties of the discovered community structure (the community degree, the community size, the membership number, the overlap size). Despite the fact that there is less data for the community structure of YouTube* as compared to YouTube, we notice that the four properties under investigation follow a PowerLaw. According to these results, the community structures are quite similar. Overall, all the results of the detailed analysis are going along the same lines: the macroscopic and mesoscopic topological properties of YouTube user social network and its group network are very close. This result is quite interesting. Indeed, it seems that the group network can be used as a good sample of the user network. We are now planning a systematic analysis of various labeled networks in order to understand if the results of the YouTube analysis is an isolated case or if something more ”universal” can emerge. R EFERENCES [1]
[2]
[3]
[4]
A. Mislove, M. Marcon, K. P. Gummadi, P. Druschel, and B. Bhattacharjee, “Measurement and analysis of online social networks,” in Proceedings of the 7th ACM SIGCOMM conference on Internet measurement - IMC ’07. New York, New York, USA: ACM Press, Oct. 2007, p. 29. [Online]. Available: http: //dl.acm.org/citation.cfm?id=1298306.1298311 A. Afrasiabi Rad and M. Benyoucef, “Similarity and Ties in Social Networks: a Study of the {YouTube} Social Network,” Proceedings of the Conference for Information Systems Applied Research, vol. 6, pp. 1–11, 2013. P. Pons and M. Latapy, “Computing communities in large networks using random walks,” Journal of Graph Algorithms and Applications, vol. 10, no. 2, pp. 191–218, 2006. X. Cheng, C. Dale, and J. Liu, “Statistics and Social Network of YouTube Videos,” in 2008 16th Interntional Workshop on Quality of Service. IEEE, Jun. 2008, pp. 229–238. [Online]. Available: http://ieeexplore.ieee.org/articleDetails.jsp?arnumber=4539688
Mesoscopic topological properties Community size distribution
Power-Law (α = 3.14)
Power-Law (α = 3.16)
Membership distribution
Power-Law (α = 3.01)
Power-Law (α = 3.12)
Overlaps size distribution
Power-Law (α = 3.2)
Power-Law (α = 2.57)
[5] D. Rotman, J. Golbeck, and J. Preece, “The community is where the rapport is – on sense and structure in the youtube community,” in Proceedings of the fourth international conference on Communities and technologies - C&T ’09. New York, New York, USA: ACM Press, Jun. 2009, p. 41. [Online]. Available: http://dl.acm.org/citation.cfm?id=1556460.1556467 [6] J. Xie and B. K. Szymanski, “Towards Linear Time Overlapping Community Detection in Social Networks,” in The 16th Pacific-Asia Conference on Knowledge Discovery and Data Mining (PAKDD), 2012, pp. 25–36. [7] J. Xie, S. Kelley, and B. K. Szymanski, “Overlapping community detection in networks: The state-of-the-art and comparative study,” ACM Comput. Surv., vol. 45, no. 4, pp. 43:1–43:35, Aug. 2013. [8] M. Mitzenmacher, “A brief history of generative models for power law and lognormal distributions,” Internet Mathematics, vol. 1, no. 2, pp. 226–251, 2004. [Online]. Available: http: //www.eecs.harvard.edu/∼michaelm/CS223/powerlaw.pdf [9] X.-Q. Cheng, F.-X. Ren, S. Zhou, and M.-B. Hu, “Triangular clustering in document networks,” New Journal of Physics, vol. 11, no. 3, p. 033019, Mar. 2009. [Online]. Available: http://arxiv.org/abs/0807.2113 [10] D. Brian, V. Benjamin, and H. Wei, “A genetic algorithm for identifying overlapping communities in social networks using an optimized search space,” Social Networking, no. 2, pp. 193–201, 2013. [Online]. Available: http://www.scirp.org/journal/ PaperInformation.aspx?PaperID=38805 [11] G. K. Orman, V. Labatut, and H. Cherifi, “Comparative evaluation of community detection algorithms: A topological approach,” CoRR, vol. abs/1206.4987, 2012. [Online]. Available: http://dblp.uni-trier.de/ db/journals/corr/corr1206.html#abs-1206-4987 [12] A. Lancichinetti, S. Fortunato, and J. Kert´esz, “Detecting the overlapping and hierarchical community structure in complex networks,” New Journal of Physics, vol. 11, no. 3, p. 033015, 2009. [Online]. Available: http://stacks.iop.org/1367-2630/11/i=3/a= 033015?key=crossref.10a0c9c4b54720787488289cc0fb9f78 [13] G. Palla, I. Der´enyi, I. Farkas, and T. Vicsek, “Uncovering the overlapping community structure of complex networks in nature and society.” Nature, vol. 435, no. 7043, pp. 814–8, Jun. 2005. [Online]. Available: http://dx.doi.org/10.1038/nature03607 [14] M. Jebabli, H. Cherifi, C. Cherifi, and A. Hammouda, “Overlapping community structure in co-authorship networks: A case study,” in u- and e- Service, Science and Technology (UNESST), 2014 7th International Conference on, Dec 2014, pp. 26–29. [Online]. Available: http://arxiv.org/abs/1504.00247