and laptop computers is often performed through two input ... during interaction with laptops and desktop computers. ..... New York, NY, USA: ACM, 2011, pp.
User Authentication Through Biometric Sensors and Decision Fusion Sayandeep Acharya∗ , Lex Fridman∗ , Patrick Brennan† , Patrick Juola† , Rachel Greenstadt∗ and Moshe Kam∗ ∗ Drexel
University Philadelphia, PA Email: {sa427, lexfridman, greenie, moshe.kam}@drexel.edu † Juola & Associates Pittsburgh, PA 15282 Email: {pjuola, pbrennan}@juolaassoc.com Abstract—The interaction between humans and most desktop and laptop computers is often performed through two input devices: the keyboard and the mouse. Continuous tracking of these devices provides an opportunity to verify the identity of a user, based on a profile of behavioral biometrics from the user’s previous interaction with these devices. We propose a bank of sensors, each feeding a binary detector (trying to distinguish the authentic user from all others). In this study the detectors use features derived from the keyboard and the mouse, and their decisions are fused to develop a global authentication decision. The binary classification of the individual features is developed using Naive Bayes Classifiers which play the role of local detectors in a parallel binary decision fusion architecture. The conclusion of each classifier (’authentic user’ or ’other’) is sent to a Decision Fusion Center (DFC) where we use the Neyman-Pearson criterion to maximize the probability of detection under an upper bound on the probability of false alarms. We compute the receiver operating characteristic (ROC) of the resulting detection scheme, and use the ROC to assess the contribution of each individual sensor to the quality of the global decision on user authenticity. In this manner we identify the characteristics (and local detectors) that are most significant to the development of correct user authentication. While the false accept rate (FAR) and false reject rate (FRR) are fixed for the local sensors, the fusion center provides trade-off between the two global error rates, and allows the designer to fix an operating point based on his/her tolerance level of false alarms. We test our approach on a real-world dataset collected from 10 office workers, who worked for a week in an office environment as we tracked their keyboard dynamics and mouse movements during interaction with laptops and desktop computers. Keywords—Decision Fusion, Behavioral Biometrics, Active Authentication, Binary Classification.
collected during previous interaction with the computer, or updated based on known-user behavior. Due to the unconstrained nature of human-computer interaction, a single biometric is usually not sufficiently robust to determine the user’s identity. For that reason, many active authentication systems are (a) multi-modality, namely they monitor multiple features of a single type of biometric [3], and (b) multi-biometric, namely they consider more than one type of biometric [4]. In this study we consider multi-modality multi-biometric model for interaction with a computer through a mouse and keyboard. We evaluated our algorithms using a dataset collected from office workers in a real-world office environment. Each user is represented through features collected from the user’s keyboard dynamics and mouse movements. We fuse these features using established algorithms for parallel binary decision fusion [5], [6]. The Receiver Operating Characteristic (ROC) helps quantify the relative importance of each biometric and each feature. In §II, we discuss work on active authentication, multibiometric system, and the tracking of mouse movement and keyboard dynamics. In §III, we describe the biometric dataset used in this study and the classifiers that mapped the data from feature space to decision space. In §IV, we discuss the decision fusion approach that combines the decisions of local sensors. In §V, we present the global performance provided by the Decision Fusion Center. We also estimate the contribution of each feature to the quality of the final decision. II.
I.
I NTRODUCTION
The tracking of behavioral biometrics for continuous verification of a user’s identity has received considerable attention in recent years [1]. By monitoring actively metrics such as keyboard dynamics and mouse movements, classification of user as authentic or non-authentic has achieved accuracy on par with more traditional non-continuous approaches [2]. One popular non-continuous approach is for the user to verify his/her identity by typing a password or a common fixed phrase. The authentication system then estimates whether the user is who s/he claims to be by analyzing the biometric parameters associated with the typing of the password/phrase. Continuous ”active authentication”, on the other hand performs verification of the user steadily, based on a set of metrics
U SER AUTHENTICATION VIA B IOMETRICS
A. Mouse and Keyboard Dynamics The movement dynamics of the mouse and the keyboard of a personal computer have been studied for over two decades [7], [8] as the primary human computer interface input devices. Keystroke dynamics have received most of the attention in behavioral biometrics studies [9]. The two basic tracked features of inter-key-press interval [10] and key-press dwell [11] were used as the basis for more complex features such as digraph latency [12], trigraph latency [13], or keyword latency [14]. These features provide timing information about a specific configuration of key-press and key-release events. Mouse movement in the authentication domain has received considerably less attention until recently [15]. Mouse
B. Multi-Biometric Systems In the context of continuous authentication, multi-modality biometrics use multiple asynchronous streams of features to form a sequence of fused verification decisions. There are several approaches to categorize multi-biometric systems [23]. Most relevant to the approach in this paper is division of continuous fusion by Sanderson and Paliwal into: (1) premapping, (2) midst-mapping, and (3) post-mapping [24]. Here ”mapping” refers to the transformation from data into information (e.g, from the feature space to the decision space). While pre-mapping fusion has been extensively studied in other applications [25], in the authentication domain, the feature space is so varied (and often restricted by privacy concerns) that midst-mapping or post-mapping fusion have been preferred. We use the post-mapping (or decision fusion) approach in this study. III.
E XPERIMENTAL S ETUP
A. Dataset The dataset used in our study comes from 10 users in a simulated work environment. The users were tracked throughout a working week (5 sequential days) in their use of the mouse and
9
8
7
6
5
4
3
2
1
0
Most single-modality classifiers considered for mouse and keyboard use statistical methods [19] such as Naive Bayes, decision trees, linear discrimination analysis and support vector machines [21]. Some classifiers use trained neural networks [20]. In this paper our local detectors are Naive Bayes classifiers [22] due to their robustness to the relatively small amount of training data needed and the ease of design and implementation.
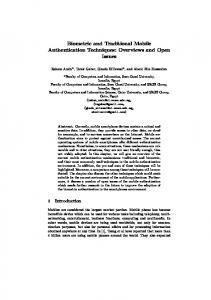
Normalized number of events for user
movement signals are relatively noisy, requiring large testing windows for authentication [16]. Zheng et al. [17] were the first to show meaningful results based on testing windows as small as 20 mouse clicks. Jorgensen and Yu [18] studied shorttime window continuous authentication and used touch-based mouse devices.
Users
Fig. 2: The relative amount of biometric data per-type per-user extracted from the interaction of each user with their computer throughout the 5-day week. The variability between the users is noticeable.
keyboard as they sought to accomplish various writing tasks such as summarizing online opinion articles. The productivity, task-selection, and mouse/keyboard use ratio varied from user to user as shown in Fig. 1 and Fig. 2. A tracking application logged two types of behavioral biometrics on the granularity of 5 milliseconds: •
Mouse movement, mouse click, and mouse scroll wheel events.
•
Keystroke dynamics (include press, hold, release durations) for all keyboard keys including special keys.
Table I shows statistics on the biometric data in the dataset. The table contains data aggregated over all 10 users and all of the available user-days. The keystroke events include both the alpha-numeric keys and special keys such as shift, backspace, ctrl and alt. TABLE I: Statistics on the 10-user dataset. Metric Sensor 1: Sensor 2. Sensor 3: Sensor 4:
✕✓ ✔ ✖✓
Keystroke Dwell Time Keystroke Interval Time Mouse Curvature Distance Mouse Curvature Angle
Total 915,624 750,253 3,462,912 3,462,912
TABLE II: The total quantity of features extracted from the raw data for each of the four sensors. The number of keystroke intervals is significantly less than keystroke dwell time because only intervals that were part of bursts of continuous typing were collected. ✑ ✒ ✏✍✎ ☞✌ ☛
✁
✂
✄
☎
✆ ✝ ✙✗✘✚✗
✞
✟
✠
✡
Fig. 1: The duration (in seconds) of each user’s interaction with the computer throughout the 5-day week with idle periods removed. An idle period is defined as a continuous period of time without any mouse or keyboard interaction with the computer.
B. Feature Classification Data from each user were broken down into three segments relative to the duration of each user’s non-idle periods of activity (see Fig. 1): 1)
Training Segment: for the construction of the empirical feature distribution;
where H1 is the “authentic” class, H0 is the “non-authentic” class, discussed further in §IV, and H ∗ is the most likely class associated with the observed biometric data. Given the openworld model considered in this paper, for the local sensor classifiers, we considered P (H0 ) = P (H1 ) = 0.5. The feature probability P (xt |Hi ) is estimated by a non-parametric distribution (like the one in Fig. 3). IV.
Fig. 3: An example of a histogram constructed from the training set for the empirical probability distribution of user 0 for the “Keystroke Dwell Time” feature (sensor 1).
2) 3)
Characterization Segment: for the estimation of the FAR and FRR rates of the sensor for the use by the Decision Fusion Center (DFC); and Testing Segment: for the estimation of the local sensor performance compared to the fused sensor performance.
For each user we trained the classifier on the first 60% of the data, characterized the error rates of the trained classifier on the following 20%, and tested the local and the fused sensors on the remaining 20%. For each local sensor, we use the Naive Bayes Classifier [26] for mapping from the feature space to the decision space. This classifier is constructed during the training phase and used for binary classification in the characterization and testing phases. In the training phase, the empirical distribution for feature probabilities are constructed from the frequency of each feature in the training segment of each user’s data. An example histogram-based distribution for the “keystroke dwell time” metric for the first user is shown in Fig. 3. It shows the estimated probability of dwell time (in seconds). Two such histograms are constructed for each user j. The first histogram was constructed from the training segment of the data of that user. The second histogram was constructed from all the training segments of the other users. This latter set of training segments is meant to represent all other computer users. These two histograms are the empirical feature distributions associated with each user. In the characterization and testing phases, for each user and each metric, the Naive Bayes Classifier considers a collection of ω (set to 10 in this paper) most recent events {x1 , x2 , ..., xω } associated with that metric (e.g, keystroke dwell time). It then uses the maximum a posteriori (MAP) rule to pick the most likely hypothesis:
D ECISION F USION
We employ a decentralized parallel binary decision fusion [5], [6] scheme to integrate a set of ”local” binary decisions to a global binary decision. The local detectors are designed as binary Naive Bayes Classifiers each attached to a single feature of the mouse or the keyboard. The ith local detector is characterized by its probability of correct detection (PDi = 1 − PMi ; accepting hypothesis H1 when hypothesis H1 is true) and its probability of false alarm (PFi ; accepting H1 when H0 is true). Here we selected to design a Decision Fusion Center (DFC) that integrates the local decisions in the Neyman-Pearson sense [6]: for an upper bound on the global probability of false alarm, the DFC maximizes the global probability of detection. The distributed decision fusion scheme is depicted in Fig. 4. It involves 4 different sensors (2 Mouse and 2 Keyboard) shown in Table I, each connected to a local detector that announces whether or not the user is authentic. The experimental setup involved collecting data from 10 users and creating 10 schemes (local detectors and a Decision Fusion Center), each one designed to identify one of the 10 users and reject all others. The j th DFC, (j = 1, ..., 10) distinguishes the hypothesis (H1 = User j is present; against H0 = User j is not present). Each sensor, designed as a Naive Bayes Classifier uses its own observations to decide on the hypothesis for the corresponding user. The local decisions are of the form � 1, if H1 is accepted (user is authentic) ui = (2) −1, if H0 is accepted (user is non-authentic) The DFC performs a Neyman-Pearson test [27] for fusion and for each user it functions the same way; the DFC for the j th user takes in the four local decisions and calculates the likelihood ratio for n sensors (in this study, n = 4); Λ(uj ) =
P (uj1 , ..., ujn |H1 )
H1 ≷ t∗j . j j P (u1 , ..., un |H0 ) H0
Local Detectors Local Decisions Keyboard Sensor 1
Keyboard Sensor 2
Mouse sensor 1
User j DFC
Fused Decision (User j, Not User j)
Mouse Sensor 2
H ∗ = argmax P (Hi ) i∈{0,1}
ω Y t
P (xt |Hi ),
(1)
Fig. 4: Behavioral Sensor Fusion Scheme
(3)
Acceptance or False Alarm Rate (FA) of the ith sensor respectively in the j th user fusion system. The global conditional distributions P (Λ(uj )|H0 ) and P (Λ(uj )|H1 ) can therefore be obtained by multiplying the abscissae and ordinates of the individual distributions (4). As the global conditional distributions are discrete, only certain global false alarm values would be possible which would make the ROC contain a collection of disjoint points. To allow realization of an intermediate False Alarm rate, the DFC employs a randomized Neyman-Pearson test and computes the probability of using (one of the two) thresholds accordingly. As the specified global False Alarm Rate PF A varies from 0 to 1, the global Detection Rate (PD = 1 − PM ) is calculated to create the Receiver Operating Characteristic (ROC). Fig. 5: Local Likelihood distribution under H0
V.
R ESULTS
The fusion setup used for generating the ROC curves is shown in Fig. 4. The 4 sensors are assumed to be fixed Naive Bayes Classifiers and the DFC performs a Neyman-Pearson test to fuse the local detector decisions. A total of 10 users and 10 systems were tested. To compare the contributions of each sensor towards the fused result, each sensor was removed (one at a time) and the ROC curve of the resultant system generated.
Fig. 6: Local Likelihood distribution under H1
Assuming that the local decisions are independent (conditioned on the hypothesis), we have Λ(uj ) =
n Y P (uj1 |H1 ) j j=1 P (u1 |H0 )
× ... ×
P (ujn |H1 )
H1 ≷ t∗j j P (un |H0 ) H0
Fig. 7 shows the ROC for user 1. Fig. 8 shows a zoomed-in version of same plot. It is noticeable that fusion is profitable and produces the highest possible global detection rates for given false alarm rates. All the sensors are very similar in performance and therefore have comparable marginal contribution to the global performance. Similar results were obtained for the Decision Fusion Centers designed for the remaining 9 users. In general this approach of using ROC curves for sensor analysis can help in creating a hierarchy of sensor importance such that for a known tolerable global false alarm, the appropriate groups of sensors could be identified and used (and some sensors of only marginal contribution can be dropped). 1
(4)
0.9
t∗j
Λ(uj )≥t∗ j
Once the threshold t∗j is determined, the global probability of G detection (PD j ) at the DFC for the j th user becomes X G PD j = P (Λ(uj )|H1 ) (6) Λ(uj )≥t∗ j
Since the local decisions are binary in nature, the probability distributions of individual sensor likelihoods are discrete. The conditional distributions for the ith sensor in the fusion system for the j th user as represented by P (Λ(uji )|H0 ) and j P (Λ(uji )|H1 ) are shown in Fig. 5 and Fig. 6 where PM , PFj i i are the False Rejection or Misdetection Rate (MD) and False
0.8 0.7 Detection Rate, PD
where the threshold is computed such that the global false G alarm at the DFC for the j th user (PF Aj ) is αj . In other words, ∗ tj is obtained such that X P (Λ(uj )|H0 ) = αj (5)
0.6 0.5 0.4 0.3 All 4 Without Sensor 4 Without Sensor 3 Without Sensor 2 Without Sensor 1
0.2 0.1 0
0
0.1
0.2
0.3
0.4 0.5 0.6 0.7 False Alarm Rate, PFA
0.8
0.9
1
Fig. 7: ROC curves for incremental and global sensor fusion with one sensor taken out at a time
Intermediate NP Fusion with global performance as good as the best local sensor
1
Local Detectors
0.95
Detection Rate, PD
Local Decisions
0.9
Keyboard Sensor 1
0.85
Keybaord Sensor 2
Keyboard DFC
User j DFC
0.8 Mouse sensor 1
0.75
All 4 Without Sensor 4 Without Sensor 3 Without Sensor 2 Without Sensor 1
0.65 0.6
0
0.05
0.1 0.15 0.2 False Alarm Rate, PFA
(User j, Not User j)
Mouse DFC
Mouse Sensor 2
0.7
Fused Decision
Fig. 10: Multilevel Decision Fusion
0.25
1 With Intermediate Fusion Without Intermediate Fusion
0.9
Fig. 8: Zoomed in version of Figure. 7
0.8
Detection Rate, PD
0.7 1 0.95
Detection Rate, PD
0.9
0.6 0.5 0.4 0.3
0.85
0.2 0.8
0.1 0.75
0
0
0.1
0.2
0.3
0.7 All 4 Without Mouse Sensors Without Keyboard Sensors
0.65 0.6
0
0.05
0.1 0.15 False Alarm Rate, PFA
0.2
0.4 0.5 0.6 0.7 False Alarm Rate, PFA
0.8
0.9
1
Fig. 11: ROC for 2 step fusion
0.25
Fig. 9: ROC curves for incremental sensor fusion with mouse and keyboard sensors removed at a time
Fig. 9 shows the resultant ROC curves when either the two mouse sensors or the two keyboard sensors were removed incrementally. For small values of global false alarm rates, it is observable that removing the keyboard sensors and combining just the mouse sensors degrades the global performance more than removing the mouse sensors and combining only the keyboard sensors. A. Multilevel Fusion We may ask, how much would performance be affected when decisions associated with the same kind of sensors are combined first and then the results of such intermediate fusions are fused by the main DFC. In the fusion scheme shown in Fig. 10 all the mouse and keyboard sensors, were combined first, separately, using Neyman-Pearson criterion; the outputs were then fused at the main DFC. The false alarm at the
intermediate fusion centers were chosen the same as the false alarm of best individual sensor of that class. For user 1, Fig. 11 shows the resultant ROC curves at the User DFC. Not surprisingly, performing intermediate fusion degrades the overall system performance for low values of False Alarm rate. VI.
C ONCLUSION
We illustrated the use of behavioral sensors towards active authentication of users of computer systems. Four (4) behavioral features based on mouse and keyboard usage were used to train 4 classifiers which then became part of a distributed fusion scheme. Each classifier (”local detector”) generated decisions on the hypothesis set, authenticating (or refusing to authenticate) a particular user, and the DFC then performed a Neyman-Pearson test for a final authenticate/non-authenticate decision. ROC curves for the various DFCs were generated, which revealed a hierarchy of sensor importance and would be helpful in identifying economical groups of sensors to be used in user authentication. In future work, a wider variety of features would be included and an attempt will be made to tune
the local detectors better toward improving the performance of the DFC.
[20]
R EFERENCES
[21]
[1]
[2]
[3]
[4]
[5]
[6]
[7]
[8]
[9]
[10]
[11]
[12]
[13]
[14] [15]
[16]
[17]
[18]
[19]
Y. Sui, X. Zou, E. Du, and F. Li, “Secure and privacy-preserving biometrics based active authentication,” in IEEE International Conference on Systems, Man, and Cybernetics (SMC). IEEE, 2012, pp. 1291–1296. S. Banerjee and D. Woodard, “Biometric authentication and identification using keystroke dynamics: A survey,” Journal of Pattern Recognition Research, vol. 7, pp. 116–139, 2012. A. Ross and A. Jain, “Multimodal biometrics: An overview,” in Proceedings of 12th European Signal Processing Conference, 2004, pp. 1221–1224. J. Cui, J. Li, and X. Lu, “Study on multi-biometric feature fusion and recognition model,” in International Conference on Apperceiving Computing and Intelligence Analysis (ICACIA). IEEE, 2008, pp. 66– 69. Z. Chair and P. Varshney, “Optimal data fusion in multiple sensor detection systems,” Aerospace and Electronic Systems, IEEE Transactions on, vol. AES-22, no. 1, pp. 98 –101, jan. 1986. S. Thomopoulos, R. Viswanathan, and D. Bougoulias, “Optimal decision fusion in multiple sensor systems,” Aerospace and Electronic Systems, IEEE Transactions on, vol. AES-23, no. 5, pp. 644 –653, sept. 1987. S. Bleha, C. Slivinsky, and B. Hussien, “Computer-access security systems using keystroke dynamics,” IEEE Transactions on Pattern Analysis and Machine Intelligence, vol. 12, no. 12, pp. 1217–1222, 1990. K. STUART, K. William, and J. BETTY, “Evaluation of mouse, ratecontrolled isometric joystick, step keys, and text keys for text selection on a crt,” Ergonomics, vol. 21, no. 8, pp. 601–613, 1978. M. Karnan, M. Akila, and N. Krishnaraj, “Biometric personal authentication using keystroke dynamics: A review,” Applied Soft Computing, vol. 11, no. 2, pp. 1565–1573, 2011. N. Bartlow and B. Cukic, “Evaluating the reliability of credential hardening through keystroke dynamics,” in International Symposium on Software Reliability Engineering (ISSRE). IEEE, 2006, pp. 117–126. R. Giot, M. El-Abed, and C. Rosenberger, “Keystroke dynamics authentication for collaborative systems,” in International Symposium on Collaborative Technologies and Systems (CTS). IEEE, 2009, pp. 172– 179. F. Monrose and A. Rubin, “Keystroke dynamics as a biometric for authentication,” Future Generation Computer Systems, vol. 16, no. 4, pp. 351–359, 2000. M. Chora´s and P. Mroczkowski, “Keystroke dynamics for biometrics identification,” Adaptive and Natural Computing Algorithms, pp. 424– 431, 2007. P. Mroczkowski, “Identity verification using keyboard statistics.” Ph.D. dissertation, Link¨oping, 2004. M. Pusara and C. Brodley, “User re-authentication via mouse movements,” in Proceedings of the 2004 ACM workshop on Visualization and data mining for computer security. ACM, 2004, pp. 1–8. A. Ahmed and I. Traore, “A new biometric technology based on mouse dynamics,” Dependable and Secure Computing, IEEE Transactions on, vol. 4, no. 3, pp. 165 –179, july-sept. 2007. N. Zheng, A. Paloski, and H. Wang, “An efficient user verification system via mouse movements,” in Proceedings of the 18th ACM conference on Computer and communications security, ser. CCS ’11. New York, NY, USA: ACM, 2011, pp. 139–150. [Online]. Available: http://doi.acm.org/10.1145/2046707.2046725 Z. Jorgensen and T. Yu, “On mouse dynamics as a behavioral biometric for authentication,” in Proceedings of the 6th ACM Symposium on Information, Computer and Communications Security. ACM, 2011, pp. 476–482. D. Umphress and G. Williams, “Identity verification through keyboard characteristics,” International journal of man-machine studies, vol. 23, no. 3, pp. 263–273, 1985.
[22]
[23] [24]
[25] [26]
[27]
S. Bleha, J. Knopp, and M. Obaidat, “Performance of the perceptron algorithm for the classification of computer users,” in Proceedings of the 1992 ACM/SIGAPP symposium on Applied computing: technological challenges of the 1990’s. ACM, 1992, pp. 863–866. N. Boulgouris, K. Plataniotis, and E. Micheli-Tzanakou, Biometrics: theory, methods, and applications. Wiley-IEEE Press, 2009, vol. 9. Q. Tao and R. Veldhuis, “Robust biometric score fusion by naive likelihood ratio via receiver operating characteristics,” Information Forensics and Security, IEEE Transactions on, vol. PP, no. 99, p. 1, 2012. S. Sahoo, T. Choubisa et al., “Multimodal biometric person authentication: A review,” IETE Technical Review, vol. 29, no. 1, p. 54, 2012. C. Sanderson and K. Paliwal, “Identity verification using speech and face information,” Digital Signal Processing, vol. 14, no. 5, pp. 449– 480, 2004. D. Hall and J. Llinas, Multisensor Data Fusion, -2 Volume Set. CRC, 2001. A. Jordan, “On discriminative vs. generative classifiers: A comparison of logistic regression and naive bayes,” Advances in neural information processing systems, vol. 14, p. 841, 2002. H. L. V. Trees, Detection, Estimation, and Modulation Theory. Wiley, 2004.


![Strengthening User Authentication through Opportunistic ... - CiteSeerX [PDF]](https://m.moam.info/img/260x300/strengthening-user-authentication-through-opportun_64b6c178098a9e92298b463e.jpg)
