We propose the implicative rating measure KnnIR (K nearest neighbors based implicative rating) to predict the ratings that can be given by the active user ua for ...
(IJACSA) International Journal of Advanced Computer Science and Applications, Vol. 8, No. 11, 2017
User based Recommender Systems using Implicative Rating Measure Lan Phuong Phan College of Information and Communication Technology Can Tho University Can Tho, Viet Nam
Hung Huu Huynh
Hiep Xuan Huynh
University of Science and Technology University of Da Nang Da Nang, Viet Nam
College of Information and Communication Technology Can Tho University Can Tho, Viet Nam
Abstract—This paper proposes the implicative rating measure developed on the typicality measure. The paper also proposes a new recommendation model presenting the top N items to the active users. The proposed model is based on the user-based collaborative filtering approach using the implicative intensity measure to find the nearest neighbors of the active users, and the proposed measure to predict users’ ratings for items. The model is evaluated on two datasets MovieLens and CourseRegistration, and compared to some existing models such as: the item based collaborative filtering model using the Jaccard measure, the user based collaborative filtering model using Jaccard measure, the popular items based model, the latent factor based model, and the association rule based model using the confidence measure. The experimental results show that the performance of the proposed model is better when compared to other five models. Keywords—Implicative rating measure; recommender system; user-based collaborative filtering
I.
INTRODUCTION
Recommender systems/recommendation systems (RSs) [1] are techniques or software tools embedded in an application or website to predict the preferences of an individual or a group of users for a specific product or service; and/or to recommend the appropriate products or services to an individual or a group of users, thereby reducing the information overload. Currently, the recommendation systems are applied in many areas of life [2] such as e-commerce, e-learning, e-services, etc. The techniques (methods) of recommendation are based on the ones used in data mining and machine learning [3], [4] such as classification, clustering, association rule mining, regression models, or some of the supervised or unsupervised learning methods. Recommendation techniques are divided into two main classes: the class of basic techniques such as collaborative filtering, content filtering or hybrid; and the class of techniques developed on the basic techniques and the additional data such as the contextual information or the social information. Recommendation systems can be classified into different groups [2], [3], [5]: content based, collaborative, demographic based, knowledge based, hybrid, context based, social based, and group based. In the fields of research on recommendation systems, proposing the new recommendation models or improving the existing recommendation methods has still been the mainstream of research and received the most attention.
In recommendation techniques, collaborative filtering [1], [6]-[8] is the most important and widely used technique. A collaborative filtering system provides recommendations to an active user based on the assumption that similar users like similar items or a user prefers similar items. Therefore, the core component of collaborative filtering is the use of measures to find items or users with strong relationships, to predict ratings, and then to recommend the most relevant items to the active users. Statistical implicative analysis is a method of data analysis initiated by Gras [9] to study the trends among data attributes [10]. Statistical implicative analysis is applied in many areas such as psychology, education, bioinformatics, knowledge management, art history, etc. [10], [11]. In this method, statistical implicative measures are used to detect the strong relationships, or to measure the typicality of an object for the formation of a relationship, or to measure the responsibility of an object for the existence of a relationship. Therefore, statistical implicative measures can be used to develop the collaborative filtering systems. This paper proposes a new recommendation model based on user-based collaborative filtering and the implicative rating measure to present to the active users the top N items. In the proposed model, the matrix of binary ratings is used as the main input; the implicative intensity is used to find the nearest neighbors of the active users; and the implicative rating measure developed on the typicality measure is used to predict users’ ratings for items. The remaining of the paper is organized into four sections. Section 2 descripts the statistical implicative measures briefly. Section 3 not only proposes the implicative rating measure developed on the above mentioned measures, but also proposes the recommendation model using the user based collaborative filtering approach and the implicative rating measure. Section 4 presents the experimental results and the discussion of those results. Section 5 is the conclusions. II. STATISTICAL IMPLICATIVE MEASURES A. Implicative Intensity Let be a set of n objects described by a finite set of binary attributes . Let AE be a subset of objects with the attribute a. Let BE be a subset of objects with the attribute b; B_ be the complement of ; na=card(A) be the number of elements of A;
37 | P a g e www.ijacsa.thesai.org
(IJACSA) International Journal of Advanced Computer Science and Applications, Vol. 8, No. 11, 2017
Let I={i1, i2, …, im} be a set of items (e.g. products, movies, etc.).
nb=card(B) be the number of elements of B, nb_=n-nb be the number of elements of B_; and nab_=card(AB_) be the number of objects that has the attribute a but does not have the attribute b. Let X and Y be two random sets with the element numbers to be na and nb respectively.
Let R=(rjk) where j=1..n and k=1..m be a rating matrix storing the feedbacks of users on items. rjk=1 if the user uj likes the item k; rjk=0 if the user uj does not like (or know) the item k.
The random variable card(XY_) follows the Poisson distribution with the parameter =nanb_/n. The probability of the card(XY_) card(AB_) is defined by (1). Pr(card(XY_) card(AB_))= s=0card(AB_)(s/s!)e-
For nb_0, the random variable card(XY_) is normalized to the random variable Q(a,b_) as (2). In experiment, the observed value of Q(a,b_) is represented by q(a,b_) and is defined according to (3). q(a,b_) is called the implicative index.
Q(a,b_)=(card(XY_) – na nb_/n)/sqrt(na nb_/n)
q(a,b_)=(nab_ – na nb_/n)/sqrt(na nb_/n)
Let f: U x I R be a function that maps the user-item combinations to the ratings r. The objective of the proposed model is to find a function f’: U x I R’ such that the performance (e.g. the precision and the recall) of the model is better when compared to some other models.
u1 u2 … un ua
The implicative intensity [9] of the relationship a b is defined by (4).
(a,b)=1 – Pr(Q(a,b_) q(a,b_)) if nb n (a,b)=0 otherwise
(i,a b)=1 – d1(i,a b) / maxjE d1(j,a b)
d1(j, a b) is the distance between the object i and the relationship a b. The value of d1(j, a b) is calculated by formula (6) where (a,b) is the implicative intensity of a b and i,ab is the contribution (the responsibility) of the object i for the existence of the relationship a b. d1(i,a b)= (((a,b) – i,ab/ (1 - (a,b)))1/2
The contribution i,ab is defined by (7) where a(i) (resp. b(i)) is the binary value which characterizes the presence/ absence of the attribute a (resp.b) for object i.
i,ab = 1 if [a(i)=1 or a(i)=0] and b(i)=1
In practice, p is set to the neutral value 0.5. III. USER-BASED RECOMMENDATION MODEL USING IMPLICATIVE RATING MEASURE Like the two-dimensional recommendation problem [7], the proposed recommendation model can be formalized by the follows: Let U={u1, u2, …, un} be a set of users.
… … … … … …
im 0 0 … 1
.u2 u.a un.
k=3
. u9
.
u11
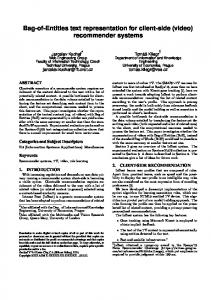
The measures: (1) implicative intensity used for finding k nearest neighbors; (2) implicative rating build on the typicality measure used for predicting ratings
The predicted ratings i1 i2 … im ua ra1 ra2 … ram
Fig. 1. The sketch of the proposed recommendation model.
The proposed recommendation model is sketched as Fig. 1. This model uses the user-based collaborative filtering approach and the implicative rating measure to recommend the top N items to the active user as described in Algorithm 1. During the recommendation process, the model will also use Algorithms 2 and Algorithm 3. A. Implicative Rating Measure We propose the implicative rating measure KnnIR (K nearest neighbors based implicative rating) to predict the ratings that can be given by the active user ua for each item iI. KnnIR is built on the typicality measure and defined in formula (8).
i,ab = 0 if [a(i)=1 and b(i)=0 i,ab = p]0,1[ if a(i)=b(i)=0
i2 1 1 … 0 1
The top N items to be recommended to ua {i1, …, i13} ua
B. Typicality To measure the typicality of an object i for the formation of the relationship a b, the typicality is proposed as (5) [9].
i1 1 0 … 1
The relationship a b is admissible for a given threshold if (a,b) .
u.1
u.15
KnnIR(ua, i)=KIR(ua,i) / maxlI KIR(ua,l)
KIR(ua, i)= j=1k (i,ua uj) if R(uj,i)=1
Where
k is the number of nearest neighbors; and (i,ua uj) is the typicality of item i for the relationship formation ua uj. B. Recommending the Top N Items to the Active User The inputs of Algorithm 1 (recommending the top N items to the active user – UBCFImplicativeRS) are: the vector A of size m representing the active user ua with given known ratings; the rating matrix R of U users and I items; and k nearest neighbors. Its output is the list of top N items to be
38 | P a g e www.ijacsa.thesai.org
(IJACSA) International Journal of Advanced Computer Science and Applications, Vol. 8, No. 11, 2017
recommended to the active user ua. The processing steps of Algorithm 1 are as follows:
nb = 0; nab_= 0; for each ijI do { na += R[ua,ij]; nb += R[ui, ij]; nab += R[ua, ij]*R[ui, ij]; } nab_ = na – nab; lambda = na*(n-nb)/n; for s=0 to nab_ do sum += (lambda^s/fact(s))*exp(-lambda); p = 1 – sum; IIntensity = bindRow(IIntensity,p);
Calculating the implicative intensity of the relationship between the user ua and a user uiU according to Algorithm 2. Identifying k nearest neighbors of ua that have the highest implicative intensity values. Calculating the typicality value of each item ijI for the formation of relationship (ua,ui) where ui is one of k nearest neighbors of ua according to Algorithm 3. Predicting the rating value for each item ijI based on the implicative rating measure. Removing the given known items of ua from the predicted list. Sorting the filtered list in descending order and recommending the top N items to the active user ua. UBCFImplicativeRS (vector A, ratingmatrix R, int k) { IIntensity = calculateImplicativeIntensity(A,R); Neighbors = findKNearestNeighbors(IIntensity, k); Typic = calculateTypicality(A, Neighbors,R,IIntensity); for each ijI do KIR[ua,ij]
=
sumColumn(Typic[Neighbors,ij] *R[Neighbors,ij]);
KnnIR[ua,] = KIR[ua,]/maxRow(KIR[ua,];
return Reclist; } C. Calculating the Implicative Intensity of Relationship (Ua,Ui) The inputs of Algorithm 2 (calculating the implicative intensity of relationship (ua,ui) – calculateImplicativeIntensity) are: the vector A of size m representing the active user ua with given known ratings; and the rating matrix R of U users and I items. The output of this algorithm is the implicative intensity of relationship (ua,ui) with uiU. Algorithm 2 conducts the following steps: Finding the values n, na, nb and nab_ which represent the implicative relationship between two users ua and ui. Calculating the implicative intensity of (ua,ui) using formula (4). calculateImplicativeIntensity(vector A, ratingmatrix R) {
for each
do {
sum = 0; n = countColumn(R); na = 0;
D. Calculating the Typicality of an Item for the Formation of a Relationship Algorithm 3 (calculateTypicality) gets the following inputs: the vector A of size m representing the active user ua with given known ratings; the vector Neighbors consisting of k nearest neighbors of ua; the rating matrix R of U users and I items; and the vector IIntensity containing the implicative intensity values of the relationship (ua, ui) with uiU. This algorithm outputs the matrix Typicality consisting of the typical values of item ijI for the relationship formation (ua, ui) with uiNeighbors. The processing steps of Algorithm 3 are as follows: Filtering the rating matrix R that only contains the ratings of k nearest neighbors of ua.
Calculating the contribution of item ij for the existence of relationship (ua,ui) with uiNeighbors according to formula (7).
Reclist = getTopNItems(Filteredlist);
IIntensity=Null;
}
Filtering the vector IIntensity that only consists of the implicative intensity of k nearest neighbors of ua.
Filteredlist = removeKnownRatings(A, KnnIR);
R =bindRow(R, A);
} return IIntensity;
Calculating the distance from ij to the relationship (ua,ui) with uiNeighbors according to formula (6). Finding the typical value of item ij for relationship formation (ua,ui) with uiNeighbors according to formula (5). calculateTypicality(A, Neighbors,R,IIntensity) { R = R[Neighbors, ]; IIntensity = IIntensity[Neighbors]; for each uiNeighbors do for each item ijI do { if (R[ui,ij]=1) Contribution[ui,ij] = 1; else if (A[ij]=1 and R[ui,ij]=0) Contribution[ui,ij] = 0; else if (A[ij]=0 and R[ui,ij]=0) Contribution[ui,ij] = 0.5; Dist[ui,ij] =sqrt((IIntensity[ui] – Contribution[ui,ij])^2 /(1-IIntensity[ui])); } Typicality = Null; for each uiNeighbors do { Rowmax = maxRow(Dist[ui,]);
39 | P a g e www.ijacsa.thesai.org
(IJACSA) International Journal of Advanced Computer Science and Applications, Vol. 8, No. 11, 2017
Typic = 1 – Dist[ui,] / Rowmax; Typicality = bindRow(Typicality,Typic); } return Typicality; } IV. EXPERIMENTS A. Experimental Setup 1) Experimental Data Two datasets used in the experiment are MovieLens and CourseRegistration. The MovieLens dataset is collected through website movielens.umn.edu during the seven-month timeframe. The dataset consists of 943 users, 1664 movies, and 99392 ratings (with values of 1-5) storing the feedbacks of users to movies. To be used in the proposed model, the MovieLens dataset is binarized with the threshold of 3. The ratings are set to 1 if they are greater than or equal to this threshold and 0 otherwise. The CourseRegistration dataset is collected through the Cantho University's admissions website https://htql.ctu.edu.vn. The dataset saves the course registration of students who will take part in the third semester (of a program of study) at Faculty of Information and Communication Technology. The dataset consists of 1172 students, 81 courses and 5705 ratings (registrations) with values of 1. To increase the accuracy of recommendations, the experimental datasets need to be preprocessed. If we keep items that are only rated a few times and users who only rate a few items, the evaluations may be biased. Besides, we should also pay attention to the constraints in the registration regulations when conducting the recommendation on the CourseRegistration dataset. For example, the maximum number of credits a student can register for a semester (except in the last semester of study) is limited to 20 credits; in most cases, each course is worth 3 credits; one of eligibility criteria for receiving the scholarship is that a student has to register at least 15 credits per semester; and in order to open a course, there must be at least 25 students registered. Therefore, with the MovieLens dataset, the number of users viewing at least 50 movies and the number of movies viewed by at least 100 users are selected to extract data. With the CourseRegistration dataset, the number of students registering at least 5 courses and the number of courses registered by at least 25 students are chosen to extract the data. The general information of these datasets after filtering is shown in Table 1. TABLE I.
GENERAL INFORMATION OF MOVIELENS AND COURSEREGISTRAION AFTER FILTERING
Dataset
The number of users
The number of items
The number of ratings
The maximum number of given items*
MovieLens
565
336
48,698
14
CourseRegistration
779
36
4,095
3
2) Experimental Tool The proposed recommendation model is developed in the R language and uses the functions that we built in the Interestingnesslab tool [12]. Besides, we also use some recommendation models of the recommenderlab package1, to compare with the proposed model. Those models are: the item based collaborative filtering model using the Jaccard measure (IBCF), the user based collaborative filtering model using the Jaccard measure (UBCF), the popular model recommending the most common items to the active users (POPULAR), the latent factor model (ALS_implicit), and the association rule based model using the confidence measure (AR). 3) Evaluation To evaluate the recommendation models, the rating matrix (dataset) is splitted into the training set and the test set. The test set is then divided into the query set and the target set which have the same size. However, for each user, the query set only has the randomly selected given known ratings; the target set consists of the remaining ratings. The query set together with the training set are used to predict recommendations whereas the target set is used to evaluate the recommended results. The k-fold cross validation method is used to split the dataset into k folds (subsets) of equal size, evaluates k times, and then calculates the average. For each time of evaluation, (k-1) folds are used as the training set and the remaining fold is used as the test set. In this experiment, k is chosen as 4. When the number of items (the length of recommendation list) that need to be presented to the user is not predetermined, evaluating the algorithm over a range of lengths of recommendation list is preferable rather than using a fixed length. Therefore, the Precision- Recall and ROC (Receiver Operating Characteristic) curves are often used [13]. In addition, the ROC curve is often used to compare the performance of multiple algorithms. An algorithm is more efficient if its ROC curve completely dominates the ROC curves of other algorithms [13]. The Precision - Recall curve is built on the precision and the recall. The ROC curve is based on the sensitivity and the complement of specificity. The sensitivity (also called True Positive Rate - TPR) is equivalent to the recall. The complement of specificity is also called False Positive Rate (FPR). In addition, we also use the accuracy measure (the fraction of correct recommendations to total possible recommendations) and the F1 measure (the harmonic mean of the precision and the recall) to evaluate the performance of recommendation models. These six measures are built on the values of the confusion matrix shown in Table 2, and defined in formula (10), (11), (12), (13), and (14). In Table 2, TN is the number of items not recommended by the system and also not preferred by users; FP is the number of items recommended by the system but not preferred by users; FN is the number of items not recommended by the system but preferred by users; and TP is the number of items recommended by the system and also preferred by users.
*
The maximum number of given items for each user of the query set (the maximum number of known items of an active user) is used for building recommendations and evaluating the recommendation models. This number is based on the percentiles of ratings. 1
https://cran.r-project.org/web/packages/recommenderlab
40 | P a g e www.ijacsa.thesai.org
(IJACSA) International Journal of Advanced Computer Science and Applications, Vol. 8, No. 11, 2017 TABLE II. Actual/ Predicted Not preferred Preferred
Not recommended True-Negative (TN) False-Negative (FN)
Recommended False-positive (FP) True-Positive (TP)
0.78 0.76 0.74
Precision = TP/(TP+FP)
0.72
Recall or TPR=TP/(TP+FN)
0.68
FPR=1-specificity=1-TN/(TN+FP)=FP/(TN+FP)
0.64
Accuracy = (TN+TP)/(TN+FP+FN+TP)
F1=2*precision*recall/(precision+recall)
B. Results To compare the proposed model and some existing recommendation models of the recommenderlab package, six RSs are developed. They are named as: IBCFJaccard RS, UBCFJaccard RS, Popular RS, LatentFactor RS, ARConfidence RS, and UBCFImplicative RS. IBCFJaccard RS is created by using item based collaborating filtering model whereas UBCFJaccard RS is created by using user based collaborating filtering model. Both systems use the Jaccard measure to find the nearest neighbors. LatentFactor RS is based on the latent factor model. Popular RS uses the popular model to recommend the most common items to the active users. ARConfidence RS is developed by using the association rule based model and the confidence measure for finding the relevant items. UBCFImplicative RS is developed by using the proposed model and the implicative rating measure. 1) Evaluating the recommendation models on the MovieLens dataset We conduct 30 times of evaluation (times = 30) where the number of known ratings (i.e. items) of each user in the query set is 14 (given = 14); the number of nearest neighbors is 50 (knn = 50); and the numbers of recommendations to be presented to the active user are: 1, 5, 10, 20, 30, 40, 50, 60, 70, 80, 90, and 100. Each time of evaluation uses 4-fold cross validation method described above. Fig. 2 and 3 show the average F1 values and the average accuracy values of six recommendation models. The results indicate that the F1 values and the accuracy values of the proposed model are higher when compared to other models. However, the difference between the proposed model and the user based collaborating filtering model using the Jaccard measure is small. IBCFJaccard RS UBCFJaccard RS Popular RS LatentFactor RS UBCFImplicative RS ARConfidence RS
0.50 0.45 0.40 0.35
IBCFJaccard RS UBCFJaccard RS Popular RS LatentFactor RS UBCFImplicative RS
0.80
CONFUSION MATRIX
0.70 0.66 0.62 1 5 10 20 30 The accuracy values of 6 models
40
50 60 70 80 90 100 The number of recommendations
Fig. 3. The accuracy values of six recommendation models on the MovieLens dataset.
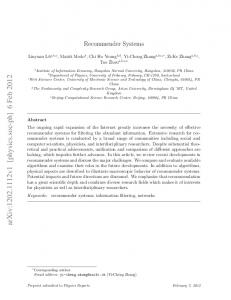
Fig. 4 and 5 display the ROC curves and the Precision – Recall curves of the six recommendation models with times = 30, given = 8, and knn = 50. The results show that the ROC curve of the proposed model dominates the other ROC curves; the probability of false alarm (FPR) of the proposed model is lower than that of the other models; as well as the precision and the recall of the proposed model are higher than those of the other models. When changing the parameters: the number of times of evaluation (times), number of ratings of each user in the query set (given) from 3 to 14, and the number of nearest neighbors (knn), we get the results similar to the above figures. Therefore, the performance of the proposed recommendation model is better than that of other five models.
Fig. 4. The ROC curves of six recommender systems on the MovieLens dataset.
The F1 values of 6 models
0.30 0.25 0.20 0.15 0.10 0.05 0.00 1
5
10
20
30 40 50 60 70 80 The number of recommendations
90
100
Fig. 2. The F1 values of six recommendation models on the MovieLens dataset.
Fig. 5. The Precision – Recall curves of six recommender systems on the MovieLens dataset.
41 | P a g e www.ijacsa.thesai.org
(IJACSA) International Journal of Advanced Computer Science and Applications, Vol. 8, No. 11, 2017
2) Evaluating The Recommendation Models On The Courseregistration Dataset Fig. 6 and 7 show the ROC curves and the Precision – Recall curves of the six recommendation models where the number of times of evaluation is 50 (times = 50); the number of known ratings of each user in the query set is 3 (given = 3); the number of nearest neighbors is 30 (knn = 30); and the numbers of courses to be presented to the active student is: 1, 2, 3, 4, and 5. The results indicate that the ROC curve of the proposed model dominates the other ROC curves; the probability of false alarm of the proposed model is lower than that of the other models; and the precision and the recall of the proposed model are higher than those of the other models. Fig. 8 and 9 display the average F1 values and the average accuracy values of six recommendation models with times = 50, given = 2, and knn = 30. The results show that the F1 values and the accuracy values of the proposed model are higher when compared to other models.
0.60
IBCFJaccard RS
UBCFJaccard RS
Popular RS
LatentFactor RS
UBCFImplicative RS
ARConfidence RS
0.50 0.40 0.30 0.20 0.10 0.00
1
2
3
The F1 values of 6 models
4
5
The number of recommendations
Fig. 8. The F1 values of six recommendation models on the CourseRegistration dataset. IBCFJaccard RS Popular RS UBCFImplicative RS
0.92
UBCFJaccard RS LatentFactor RS ARConfidence RS
0.90 0.88 0.86 0.84 0.82 0.80 0.78 1
2
3
The accuracy values of 6 models
4 5 The number of recommendations
Fig. 9. The accuracy values of six recommendation models on the CourseRegistration dataset.
Fig. 6. The ROC curves of six recommender systems on the CourseRegistration dataset.
When the parameters (times, given and knn) are changed, we also get the results similar to the above figures. Therefore, the performance of the proposed recommendation model is better than that of other five models. V. CONCLUSION
Fig. 7. The Precision – Recall curves of six recommender systems on the CourseRegistration dataset.
This paper proposes: the implicative rating measure developed on the statistical implicative measures, and a new recommendation model based on the user based collaborative filtering and the proposed measure. The input of the proposed model is the binary rating matrix. In order to filter out, rank, and recommend the top N items to the active users, the proposed model uses the implicative intensity measure to find the nearest neighbors of the active users; the proposed implicative measure to predict users’ ratings for items. The performance of the proposed model is compared to the performance of five existing models of the recommenderlab package: the item based collaborative filtering model using the Jaccard measure, the user based collaborative filtering model using the Jaccard measure, the popular model recommending the most common items to the active users, the latent factor model, and the association rule based model using the confidence measure. The experimental results on the MovieLens dataset and the CourseRegistration dataset show
42 | P a g e www.ijacsa.thesai.org
(IJACSA) International Journal of Advanced Computer Science and Applications, Vol. 8, No. 11, 2017
that the performance of proposed model (through the ROC curves, the Precision – Recall curves, the F1 measure, and the accuracy measure) is better than that of the compared five models. [1] [2] [3] [4]
[5] [6]
[7]
REFERENCES F. Ricci, L. Rokach, B. Shapira, and P.B. Kantor, Recommender Systems Handbook, Springer US, 2011. J. Lu, and et.al, “Recommender system application developments: a survey”, Decision Support Systems, 74, pp. 12-32, 2015. C. Aggarwal, Recommender Systems: The Textbook, Springer International Publishing Switzerland, 2016, ISBN 978-3-319-29657-9. X. Amatriain, A. Jaimes, N. Oliver, J. Pujol 2011), “Data mining methods for recommender systems”, Recommender Systems Handbook, Springer US, pp. 39-71. D. Jannach, M. Zanker, A. Felfernig, and G. Friedrich, An introduction to recommender systems, Cambridge University Press, 2011. A. Felfernig, M. Jeran, G. Ninaus, F. Reinfrank, S. Reiterer, and M. Stettinger, “Basic Approaches in Recommendation Systems”, Recommendation Systems in Software Engineering, pp. 15-38, Springer-Verlag Berlin Heidelberg, 2014. G. Adomavicius and A. Tuzhilin, “Toward the next generation of recommender systems: a survey of the state-of-the-art and possible
[8]
[9]
[10] [11]
[12]
[13]
extensions”, IEEE Transactions on Knowledge and Data Engineering, 17, pp. 734-749, 2005. J.B. Schafer, D. Frankowski, J. Herlocker, and S. Sen, “Collaborative Filtering Recommender Systems”, The Adaptive Web, LNCS 4321, pp. 291-324, Springer-Verlag Berlin Heidelberg, 2007. 13 – FAIR 2016 R. Gras and P. Kuntz, “An overview of the Statistical Implicative Analysis (SIA) development”, Statistical Implicative Analysis, Studies in Computational Intelligence, Springer-Verlag, 127, 2008, pp. 11-40. R. Gras, E. Suzuki, F. Guillet and F. Spagnolo, Statistical Implicative Analysis, Springer-Verlag, 2008. J. Régnier, Y. Slimani, and R. Gras, Proceedings of Conference: Analyse Statistique Implicative, des sciences dures aux sciences humaines et sociales, ASI 8, Tunisie, 2015, ISBN : 978-9973-9819-0-5. L.P. Phan, N.Q. Phan, K.M. Nguyen, H.H. Huynh, H.X. Huynh, F. Guillet, “Interestingnesslab: A Framework for Developing and Using Objective Interestingness Measures”. In: Akagi M., Nguyen TT., Vu DT., Phung TN., Huynh VN. (eds) Advances in Information and Communication Technology. ICTA 2016. Advances in Intelligent Systems and Computing, vol 538. Springer, Cham, pp. 302-311, 2017 A. Gunawardana and G. Shani, “A Survey of Accuracy Evaluation Metrics of Recommendation Tasks”, Journal of Machine Learning Research, 10, 2009, pp. 2935–2962.
43 | P a g e www.ijacsa.thesai.org