User-Centered Evaluation of Interactive Question Answering Systems Diane Kelly1, Paul B. Kantor2, Emile L. Morse3, Jean Scholtz3 & Ying Sun2 University of North Carolina
Rutgers University
Chapel Hill, NC 27599
[email protected]
New Brunswick, NJ 08901
[email protected] [email protected]
Abstract We describe a large-scale evaluation of four interactive question answering system with real users. The purpose of the evaluation was to develop evaluation methods and metrics for interactive QA systems. We present our evaluation method as a case study, and discuss the design and administration of the evaluation components and the effectiveness of several evaluation techniques with respect to their validity and discriminatory power. Our goal is to provide a roadmap to others for conducting evaluations of their own systems, and to put forward a research agenda for interactive QA evaluation.
1
Introduction
There is substantial literature on the evaluation of systems in the context of real users and/or realistic problems. The overall design issues were presented by Tague-Sutcliffe (1992) in a classic paper. Other authors who have contributed substantially to the discussion include Hersh and Over (2001). The basic change in viewpoint required, in the study of interactive systems with real users, is that one cannot follow the Cranfield Model, in which specific items (whether documents, or snippets of information) are known to be “good,” so that measures can be based on the count of such items (e.g., precision and recall). Instead, one must develop methods and metrics that are sensitive to individual users, tasks and contexts, and robust enough to allow for valid and reliable comparisons across systems. Most evaluations of QA systems have been con-
National Institute of Standards & Technology Gaithersburg, MD
[email protected] [email protected]
ducted as part of the QA Track at TREC. They are system-oriented rather than user-oriented, with a focus on evaluating techniques for answer extraction, rather than interaction and use (Voorhees, 2003). In this paper, we consider an interactive system to be a system that supports at least one exchange between the user and system. Further, an interactive system is a system that allows the user full or partial control over content and action. While factoid QA plays a role in analytical QA, analytical QA also includes other activities, such as comparison and synthesis, and demands much richer interactions between the system, the information, and the user. Thus different evaluation measures are needed for analytical QA systems than for those supporting factoid QA. Emerging work in the QA community is addressing user interaction with factoid-based QA systems and other more complex QA tasks (Diekema, et al., 2004; Liddy, et al., 2004), but developing robust evaluation methods and metrics for interactive, analytical QA systems in realistic settings with target users and tasks remains an unresolved research problem. We describe a large-scale evaluation of four interactive QA systems with target users, completing target tasks. Here we present the evaluation method and design decisions for each aspect of the study as a case study. The goal of this paper is to identify key issues in the design of evaluations of interactive QA systems and help others construct their own evaluations. While systems participating in this evaluation received individual feedback about the performances of their systems, the purpose of the project was not to compare a series of systems and declare a ‘winner.’ In this paper we focus on the method and results of that method, rather than the performance of any one system. In section 2, we describe our evaluation approach, the evaluation environment, systems studied, subjects, corpus and scenarios, and
49 Proceedings of the Interactive Question Answering Workshop at HLT-NAACL 2006, pages 49–56, c New York City, NY, USA. June 2006. 2006 Association for Computational Linguistics
experimental design. In Section 3 we report our instruments and other data collection techniques. In Section 4 we discuss our evaluation methods, and present key findings regarding the effectiveness of the various evaluation techniques. We conclude by considering future research directions for interactive QA evaluation.
2
Evaluation Approach
This evaluation was conducted as a two-week workshop. The workshop mode gives analysts an opportunity to fully interact with all four systems, complete time-intensive tasks similar to their normal work tasks and lets us evaluate a range of methods and metrics. The researchers spent approximately 3 weeks onsite preparing and administering the workshop. Intelligence analysts, the study participants, spent 2 weeks onsite. The evaluation employed 8 analysts, 8 scenarios in the chemical/biological WMD domain, and 4 systems – 3 QA systems and a Google 1 baseline system. Each analyst used each system to analyze 2 scenarios and wrote a pseudoreport containing enough structure and content for it to be judged by peer analysts. During the planning stage, we generated hypotheses about interactive QA systems to guide development of methods and metrics for measuring system effectiveness. Fifteen hypotheses were selected, of which 13 were operationalized. Example hypotheses are presented in Table 1. A good interactive QA system should … 1 Support information gathering with lower cognitive workload 2 Assist analysts in exploring more paths/hypotheses 3 Enable analysts to produce higher quality reports 4 Provide useful suggestions to the analyst 5 Provide analysts with more good surprises than bad
Table 1: Example hypotheses 2.1
Evaluation Environment
The experiment was done at the Pacific Northwest National Laboratory (PNNL) in Richland, WA. We used one room with support servers, four rooms with two copies of one system in each and a 1
Any mention of commercial products or companies is for information only and does not imply recommendation or endorsement by NIST.
50
conference room seating 20, for general meetings, focus group discussions, meetings among observers, meetings among developers, etc. 2.2
QA Systems
Three end-to-end interactive QA systems and a Google baseline were used. System developers were assigned a room, and installed their systems on two workstations in the room. Before analysts used each system, they were trained by the system developer. Training included a skills check test, and free experimentation. Methods of training included: a script with trainees reproducing steps on their own workstations, a slide presentation with scripted activities, a presentation from a printed manual, and a presentation, orally and with participation, guided by a checklist. The workstations used during the experiment were Dell workstations configured with Windows XP Professional with updated OS, Intel Pentium IV processor 3.40 Ghz 512 K/800 Mhz, 2 GB DDR 400 SD RAM, 120 GB SATA 7200 RPM hard drive with Data Burst Cache, video card, floppy drive, 16 DVD ROM, and 48/32/48 CDRW. 2.3
Subjects
Analysts who participated in the study were volunteers serving their yearly two-week service requirement as U.S. Naval Reservists. Analysts were recruited by email solicitation of a large pool of potential volunteers. The first 8 positive responders were inducted into the study. We collected the following data from analysts: age, education level, job type, number of years in the military, number of years conducting analysis work, computer usage, computer expertise, and experience with querying systems. Data about analysts characterizes them on several dimensions. With small samples, this step is critical, but it is also important in studies with larger samples. This type of data lets us describe participants in published reports and ask whether individual differences affect study results. For instance, one might look for a relationship between computer experience and performance. 2.4
Scenarios
Scenarios were developed by a team of analysts from the Air Force Rome Research Lab, and were
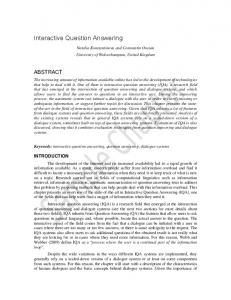
vetted to produce 14 appropriate to the collection and target participants. We found after the first two scenarios that while scenario descriptions were sufficient in describing the content of the task, important information regarding context of the description and the format of the report, such as customer and length, was lacking. This omission generated ambiguity in report creation, and caused some uncertainty for the analysts on how to proceed with the task. Thereafter, analysts met as a group in the conference room to agree on additional specifications for each scenario when it was assigned. In addition to this information, the project director and one analyst worked together to design a template for the report, which established a uniform report structure, and specified formatting guidelines such as headings and length. An example scenario is displayed in Figure 1.
had less than 100 documents in the CNS corpus, so to increase the number of documents available for each scenario we supplemented the corpus by mining the Web. Documents were collected from the Web by semi-automated querying of Google and manual retrieval of the documents listed in the results. A few unusually large and useless items, like CD images, pornography and word lists, were deleted. The approximate counts of different kinds of files, as determined by their file extensions, are summarized in Table 2. Source
All Files
Documents
Images
CNS
40192
39932
945
Other
261590
48035
188729
Table 2: Characteristics of corpus in bytes
Scenario B: [country] Chemical Weapons Program
2.6
Before a U.S. military presence is reestablished in [country], a current, thorough study of [country] chemical weapons program must be developed. Your task is to produce a report for the Secretary of the United States Navy regarding general information on [country] and the production of chemical weapons. Provide information regarding [country] access to chemical weapons research, their current capabilities to use and deploy chemical weapons, reported stockpiles, potential development for the next few years, any assistance they have received for their chemical weapons program, and the impact that this information will have on the United States. Please add any other related information to your report.
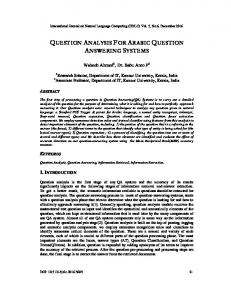
The evaluation workshop included four, two-day blocks. In each block, a pair of analysts was assigned to each room, and a single observer was assigned to the pair of analysts. Analysts used the two machines in each room to work independently during the block. After each block, analysts and observers rotated to different system rooms, so that analysts were paired together only once and observers observed different analysts during each block. The goal in using designed experiments is to minimize the second-order interactions, so that estimates of the main effects can be obtained from a much smaller set of observations than is required for a full factorial design. For instance, one might imagine potential interaction effects of system and scenario (some systems might be better for certain scenarios); system and analysts (some analysts might adapt more quickly to a system); and analyst and scenario (some analysts might be more expert for certain scenarios). To control these potential interactions, we used a modified Greco-Latin 4x4 design. This design ensured that each analyst was observed by each of the four observers, and used each of the four systems. This design also ensured that each system was, for some analyst, the first, second, third or last to be encountered, and that no analyst did the same pair of scenarios twice. Analyst pairings were unique across blocks. Following standard practice, analysts and scenarios were ran-
Customer: Secretary of U.S. Navy Role: Country desk – [country] What they want: General report on [country] and CW production
Figure 1. Example Scenario 2.5
Corpus
Using the live Web would make it impossible to replicate the experiment, so we started with the AQUAINT corpus from the Center for NonProliferation Studies (CNS). The CNS data consists of the January 2004 distribution of the Eye on Proliferation CD, which has been "disaggregated" by CNS into about 40,000 documents. Once the initial 14 scenarios were delivered to NIST, they were characterized with respect to how well the CNS corpus could support them. Several scenarios 51
Experimental Design
domly assigned codenames (e.g. A1, and Scenario A), and systems were randomly assigned to the rows of Table 3. Although observers were simply rotated across the system rows, the assignment of human individuals to code number was random. Dates Scenarios System 1 System 2 System 3 System 4
Day 1 2 A, B
Day 3 4 C, D
Day 5 6 E, F
Day 7 8 G, H
O1 A1 A5 O2 A4 A7 O3 A2 A8 O4 A3 A6
O2 A2 A6 O1 A3 A8 O4 A1 A7 O3 A4 A5
O3 A3 A7 O4 A2 A5 O1 A4 A6 O2 A1 A8
O4 A4 A8 O3 A1 A6 O2 A3 A5 O1 A2 A7
3.2
Table 3. Experimental design (O=observer; A=analyst)
3
Data Collection
System logs and Glass Box (Hampson & Crowley, 2005) were the core logging methods providing process data. Post-scenario, post-session, postsystem and cognitive workload questionnaires, interviews, focus groups, and other user-centered methods were applied to understand more about analysts’ experiences and attitudes. Finally, crossevaluation (Sun & Kantor, 2006) was the primary method for evaluating reports produced. Each experimental block had two sessions, corresponding to the two unique scenarios. Methods and instruments described below were either administered throughout the experimental block (e.g., observation and logging); at the end of the session, in which case the analyst would complete two of these instruments during the block (e.g., a postsession questionnaire for each scenario); or once, at the end of the experimental block (e.g., a postsystem questionnaire). We added several data collection efforts at the end of the workshop to understand more about analysts’ overall experiences and to learn more about the study method. 3.1
optimal viewing position. Observers used an Observation Worksheet to record activities and behaviors that were expected to be indicative of analysts’ level of comfort, and feelings of satisfaction or dissatisfaction. Observers noted analysts’ apparent patterns of activities. Finally, observers used the Worksheet to note behaviors about which to follow-up during subsequent session interviews.
Observation
Throughout the experimental sessions, trained observers monitored analysts’ interactions with systems. Observers were stationed behind analysts, to be minimally intrusive and to allow for an
During the evaluation, we were interested in obtaining feedback from analyst in situ. Analysts were asked to report their experiences spontaneously during the experimental session in three ways: commenting into lapel microphones, using the “SmiFro Console” (described more fully below), and completing a three-item online Status Questionnaire at 30 minute intervals. The SmiFro Console provided analysts with a persistent tool for commenting on their experiences using the system. It was rendered in a small display window, and analysts were asked to leave this window open on their desktops at all times. It displayed smile and frown faces, which analysts could select using radio buttons. The Console also displayed a text box, in which analysts could write additional comments. The goal in using smiles and frowns was to create a simple, recognizable, and quick way for analysts to provide feedback. The SmiFro Console contained links to the Status Questionnaires which were designed to solicit analysts’ opinions and feedback about the progress of their work during the session. Each questionnaire contained the same three questions, which were worded differently to reflect different moments in time. There were four Status Questionnaires, corresponding to 30-minute intervals during the session: 30, 60, 90, 120 minutes. 3.3
NASA TLX Questionnaire
After completing each scenario, analysts completed the NASA Task Load Index (TLX) 2. The NASA TLX is a standard instrument used in aviation research to assess pilot workload and was used in this study to assess analysts’ subjective cognitive workloads while completing each scenario. The NASA TLX assesses six factors:
2
52
Spontaneous Self-Reports
http://www.nrl.navy.mil/aic/ide/NASATLX.php
1. Mental demand: whether this searching task affects a user's attention, brain, and focus. 2. Physical demand: whether this searching task affects a user's health, makes a user tired, etc. 3. Temporal demand: whether this searching task takes a lot of time that can't be afforded. 4. Performance: whether this searching task is heavy or light in terms of workload. 5. Frustration: whether this searching task makes a user unhappy or frustrated. 6. Effort: whether a user has spent a lot of effort on this searching task. 3.4
Post-Scenario Questionnaire
Following the NASA TLX, analysts completed the six-item Scenario Questionnaire. This Questionnaire was used to assess dimensions of scenarios, such as their realism and difficulty. 3.5
Post-Session Questionnaire
After completing the Post-Scenario Questionnaire, analysts completed the fifteen-item PostSession Questionnaire. This Questionnaire was used to assess analysts’ experiences using this particular system to prepare a pseudo-report. Each question was mapped to one or more of our research hypotheses. Observers examined these responses and used them to construct follow-up questions for subsequent Post-Session Interviews. 3.6
Post-Session Interview
Observers used a Post-Session Interview Schedule to privately interview each analyst. The Interview Schedule contained instructions to the observer for conducting the interview, and also provided a list of seven open-ended questions. One of these questions required the observer to use notes from the Observation Worksheet, while two called for the observer to use analysts’ responses to Post-Session Questionnaire items. 3.7
NASA TLX Weighting Instrument
After using the system to complete two scenarios, analysts completed the NASA-TLX Weighting instrument. The NASA-TLX Weighting instrument was used to elicit a ranking from analysts about the factors that were probed with the NASATLX instrument. There are 15 pair-wise compari-
53
sons of 6 factors and analysts were forced to choose one in each pair as more important. A simple sum of “wins” is used to assign a weight to each dimension, for the specific analyst. 3.8
Post-System Questionnaire
After the NASA-TLX Weighting instrument, analysts completed a thirty-three item Post-System Questionnaire, to assess their experiences using the specific system used during the block. As with the Post-Session Questionnaire, each question from this questionnaire was mapped to one or more of our research hypotheses and observers asked follow-up questions about analysts’ responses to select questions during the Post-System Interview. 3.9
Post-System Interview
Observers used a Post-System Interview Schedule to privately interview each analyst at the end of a block. The Interview Schedule contained instructions to the observer for conducting the interview, as well as six open-ended questions. As in the Post-Session Interview, observers were instructed to construct content for two of these questions from analysts’ responses to the Post-System Questionnaire. 3.10
Cross-Evaluation
The last component of each block was Cross Evaluation (Ying & Kantor, 2006). Each analyst reviewed (using a paper copy) all seven reports prepared for each scenario in the block (14 total reports). Analysts used an online tool to rate each report according to 7 criteria using 5-point scales. After analysts completed independent ratings of each report according to the 7 criteria, they were asked to sort the stack of reports into rank order, placing the best report at the top of the pile. Analysts were then asked to use a pen to write the appropriate rank number at the top of each report, and to use an online tool to enter their report rankings. The criteria that the analysts used for evaluating reports were: (1) covers the important ground; (2) avoids the irrelevant materials; (3) avoids redundant information; (4) includes selective information; (5) is well organized; (6) reads clearly and easily; and (7) overall rating. 3.11
Cross-Evaluation Focus Groups
After the Cross Evaluation, focus groups of four
analysts were formed to discuss the results of the Cross Evaluation. These focus groups had two purposes: to develop a consensus ranking of the seven reports for each scenario, and to elicit the aspects, or dimensions, which led each analyst to rank a report high or low in overall quality. These discussions were taped and an observer took notes during the discussion. 3.12
System Logs and Glass Box
Throughout much of the evaluation, logging and Glass Box software captured analysts’ interactions with systems. The Glass Box software supports capture of analyst workstation activities including keyboard/mouse data, window events, file open and save events, copy/paste events, and web browser activity. The Glass Box uses a relational database to store time-stamped events and a hierarchical file store where files and the content of web pages are stored. The Glass Box copies every file the analyst opens so that there is a complete record of the evolution of documents. Material on every web page analysts visit is explicitly stored so that each web page can be later recreated by researchers as it existed at the time it was accessed by analysts; screen and audio capture are also available. The data captured by the Glass Box provides details about analysts’ interaction with Microsoft desktop components, such as MS Office and Internet Explorer. User interaction with applications that do not run in a browser and Java applications that may run in a browser are opaque to Glass Box. Although limited information, e.g. Window Title, application name, information copied to the system Clipboard, is captured, the quantity and quality of the data is not sufficient to serve as a complete log of user-system interaction. Thus, a set of logging requirements was developed and implement by each system. These included: time stamp; set of documents the user copied text from; number of documents viewed; number of documents that the system said contained the answer; and analyst’s query/question. 3.13
End-of-Workshop Activities
On the final day of the workshop, analysts completed a Scenario Difficulty Assessment task, provided feedback to system developers and participated in two focus group interviews. As part of the Scenario Difficulty Assessment, analysts
54
rated each scenario on 12 dimensions, and also rank-ordered the scenarios according to level of difficulty. After the Scenario Difficulty Assessment, analysts visited each of the three experimental system developers in turn, for a 40-minute free form discussion to provide feedback about systems. As the last event in the workshop, analysts participated in two focus groups. The first was to obtain additional feedback about analysts’ overall experiences and the second was to obtain feedback from analysts about the evaluation process.
4
Discussion
In this section, we present key findings with regard to the effectiveness of these data collection techniques in discriminating between systems. Corpus. The corpus consisted of a specialized collection of CNS and Web documents. Although this combination resulted in a larger, diverse corpus, this corpus was not identical to the kinds of corpora analysts use in their daily jobs. In particular, analysts search corpora of confidential government documents. Obviously, these corpora are not readily available for QA system evaluation. Thus, creation of a realistic corpus with documents that analysts are used to is a significant challenge. Scenarios. Scenarios were developed by two consultants from the Rome AFRL. The development of appropriate and robust scenarios that mimicked real-world tasks was a time intensive process. As noted earlier, we discovered that in spite of this process, scenarios were still missing important contextual details that govern report generation. Thus, creating scenarios involves more than identifying the content and scope of the information sought. It also requires identifying information such as customer, role and deadline. Analysts. Analysts in this experiment were naval reservists, recruited by email solicitation of a large pool of potential volunteers; the first 8 positive responders were inducted into the study. Such self-selection is virtually certain to produce a nonrandom sample. However, this sample was from the target population which adds to the validity of the findings. We recommend that decision makers evaluating systems expend substantial effort to recruit analysts typical of those who will be using the system and be aware that self selection biases are likely to be present. Care should be taken to ensure that subjects have a working knowledge of
basic tasks and systems, such as using browsers, Microsoft Word, and possibly Microsoft Excel. Experimental Design. We used a great deal of randomization in our experimental design; the purpose was to obtain more valid statistical results. All statistical results are conditioned by the statement “if the analysts and tasks used are a random sample from the universe of relevant analysts and tasks.” Scenarios were not a random selection among possible scenarios; instead, they were tailored to the corpus. Similarly, analysts were not a random sample of all possible analysts, since they were in fact self-selected from a smaller pool of all possible analysts. The randomization in the experimental rotation allowed us to mitigate biases introduced by non-probability sampling techniques across system, as well as curtail any potential bias introduced by observers. Data Collection. We employed a wide variety of data collection techniques. Key findings with respect to each technique are presented below. Questionnaires were powerful discriminators across the range of hypotheses tested. They were also relatively economical to develop and analyze. Most analysts were comfortable completing questionnaires, although with eight repetitions they sometimes became fatigued. Questionnaires also provided a useful opportunity to check the validity of experimental materials such as scenarios. The NASA TLX was sensitive in assessing analysts’ workloads for each scenario. It was cheap to administer and analyze, and has established validity and reliability as an instrument in a different arena, where there are real time pressures to control a mechanical system. Formative techniques, such as interviews and focus groups, provided the most useful feedback, especially to system developers. Interview and focus group data usually provide researchers with important information that supplements, qualifies or elaborates data obtained through questionnaires. With questionnaires, users are forced to quantify their attitudes using numeric values. Data collection methods designed to gather qualitative data, such as interviews, provide users with opportunities to elaborate and qualify their attitudes and opinions. One effective technique used in this evaluation was to ask analysts to elaborate on some of their numeric ratings from questionnaires. This allows us to understand more about why analysts used particular values to describe their attitudes
55
and experiences. It is important to note that analysis of qualitative data is costly – interviews were transcribed and training is needed to analyze and interpret data. Training is also necessary to conduct such interviews. Because researchers are essentially the ‘instrument’ it is important to learn to moderate one’s own beliefs and behaviors while interviewing. It is particularly important that interviewers not be seen by their interviewees as “invested in” any particular system; having individuals who are not system developers conduct interviews is essential. The SmiFro Console was not effective as implemented. Capturing analysts’ in situ thoughts with minimal disruption remains a challenge. Although SmiFro Console was not particularly effective, status report data was easy to obtain and somewhat effective, but defied analysis. Cross evaluation of reports was a sensitive and reliable method for evaluating product. Complementing questionnaires, it is a good method for assessing the quality of the analysts’ work products. The method is somewhat costly in terms of analysts’ time (contributing approximately 8% of the total time required from subjects), and analysis requires skill in statistical methods. System logs answered several questions not addressable with other methods including the Glass Box. However, logging is expensive, rarely reusable, and often unruly when extracting particular measures. Development of a standard logging format for interactive QA systems is advisable. The Glass Box provided data on user interaction across all systems at various levels of granularity. The cost of collection is low but the cost of analysis is probably prohibitive in most cases. NIST’s previous experience using Glass Box allowed for more rapid extraction, analysis and interpretation of data, which remained a very time consuming and laborious process. Other commercial tools are available that capture some of the same data and we recommend that research teams evaluate such tools for their own evaluations. Hypotheses. We started this study with hypotheses about the types of interactions that a good QA system should support. Of course, different methods were more or less appropriate for assessing different hypotheses. Table 4 displays part of our results with respect to the example hypotheses presented above in Table 1. For each of the example hypotheses provided in Table 1, we show
which method was used. Ques. 1 2 3 4 5
NASA TLX X
X X X X
SmiFro
CrossEval.
Logs X
Glass Box X
X
X
X X
Table 4: Most effective methods for gathering data about example hypotheses (see Table 1). Although not reported here, we note that the performance of each of the systems evaluated in this study varied according to hypothesis; in particular, some systems did well according to some hypotheses and poor according to others. Interaction. Finally, while the purposes of this paper were to present our evaluation method for interactive question answering systems, our instruments elicited interesting results about analysts’ perceptions of interaction. Foremost among them, users of interactive systems expect systems to exhibit behaviors which can be characterized as understanding what the user is looking for, what the user has done and what the user knows. Analysts in this study expected interactive systems to track their actions over time, both with the system and with information.
5
Conclusions
We have sketched a method for evaluating interactive analytic question answering system, identified key design decisions that developers must make in conducting their own evaluations, and described the effectiveness of some of our methods. Clearly, each evaluation situation is different, and it is difficult to develop one-size-fits-all evaluation strategies, especially for interactive systems. However, there are many opportunities for developing shared frameworks and an infrastructure for evaluation. In particular, the development of scenarios and corpora are expensive and should be shared. The creation of sharable questionnaires and other instruments that are customizable to individual systems can also contribute to an infrastructure for interactive QA evaluation. We believe that important opportunities exist through interactive QA evaluation for understanding more about the interactive QA process and developing extensive theoretical and empirical foundations for research. We encourage system 56
developers to think beyond independent system evaluation for narrow purposes, and conduct evaluations that create and inform theoretical and empirical foundations for interactive question answering research that will outlive individual systems. Although we do not have space here to detail the templates, instruments, and analytical schemas used in this study, we hope that the methods and metrics developed in connection with our study are a first step in this direction 3. We plan to publish the full set of results from this study in the future.
References Diekema, A. R., Yilmazel, O., Chen, J., Harwell, S., He, L., & Liddy, E. D. (2004). Finding answers to complex questions. In M. T. Maybury’s, New directions in question answering. MIT Press, MA., 141-152. Hampson, E., & Crowley, P. (2005). Instrumenting the intelligence analysis process. Proceedings of the 2005 International Conference on Intelligence Analysis, McLean, VA. Hersh, W. & Over, P. (2001). Introduction to a special issue on interactivity at the Text Retrieval Conference (TREC). Information Processing & Management 37(3), 365-367. Liddy, E. D., Diekema, A. R., & Yilmazel, O. (2004). Context-based question-answering evaluation. Proceedings of SIGIR ’04, Sheffield, UK, 508-509. Sun, Y., & Kantor, P. (2006). Cross-evaluation: A new model for information system evaluation. Journal of American Society for Information Science & Technology. Tague-Sutcliffe, J. (1992). The pragmatics of information retrieval experimentation, revisted. Information Processing & Management, 28(4), 467-490. Voorhees, E. M. (2003). Evaluating the evaluation: A case study using the TREC 2002 Question Answering Task. Proceedings of HLT-NAACL’03, 181-188.
3
The NIST team maintains a password-protected website (http://control.nist.gov/amc/) for materials related to this project. Send email to
[email protected].