LANOMS 2005 - 4th Latin American Network Operations and Management Symposium
User-centric Quality of Service Management in UMTS Karim Yaici1, Antonio Liotta2, Haris Zisimopoulos3, Tony Sammut3 1
University of Surrey, Centre for Communication Systems Research Guildford GU2 7XH, U.K.
[email protected] 2 University of Essex, Department of Electronic Systems Engineering Wivenhoe Park, Colchester, CO4 3SQ, U.K.
[email protected] 3 Vodafone Group Research and Development Vodafone House, The connection, Newbury, Berkshire RG14 2FN, UK {haris.zisimopoulos}{tony.sammut}@vodafone.com
Abstract. The introduction of UMTS has fuelled the demand for mobile services having a range of QoS constraints. The mobile operator has the means to set network QoS levels but its final aim is to meet user satisfaction while minimizing resource consumption. In this article we study the relationship between UMTS network QoS levels and the user perception of QoS. We report our findings based on a subjective study involving over 100 users for a 2-year period. Our statistical analysis correlates individual QoS parameters with the user opinion on service quality. We determined that the optimum range of bandwidth for web browsing over UMTS is comprised between 64 and 128kbps. We have also found the conditions under which graceful degradation of QoS is not easily perceived by the UMTS user, which suggests various new ways of managing over-the-air resources. Our methodology can also be applied to conduct similar studies for any other service. Keywords. Quality of Service, Mobile Telecommunications, User Perception.
1 Introduction While the earlier generations of mobile networks had only limited or no support for end-to-end Quality of Service (QoS), the recently deployed Universal Mobile Telecommunication Services (UMTS) is QoS-enabled. However, UMTS QoS management, as specified in the recommendations, is merely a network mechanism which does not directly relate to the end user perception of mobile application quality. From the operator’s perspective, it is important to determine the thresholds at which the majority of users change their perception for different types of user services. The determination of those thresholds can hint accurate provisioning and dimensioning strategies for interactive services, enabling efficient use of network resources and suitable charging schemes. The standards do not provide any stringent QoS requirements, particularly for the Interactive and Background classes, so the user perception of quality is an important factor which aids the definition of QoS policies and network dimensioning.
295
296
LANOMS 2005 - 4th Latin American Network Operations and Management Symposium
In this article we study the relationship between UMTS network QoS levels and the user perception of QoS at the application level (i.e. web browsing). Understanding how and to what extent network parameters – namely delay, jitter and bandwidth – get translated at application level is of paramount importance to the network operator. We report our findings based on a subjective study involving over 100 users for a 2year period. Our statistical analysis correlates individual QoS parameters with the user opinion on service quality. We determine the most convenient combination of delay, jitter and bandwidth based exclusively on the user perception of quality. To the best of our knowledge, this is the only pilot study of its kind. We discuss related work in Section 2, describe our experimental methodology in Section 3, present key results in Section 4, and finally discuss the applicability of our work from the network operator’s viewpoint in Section 5.
2 Previous Work on User Perceived QoS While there is work in the general area of QoS perception, there is very limited research in the specific area of QoS perception for services over mobile networks. It is remarkable that studies in network QoS management have been focusing mainly on the technical means to QoS-enable networks (e.g. UMTS, Differentiated Services, and Integrated Services) and multimedia applications (e.g. adaptable streaming). Sasse et al. [1] have found that parameters that users utilize to build their opinion on the quality of Internet applications (e.g., ftp, e-mail) include speed, reliability and ease of use accessibility. They have also found that users’ requirements on QoS vary with the context of the interaction and the purpose of the task. In terms of user tolerance for web latency, it has been found that the threshold value is 11 seconds, and that user tolerance decreases over the duration of the interaction with a web site [2]. Bouch et al. conducted a study to identify how long users would be prepared to wait for web pages to load and derived a rating (from bad to good) corresponding to download time (from 2 to 73 seconds). They showed that users' perception of web QoS is influenced by a number of contextual factors, i.e. the task in which users are engaged, the length of time they have been interacting with a site, and the method of page loading. Finally, Asplund et al. explored how users select the trade-off between image quality and latency when viewing web sites [3]. They came to the conclusion that user tolerance for data loss is influenced by a number of contextual factors such as the layout of the web page, the kind and importance of the images, and the preference of the individual user. Noticeably, a common characteristic of the above-mentioned studies is their focus on the total download time of the web pages, whereas the focus of our study is on network-level QoS parameters (i.e. delay, delay variation, and bandwidth). Another important difference introduced by this research, is the focus on conditions commonly experienced by UMTS wireless networks rather than conventional “wired” internetworks.
LANOMS 2005 - 4th Latin American Network Operations and Management Symposium
3 Experimental Methodology As a starting point, we adopt the user-centric QoS analysis methodology proposed by Sasse et al. [1], aiming at capturing user perception in relation to mobile services. We follow an explicit user-centric approach, where QoS is ascertained by the user. The user is subject to a series of tests involving a web browsing application operating over an emulated UMTS network set up under a variety of typical QoS conditions. We have used the Shunra/Cloud® network emulator to emulate UMTS [4]. Both local area networks (LANs) are unloaded, and have negligible delay, jitter and packet loss. The subjects were selected randomly from the list of employees present at the Vodafone Headquarters site (Newbury, UK). The participants included personnel with technical and non-technical backgrounds but comprised people that were expected to have some experience with web browsing and mobile phones due to the nature of the organization that employs them. The response rate for the survey was 23.5% which is extremely significant. Demographically, it was found that 75% of the respondents were males, against 25% female participants. In total just over a hundred users participated. The tests cases were defined based on the predicted conditions experienced in UMTS mobile networks. Twelve different sets of tests, representing all combinations of the following parameters have been identified: delay (300, 600 ms), bandwidth (64, 128, 384 kbs) and Jitter (30%, 50%). In order to reduce the size of the test matrix, we have grouped “similar” test conditions into 6 clusters (Table 1), since two different network conditions yielding the same download time will be perceived as equal by the user (as argued in [6]). The reference condition is defined to be a median condition with respect to test matrix conditions (i.e., between cluster III and cluster IV) so that user votes can be balanced across the response scale. Table 1. Network test conditions and corresponding clustering. Cluster I II III IV V VI
Test Case 1–2 7 – 11 3–8 4 9 – 10 5–6
Bandwidth (Kbps) 64 128 – 384 64 – 128 – 384 64 384 128
Latency (ms) 300 600 600 600 300 300
Jitter (%) 30 – 50 30 30 – 50 – 50 50 30 – 50 30 – 50
Concerning the content, the test web pages are ‘frozen’ copies of the BBC News web site (http://news.bbc.co.uk), which have been randomly selected from the live site. The first web page of each set is around 110 Kbytes, while the second and third pages are around 75 Kbytes each. The test is performed without the user having knowledge of the network parameters of each test case. The user is asked to browse a number of web pages and provide qualitative judgments of the perceived QoS, in comparison to the reference condition. Quality assessments are made using a 5-grade discrete category scale, similar to Mean Opinion Score (MOS) [5]. Votes range from 1 to 5, 1 representing a “Much worse than reference condition” opinion, and 5 referring to a “Much better
297
298
LANOMS 2005 - 4th Latin American Network Operations and Management Symposium
than reference condition” vote. Each test set is composed of 3 web pages. In total, each subject is presented with 18 web pages in tested conditions and 18 web pages in reference conditions.
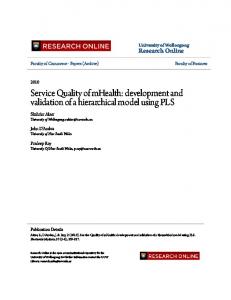
4 Statistical Analysis of Results The analysis presented below, addresses our original question as to which extent the user can perceive network QoS variations. The bar charts of Fig. 1 illustrate the distribution of responses given by the users for different network conditions.
Fig. 1. User responses aggregated in 5 and 2 categories, respectively.
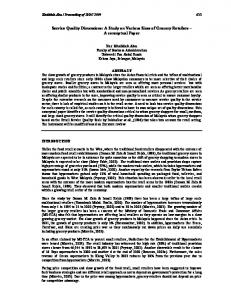
The first result is that users tend to over-estimate QoS. When the conditions are better than reference, most users guess it right. However, when they are subject to network conditions that are worse than the reference almost 70% of the users don’t seem to realize that (refer to the 2-category bar aggregation). Another evident result is that users are more accurate at perceiving gradients in service quality when network conditions are farther away from the reference condition. In general, they are less sensitive to a deterioration of network QoS especially when this is introduced gracefully. The effect that delay, jitter and bandwidth have on user perception of quality is captured by Fig. 2 and 3. It is clear that the predominant discriminating factors are latency and bandwidth, whereas jitter affects user perception only for lower levels of latency. This result was quantitatively verified using the ANOVA technique. Furthermore, Fig. 2 indicates that increasing bandwidth beyond 128kbps (at 600msec latency) does not improve user perception. Conversely, from Fig. 3 we can infer that decreasing bandwidth below 128kbps (at 600 msec) does not noticeably decrease user perception of QoS. These results can be used to conserve bandwidth by avoiding combinations of network parameters falling within the plateau areas. Also, this indicates that the most convenient range of bandwidth allocation for web browsing services over UMTS, in terms of preserving network resources with the minimum user disruption, is comprised between 64 and 128kbps.
LANOMS 2005 - 4th Latin American Network Operations and Management Symposium
Fig. 2. Perceived quality, Jitter = 30%
Fig. 3. Perceived quality, Jitter=50%
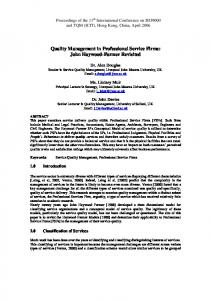
5 Discussion and Conclusions The study of user-centered QoS management is still in its infancy. Its application to the area of mobile service deployment has not yet been fully addressed. In this respect, the work presented herein intends to spark a new approach to effective network and service management. The information that can be extracted from methodological subjective studies, such as the one presented herein, can be used to complement the QoS management & control mechanisms available in current data networks. By determining the degree of influence that network parameters have on user perception the network operator can, then, implement suitable QoS control policies which have at least two benefits: 1. They aim at meeting QoS demand at user perception level. In most cases, users do not care about low-level network QoS parameters. Their QoS demand is at application level. 2. They aim at optimizing the demand that user QoS poses onto network resources. From the operator’s viewpoint, once its service level agreement with the user is satisfied, it is important to minimize the use of over-the-air resources. The work presented herein represents the first, important step towards building individual prediction models for QoS-enabled mobile services. These can be integrated in the QoS management system as depicted in Fig. 4. The stipulation of service level agreements (SLAs) between user and operator is part of service subscription and is not depicted in Fig. 4. The SLA parameters are mapped onto the relevant service prediction model. This leads to the determination of the value of network QoS parameters (i.e., delay, jitter, bandwidth), which are actually used by the operator to dynamically allocate suitable resources to the service. Following that, there is the conventional monitoring & control loop, which ensures that user demands are satisfied. Our next target is to build a mathematical prediction model for the ‘mobile web browsing’ service over UMTS. We can then carry out a subjective study aimed at further verifying the benefit of our ‘User-Centric QoS Management’ approach in terms of user quality of experience. In this way we shall also be able to quantify the
299
300
LANOMS 2005 - 4th Latin American Network Operations and Management Symposium
savings in terms of network resources for the benefit of the network operator. Furthermore, it will be then interesting to reuse these methodology and testbed to different classes of services with particular attention to real-time constrained services. Service A QoS Prediction Model Service B QoS Prediction Model
User Invokes Mobile Service (SLA parameters)
Select model
Service Z QoS Prediction Model
Monitor Network QoS parameters
map SLA parameters to Prediction model
Configure Network QoS parameters
Fig. 4. Use of user-centric QoS prediction models in network management.
References 1. M. A. Sasse, A. Bouch and H. Demeer, "Of packet and people: A user centered approach to quality of service", In Proc. of IWQoS2000, June 2000. 2. A. Bouch, A. Kuchinsky and N. Bhatti, "Quality is in the Eye of the Beholder: Meeting Users' Requirements for Inter", In Proc. CHI 2000, April, 2000. 3. K. Asplund and A. Brunstrom, "An Evaluation of User Web Service Requirements", In Proc. 2nd Annual Knowledge Foundation, Skövde, Sweden, April 22-24, 2002. 4. Shunra/Cloud, Version 4.0, by Shunra Software Ltd, 2004 (http://www.shunra.com/products/cloud/cloud_1.php). 5. ITU-T, "Methods for objective and subjective assessment of quality", P.800, August 1996. 6. D. Rossi, C. Casetti, M. Mellia, "User Patience and the Web: a hands-on investigation", In Proc. IEEE Globecom 2003, San Francisco, CA, USA, December 1-5, 2003.