2012 Third International Conference on Computer and Communication Technology
User Centric Retrieval of Learning Objects in LMS A Sai Sabitha
Deepti Mehrotra
Dept of CS &IT Krishna Engg College Ghaziabad, Uttar Pradesh, India
[email protected]
ASCS Sector 44, Noida, Uttar Pradesh, India
[email protected]
management system ILMS where need to develop the general framework and a running architecture to support the adaptive life cycle (i.e., design, publication, use and monitoring), which focuses on a user-centered experience and also construct the required models based on standards to support adaptive learning scenarios which combine LMS-based design solutions and intelligent analysis of users' interactions. Data mining tools that can lead classification or clustering, techniques to comprehensively-gather and carefully-analyze data which can support decision making has proved to be very useful in retrieval of learning objects. Indeed the quality metrics can be suitable for Ranking Learning Object. A large amount of research has been conducted for identifying quality metrics with respect to Meta Data, Reusability and Relevance of Learning Object.
Abstract— Research and Academic Institutions own and archive a great number of documents like lesson plan, study material and research related resources, which are needed to be stored and used over for a longer period of time by lecturers and researchers. In order to achieve this it is required to convert these educational resources into Learning Objects and store them in structured & meaningful way via a learning management system (LMS) thus enriching classical teaching. Also with enhancement of e-learning environment there is a great need of managing the LMS repositories by storing information resources as Learning object, a digital entity which can be used in electronic learning environment. These learning objects are stored in repositories and are managed by Learning Management Systems. It aids teaching and learning process and helps in communications between users. Many designs of LMS are non user-centric and has limited capabilities in delivering user preferred learning material. Searching through keywords or metadata of learning material will result in display of huge quantity of information. Thus there is an earnest need to identify the techniques that can provide more efficient mechanism for information retrieval. Recommendation techniques have shown to be successful in many domains (e.g. movies, books, music, etc.). Thus there is a need to deploy a recommending system in the E-Learning domain to extend the functionality of standardbased learning management systems with providing the user based retrieval. In this paper a model is being proposed that can enhance the search and delivery of a relevant learning object based on his/her preferences and further ranking & clustering of learning objects are done through K-Mean and Self Organising Maps for a personalised learning environment.
II.
A. Learning Management System (LMS) Learning Management Systems (LMS) provide an infrastructure platform through which learning content is delivered and managed. It provides a combination of software tools that perform a variety of functions related to online and offline training administration and performance management. Typically, an LMS is internet-based software that Deploys, Manages, Tracks, Reports the interaction between the learner and the content, and the learner and the instructor . The following “Fig 1a” illustrates the logical framework of a Learning portal site that includes both LMS (for content delivery) and LCMS (for content development)[35] .
Keywords— Learning Objects (LO); Quality Metrics; Clustering; Self Organizing Map; K-mean; Ranking.
I. INTRODUCTION Personal Learning Environments can change the way in which students consume information through non electronic or electronic learning such as learning management system (LMS). Electronic learning features instant updating, storage and retrieval, distribution and sharing of information. The paradigm of LMS is an emerging technology aimed towards facilitation of management of massive amount of educational resources available in e-learning environment.LMS can offer a great variety of channels and workspaces that can facilitate information sharing and communication among participants in a course. To provide users concise or high quality knowledge of different contexts is still a key challenge in domain of designing LMS. Today we need an Intelligent Learning 978-0-7695-4872-2/12 $26.00 © 2012 IEEE DOI 10.1109/ICCCT.2012.13
LITERATURE SURVEY
Figure 1a.Logical Frame of a portal with of LMS and LCMS
14
B. Learning Objects Learning objects according to experts are [1][2][3] “any entity, digital or non-digital, which can be used, re-used or referenced during technology supported learning”. Learning object refers to digital educational resources and metadata refers to description to facilitate search and administration. Learning Objects are a new way of thinking about learning content design, development and delivery. The conceptual representation[13] of learning object is represented below in Fig1b:-
D.Quality Metrics The Learning Objects undergoes Creation, Selection & Retrieval phases and many quality metrics had been defined for these phases. Quality of the learning objects and its metadata in learning repository are considered as one of the most important factors [18] [19] [2] in Creation phase. The quality of metadata can be manual [19] [20] [21] or statistical [20][21]. In Selection& Retrieval stage designing metrics suite for identifying the quality and the relevance of particular learning object is also one of the core research objectives. Some of the ranking methods are through human [26], ease of use,text similarity in search engine[17] These ranking procedures have issues like scalability, quality etc. Borlund [27] defines four independent types of relevance like algorithm based, topical, situational, and personal. Duval [28] had defined nine “quality in context” or relevance characteristics of learning objects. Xavier [4] had mapped Duval [28] characteristics with Borlund [27] characteristic and identified relevance index for the learning objects.This study will help retrieval of quality information. In Reusable stage, technological and human issues[24]are given priority and researches are being conducted towards it. When these objects are reused they are economical & have pedagogical advantages [22]. Though creation cost of learning object is high [23] but reusing them compensates for the cost. Recently quantitative analysis on reusability of learning objects is also defined. In our study we had tried to cluster the learning objects on the quality metrics of LO, by using data mining technique.
Figure 1b. Conceptual Representation of LO To describe a learning object Contributor, Subject, General Descriptive Attributes, Granularity Levels[13] are required. The standards for Metadata specification are, ARIADNE, DC, IEEE LOM, IMS & ADL. The standards for Content Structure Modeling are SCORM, AICC. IMS & ADL/SCORM handle both Metadata specification and Content Structure Modeling. Here we have considered metadata like topic, sub topic, educational level under general Descriptive Attributes of Learning attributes for clustering. The Life Cycle of Learning Objects undergoes design, development and usage phase [11][29][30]. The actors involved in life cycle of a learning object are Author, Publisher, Repository Maker, Policy Maker, Teachers and Students.
E.Relevance Metrics Searching of learning objects through metadata gives an appropriate object based on user preference. Ranking these learning objects based on relevance will lead to better selection process[36]. We can use various metrics which have been broadly identified by Xavier [4]. i) Topical relevance Metric:-This relevance metric takes into consideration the topic (domain), sub domain of interest to a user. The metadata of a learning object, the topical preferences of the previous learners, and their usage pattern of learning objects are few factors through which we can select and quantify the relevant learning objects. ii) Personal relevance Metric:-The learning preferences of an individual are taken into consideration in this metric. Various preferences can be obtained by storing profiles of user and further can be compared with the characteristics features of a learning object Meta data. iii) Situational Relevance Ranking Metrics: - Situation relevance is based on the task or the learner’s need for object is searched. This information helps in further ranking of objects. Yan [25] had followed three steps which include assigning weights to objects according to time series or assigning rank metrics in a specific order in accordance with users’ query.
B. User Centric Retrivel Personalization is one of the most challenging research topics in Learning objects retrieval since all users are treated same & estimation of the relevance of retrieved objects are solely based on a short user query. A detailed user model to interpret his/her need is required [31] [34].During the Learning process when Learners access LMS, it captures their Profiles, Interests and their Preferences. The attributes captured are name, age, gender, education qualification etc. and can be stored in a learner model. These attributes are more descriptive which can be converted to compact representation space in a digital format [32] which can be helpful to retrieve user centric Learning Objects [33] along with learning object metadata. Thus an user-centric learning approach is created through which students can improve their learning skills.
15
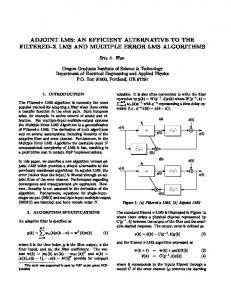
and relevant delivery of Learning Objects using data mining techniques can be achieved. The proposed skeletal model is shown in “Fig. 2”
F. Normalization Methods Data transformation such as Normalization [12] is a data Pre processing tool used in data mining system. An attribute of a dataset is normalized by scaling its values so that they fall within a small-specified range, such as 0.0 to 1.0. Normalization is particularly useful for classification algorithms involving neural networks, or distance measurements such as nearest neighbour classification and clustering. The methods for data normalization include minmax normalization, z-score normalization and Normalization by decimal scaling. x Min Max Normalization: Min-max normalization performs a linear transformation on the original data. Min-max normalization maps a value ‘v’ to new value of the range [new_min(x), new_max(x)]. The min-max normalization is calculated by the following formula:-
x
V. EXPERIMENTS & RESULTS
Z-score normalization: also called zero-mean normalization. The values of attribute X are normalized using the mean and standard deviation of X. A new value new_v is obtained using the following expression:
Figure 2.Users Centric Recommender System
V. EXPERIMENTS & RESULTS A. Data Set for Experimentation The data set chosen for the experiment contains the metrics measured on below parameters of given learning objects:i) Topical Relevance a)T1 – Topic b)T2 –Sub Topic c)T3-Author ii) Personal Relevance a)P1- age b)P2-Educational Level c)P3-Age iii)Situational Relevance a)Time b)Space-Geo Learning Space The attributes are in columns, row represent the particular LO and the value associated to (row, column) represents measured metrics. They are imported into the data mining tool. Refer “Fig. 3a” for a skeletal user interface of t1, t2, t3 etc. Refer “Fig.3b” for a personal Search interface represented for p1,p2,p3. Refer “Fig.3c” for Situational search interface represented for s1,s2,s3.
where and are the mean and standard deviation of attribute X, respectively. III. CLUSTERING Clustering is a discovery process in data mining. It groups a set of data in a way that maximizes the similarity within clusters and minimizes the similarity between two different clusters.Clustering algorithm can be broadly classified as partition based (K-MEAN, Clarans), hierarchical based (Diana, Agnes), Density based (DBSCAN) & Kohonen’s SelfOrganizing Maps (SOM)[5][6].This technique is widely used in areas like document collections[7], knowledge extraction [8] and Learning Object Extraction in e-learning. Use of SelfOrganizing Map (SOM - Kohonen model) of neural network to cluster these high dimensional objects is proposed by Patric Ferreira [9].Here in this paper we have used both K-MEAN and SOM approach to cluster data set. IV. SCHEMATIC MODEL According to the model given below, the learning objects along with knowledge objects are stored in the LMS. Based on the learner preferences, learner’s profile are stored in the learner model. The quality of LO is measured with the help of metric server. The clustering algorithms are defined within the clustering engine. This engine will cluster the LO as per ranks of the measured metrics. Thus, we can retrieve the more apt learning objects by searching the similar clusters. Clustering is done on the Ranked data. In this way efficient
Figure 3a. User Interface for Topical Search
16
C.Steps for K-mean & SOM We add a DEFINE STATUS component into the diagram for K-mean. The number of clusters define are four, Max iterations are ten & random seed random generator is chosen. The “Fig 6” shows the cluster size and WSS value for the normalized data. The SOM component adds a new column to the dataset named as “Cluster_Som”. It states the group membership of each instance. It is represented in Fig “7”.
Figure 3b.User Interface for Personal Search
Figure 3c. User Interface for Situational Search
B.Tanagra Tool Kit The dataset analysis was done using TANAGRA tool kit. It is software that has several data mining and statistical tools for analysis [10]. The five metrics title/domain, subtitle, education, age, time were collected for 400 different LO. The ranks are of continuous data type Refer “Fig 4”. These ranks are normalized based on min max normalization technique and are loaded into Tanagra tool Refer “Fig 5”.
Figure 6. K-Mean cluster with WSS and R-Square
Figure 4. Data Set of ranks based on metrics (Un normalized) Figure 7. SOM VIEW [Parameters & cluster centroids
D .Scatter Plot of K-Mean The Scatter plots allow us to visually evaluate the proximity between observations. We project the observations in two dimensions. In the analysis, domain is taken in x-axis and subdomain in y axis. The Scatter Plot of K-Mean is shown in “Fig. 8” Figure 5. Data Set of ranks based on normalized data
17
groups are the more homogenous each group is and vice versa. Thus, RS may be considered as a measure of the degree of difference between clusters. Further, it measures the degree of homogeneity between groups. The values of RS range between 0 and 1. If the value of RS is zero (0) indicates that no difference exists among groups. On the other hand, when RS equals 1 there is an indication of significant difference among groups. In “Fig 9” the value of R lies between.73 to .76 which is closer to 1.
Figure 8.Scatter Plot for K-Mean
E. Validation of clusters Since clustering algorithms discover clusters, which are not known priori, the final partitions of a data set requires some evaluation in most applications. Quality of the clustering can be measured under three approaches external criteria, internal criteria (proximity matrix) and relative criteria. One of the most commonly used methods involves clusters cohesion and separation. Cluster Cohesion which Measures how closely related are objects in a cluster (SSE) and Cluster Separation measures how distinct or well separated a cluster is from other clusters (Squared Error).
Figure 9.R-Square Value iii) We had used min max normalization for ranked data & other methods like Z-score normalization can be used. Based on Learner preferences, interest and profiles stored in LMS the objects are ranked during retrieval. RS is considered as a measure of degree of difference between the clusters & are shown that there is a significant difference among the clustered groups and the number of learning objects retrieved to a user using clustering is significantly lesser than total number of learning objects
VI. CONCLUSION i) Cluster Cohesion (SSE) & Cluster Separation (Squared Error) are evaluated by WSS (within cluster sum of squares) and BSS (between cluster sum of squares) respectively:-
VII. FUTURE SCOPE Thus by clustering the Learning objects we can improve the educational processes and reduce the difficulty in finding a particular educational resource to the user. In this paper we had ranked and normalised the objects based on quality metrics & had clustered them. Based on user feedback as another metrics we can cluster the objects for more appropriate retrieval of objects. We have used K-Means &SOM techniques of data mining for clustering ranked learning objects. Now further analysis can be done with various combinations of user centric descriptive attributes of learning objects as inputs and targets for clustering.The conventional SOM training algorithm handles only numeric data. Categorical data are usually converted to a set of binary data before training of a SOM takes place. But the Learning objects metadata, user profile, user’s preferences etc. will hold categorical values. Chung-Chian Hsu [16] proposed clustering categorical data using Self Organising Map and using such tool LO can be clustered, and ranked before delivering it to the users .A more efficient user centric retrieval of objects can be obtained.
These indicators allows us to easily evaluate different clustering’s techniques (theoretically, the one with lowest WSS and highest BSS is the best).A good cluster has small values of WSS and high value of BSS. Here we use this cluster validation to identify the cluster to be retrieved by evaluating WSS for them. In Fig “6” the cluster size & WSS are calculated and the clusters can be ranked as “c_kmean_2”, “c_kmean_4”, “c_kmean_3”, and “c_kmean_1”. Thus learning objects of c_kmean_2 cluster can be fetched first since WSS is smaller. As shown in “Fig:6” the total number of learning objects in “c_kmean_2” cluster are 68 hence instead of 400 learning objects only 68 Learning objects will be considered for delivery to the user in first go ii) RS of the new cluster is the ratio of BSS to TSS. Since TSS =BSS + WSS the greater the BSS the smaller the WSS and vice versa. As a result, the greater the differences between
18
[24]. Littlejohn A. (2003). Reusing Online Resources: A Sustainable Approach to E-Learning, chapter Issues in reusing online resources, pages 1–7.Kogan Page Ltd. [25]. Yan, R. and Hauptmnn, A. (2006). Efficient margin-based rank learning algorithms for information retrieval. In Leow, W.-K., Lew, M. S., Chua, T.-S., Ma, W.-Y., Chaisorn, L., and Bakker, E. M., editors, Proceedings of the International Conference on Image and Video Retrieval(CIVR), number 4071 in Lecture Notes in Computer Science, pages 113–122,Tempe, AZ. Springer Berlin / Heidelberg. [26]. Nesbit, J., Belfer, K., and Vargo, J. (2002). A convergent participation model for evaluation of learning objects. Canadian Journal of Learning and Technology, 28(3):105–120. [27]. Borlund, P. (2003). The concept of relevance in IR. Journal of the ASIT, 54(10):913–925. [28]. Duval, E. (2005). Policy and Innovation in Education – Quality Criteria, chapter Learn Rank: the Real Quality Measure for Learning Materials, pages 457–463.European School net. [29]. Use of Contextual zed Attention Metadata for Ranking and Recommending Learning Objects by Xavier in CAMA’06, November 11, 2006, Arlington, Virginia, USA. Copyright 2006 ACM 1-59593-524-X/06/0011 [30]. http://ariadne.cti.espol.edu.ec/Learnometrics/quality.html [31]. Dealing with heterogeneity in profiles forPersonalized nformation Retrieval by Pavel SerdyukovDatabase Group, University of Twente. [32]. Eerika Savia,Sami Jokela MetaData Based Matching of Documents and User Profiles In Proceedings of finish Artificial Intelligence Conference ,STEP’98. [33]. S.R Heiyanthuduwage -A Learner oriented Ontology of Metadata to improve Effectiveness of LMS .Third International Conference on e-learning for knowledge based society ,August34,2006;Bangkok,Thailand. [34]. J. Teevan, S. T. Dumais, and E. Horvitz, “Personalizing search via automated analysis of interests and activities,” in SIGIR ’05: Proceedingsof the 28th annual international ACM SIGIR conference on Research anddevelopment in information retrieval, 2005 [35]. http://www.cognitivedesignsolutions.com/
VIII. REFERENCES [1]. Barron T (2000, November). “Learning Object Pioneers. Retrieved31July,2005,from:http://www.learningcircuits.org/2000/m ar2000/barron.htm [2]. IEEE LTSC (2002). IEEE Standard for Learning Object Metadata.1484.12.1-2002.Availablehttp://ltsc.ieee.org/wg12/ [3]. Wiley, D. A. (2000).Connecting learning objects to instructional design theory: A definition, a metaphor, and taxonomy. In D. A. Wiley (Ed.), the Instructional Use of Learning Objects: Online Version. Retrieved March 20, 2004, from http://reusability.org/read/chapters/wiley.doc. [4]. Xavier Ochoa and Erik Duval Relevance Ranking Metrics for learning objects IEEE transactions on learning technologies, vol. 1, no. 1, January-march 2008. [5]. Kohonen, SOM. 3. ed. Berlin: Springer-2001 [6]. KASABOV, N. K. Foundations of Neural Networks, Fuzzy Systems, Knowledge Engineering. 2. ed. Cambridge: The MIT Press,1998 [7]. Kaski, S., Honkela, T., Lagus, K., and Kohonen, T. “WEBSOM – Self-organizing maps of document collections”. Neuro computing, v.21, 1998, p. 101-117. [8]. Ultsch, A. “Knowledge extraction from self-organizing neural networks” In Opitz O. (Ed.). Information and Classification. Springer, 1993. [9]. Clustering of Learning Objects with Self-Organizing Maps by Patric Ferreira da Silva and Pollyana Notargia como Mustaro, Mackenzie Presbyterian University©2009 IEEE October 18 21,2009,SanAntonio,TX39thASEE. [10]. http://eric.univlyon2.fr/~ricco/tanagra/en/tanagra.html. [11]. Data mining in course management systems: Moodle case study and tutorial [12]. J. Han, and M. Kamber- , “Data Mining: Concepts and Techniques”,Second edition, 2006, Morgan Kaufmann, USA. [13]. Neil Y. Yen, Timothy K. Shih Senior Member, IEEE 2010Ranking Metrics and Search Guidance for Learning Object Repository. [14]. Miltos Stratakis –Se Le Ne. E-Learning Standards IST-2001-39045 in 2003 [15]. SCORM (2005). Sharable Content Object Reference Model Available at http://www.adlnet.org/scorm/index.cfm. [16]. Generalizing Self-Organizing Map for Categorical Data ChungChian Hsu 294 IEEE TRANSACTIONS ON NEURAL NETWORK VOL. 17, NO. 2, MARCH 2006 [17]. Ashutosh Kumar Singh, Ravi Kumar P.A Comparative Study of Page Ranking Algorithms for Information Ashutosh Kumar Singh, Ravi Kumar P International Journal of Electrical and Computer Engineering 4:7 2009 [18]. Barton, J., Currier, S., and Hey, J. M. N. (2003). Building quality assurance into metadata creation: an analysis based on the learning objects and e-prints communities of practice. In Sutton S., Greenberg, J and Tennis, J., editors, Proceedings 2003 Dublin Core Conference [19]. Stvilia, B., Gasser, L., and Twidale, M. (2006). Information quality management: theory and applications, chapter Metadata quality problems in federated collections, pages 154–18. Idea Group, Hershey, PA. [20]. Bui, Y. and Park, J.-r. (2006). An assessment of metadata quality: A case study of the national science digital library metadata repository. In Moukdad, H., editor, Proceedings of CAIS/ACSI 2006 Information Science Revisited: Approaches to Innovation, page 13. [21]. Najjar J, Ternier S, and Duval E. (2004). User behaviour in learning objects repositories: An empirical analysis. In McLaughlin, L.C. . C., editor, Proceedings of the ED-MEDIA 2004 World Conference on Educational Multimedia, Hypermedia and Telecommunications, pages 4373–4378. AACE. [22]. Campbell, L. (2003). Reusing Online Resources: A Sustainable Approach to E-Learning, chapter engaging with the learning object economy, pages 35–45. Kogan Page Ltd. [23]. Wilhelm P. and Wilde, R. (2005). Developing a university course for online delivery based on learning objects: from ideals to compromises. Open Learning: The Journal of Open and Distance Learning, 20(1):65–81.
[36] A Sai Sabitha,Deepti Mehotra .Quality Metrics quanta for Retrieving Learning Object by Clustering Techniques. The Second International Conference on Digital Information and Communication Technology and its Applications(DCTAP2012). 978-1-4673-07345/12©201 IEEE.
19