User Profiling for Fraud Detection in Telecommunication Networks Constantinos S. Hilas
John N. Sahalos
Technological Educational Institute of Serres, Serres 621 24, Greece
[email protected]
Aristotle University of Thessaloniki, Thessaloniki 541 24, Greece
[email protected]
Abstract - Telecommunications fraud is increasing dramatically each year resulting in loss of a large amount of euros worldwide. A statistical machine learning method is presented that constructs user profiles for the detection of fraudulent activities in telecommunications networks. The approach presented here can be used for the detection of superimposed or hacking fraud, works well for mid-term decisions and cannot be used for on-line account comparison.
huge data sets which are constantly evolving. Data sets can be as large as tenths of thousands of calls per weekday for an organization with 3 or 4 thousand employees to hundreds of millions of calls for national carriers. Reference [1] provides a classification of telecommunication systems fraud and divides frauds into one of four groups, namely: contractual fraud, hacking fraud, technical fraud and procedural fraud. In Ref [3], twelve distinct fraud types are identified. The authors of the present article have witnessed fraudulent behavior that is a combination of the above mentioned ones. In one case the fraudster obtained the ability to place international and mobile calls, by gaining a legitimate PIN to use with the private PABX of an organization as an employee of the organization, but had no intention of paying for these services (contractual fraud). Adding to this, he gave the PIN to others (hacking fraud) who also used the service without paying. In another case, an employee of the organization, with special technical knowledge managed to deceive the system and obtained a PIN that belonged to another person. He then started using the PIN, pretending to be the legitimate user and burdened the legitimate user’s account (superimposed fraud). In the first example, fraud can only be identified once it has happened and the only countermeasure is the discontinuance of the subscription to the service. The case of the second example is more complex. Once the fraudster pretends to be another user he can carefully place only a small amount of calls. The legitimate user may never understand the fraud unless his account becomes high or unless he gives a thorough look to an itemized account of his calls. The aim of this paper is to present a machine learning method, which constructs user profiles and compares them with future activities of the user for the identification of the latter case of fraud.
Index Terms – Fraud detection, user profiling, user characterization, telecommunications
I. INTRODUCTION The Cambridge Advanced Learner’s Dictionary defines fraud as “the crime of obtaining money by deceiving people”, while the Concise Oxford Dictionary defines it as a “criminal deception; the use of false representations to gain an unjust advantage.” Nowadays, due to the development of new technologies, traditional fraudulent activities, such as money laundering, have been joined by new kinds of fraud like telecommunications fraud and computer intrusion. Fraud is increasing dramatically each year resulting in loss of a large amount of euros worldwide. Telecommunications fraud can be simply described as any activity by which service is obtained without intention of paying [1]. Using this definition fraud can only be detected once it has occurred. So it is useful to distinguish between fraud prevention and fraud detection [2]. Fraud prevention is all the measures that can be used to stop fraud from occurring in the first place. These, in the case of telecommunication systems, include Subscriber Identity Module (SIM) cards or any other Personal Identification Number (PIN) like the ones used in Private PBXs. No prevention method is perfect and is usually a compromise between effectiveness and usage convenience. Fraud detection, on the other hand, is the identification of fraud as quickly as possible once it has happened. The problem is that fraud techniques are constantly evolving and whenever a detection method becomes known, fraudsters will adapt their strategies and try others. In Ref [3] the legal rules applying in various fields of law affected by the use of fraud detection systems in mobile communications are determined. Confidentiality and personal data protection are key issues in this report. The development of fraud detection methods and the exchange of ideas in it is limited by the fact that it makes no sense to describe the methods in detail, as it gives fraudsters the information they require to evade detection. Another difficulty is that fraud detection problems involve
II. USER PROFILING The main idea behind user profiling is that past behavior of a user can be accumulated in order to construct a profile or a “user dictionary” of what might be the expected values of the user’s behavior. This profile contains single numerical summaries of some aspect of behavior or some kind of multivariate behavioral pattern. Future behavior of the user can then be compared with his profile in order to examine the consistency with it (normal behavior) or any deviation from his profile, which may imply fraudulent activity. An important issue is that we can never be certain that fraud
has been perpetrated. Any analysis should only be treated as a method that provides us with an alert or a “suspicion score”. That is, the analysis provides a measure that some observation is anomalous or more likely to be fraudulent than another. Special investigative attention should then be focused on those observations. Fraud detection methods can be supervised or unsupervised [2]. Supervised methods are those where samples of both normal and fraudulent behavior are used to construct models, which enable the system to assign new observations to one of the two classes. One must have data of both classes and should also be sure about the true class in which original observations belong to. Moreover, this method can only identify known fraudulent activities. Unsupervised methods simply seek those observations that are dissimilar from the norm. They usually deal with outlier or any other extreme data detection. Several techniques have been proposed for the construction of user profiles. Most of the work has been done in the area of computer intrusion detection. Research in telecommunications fraud detection is mainly motivated by fraudulent activities in mobile technologies [1, 3, 6, 9]. The techniques used come from the area of statistical modeling like rule discovery [7, 11], clustering [8], Bayesian rules [9], or neural network classification [10]. Combinations of more than one method are usually used [12]. In [13] one can find a bibliography of work on fraud detection, mostly centering on the use of data mining and machine learning methods for detecting fraud automatically. Traditionally, in computer security, user profiles are constructed based on any basic usage characteristic such as resources consumed, login location, typing rate and counts of particular commands. In telecommunications, user profiles can be constructed using appropriate usage characteristics. The aim is to distinguish a normal user from a fraudster. The latter is, in most of the cases, a user of the system who knows and mimics normal user behavior. All the data that can be used to monitor the usage of a telecommunications network are contained in the Call Detail Record (CDR) of any PBX. The CDR contains data such as: the caller ID, the chargeable duration of the call, the called party ID, the date and the time of the call, etc [14]. In mobile telephone systems, such as GSM, the data records that contain details of every mobile phone attempt are the Toll Tickets. Trying to build a user profile, the first goal is to construct the basic building block that is a fundamental unit of comparison. Different units of comparison can be selected, depending of the type of the network and the type of fraud that is to be detected. One can use usage indicators, related to the way a telephone is used, mobility indicators, related to the mobility of the telephone, if it is mobile and deductive indicators, which arise as a by-product of fraudulent behavior, e.g. overlapping calls and velocity checks. The simplest usage indicator and the basic unit of comparison is the data per call, i.e. date and time, duration, caller ID, called No, cost of call. Another simple unit can be a sequence of all the data of the calls that were made
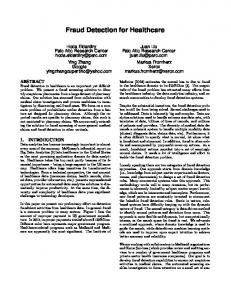
within a day. A third possible unit of comparison is the accumulated behavior per day. That is a sequence which is constructed by the number of calls made to local destinations, the duration (or the cost) of local calls, the number of calls to mobile destinations, the duration (or the cost) of mobile calls, the number of call to national or international destination and their corresponding duration. This per day accumulated behavior of a user is a basic measure of the usage of his terminal and may be a measure that differentiates him from other users. In the this paper, an approach to user profiling in telecommunications, is discussed, based on the latter basic unit of user behavior. The empirical results demonstrate that such an approach yields high differentiation measures between users, and it is an interesting basis for future research. An important advantage of this measure is that it hides all personal information of the user, e.g. caller or called party ID. This allows for the protection of the privacy of users during the experimentation for the development of any fraud detection technique. III. DESCRIPTION OF THE METHOD In order to develop a system that detects fraudulent behavior, a user profile must, first, be constructed to characterize normal behavior. Under an ideal situation both normal and abnormal behavior of a user should be known. It is assumed that any behavior not present in the historical data, represents fraudulent behavior or another user. All data used were first examined by a field expert to identify that no fraudulent behavior was present. The main hypothesis is that user profiles are consistent for the same user, but are different between users. So, once a user profile is formed, a similarity measure should be applied in order to compare new incoming input vectors with past user behavior. The fundamental unit of comparison is an eight element vector that consists of the number of calls made to local destinations (loc), the duration of local calls (locd), the number of calls to mobile destinations (mob), the duration of mobile calls (mobd), the number of calls to national (nat) and international (int) destination and their corresponding durations (natd, intd). All input vectors are compared with those present in the user profile and are classified as consistent or inconsistent with it. Sequences of more that one vector can also be used. The length of the sequence must be the same for a single run. A. Similarity measure. The most straight forward method is the equality function, which returns a TRUE when all elements of both sequences are one-by-one equal and FALSE otherwise [4]. A more plausible rule, called “rcontiguous bits”, is based on regions of contiguous matches. The rule looks for r contiguous matches between sequences in corresponding positions. Reference [5] uses a similar approach to detect anomalies in computer systems usage. If a sequence, seq1, has k equal points with two other sequences, (seq2 and seq3), but the common points
with the first one are in neighboring positions then similarity(seq1, seq2) > similarity(seq1,seq3). loc
locd
mob mobd nat natd
int intd
Fig. 1 The fundamental vector of comparison
In the present paper two levels of similarity are identified. In the first level the equality of the number of the calls of the same category is examined. This can give a similarity score bounded between 0 and 4. In the case where sequences of m basic vectors are used the similarity score will be between 0 and m*4. Suppose, for example, that the behavior of two users is to be compared. Let seq1={3, 252, 1, 58, 0, 0, 0, 0} be the vector representing some day’s usage for the first user and seq2={3, 231, 1, 58, 1, 128, 0, 0} be the corresponding vector for the second one. The first level similarity between the two users is 3, because of the equalities at elements 1, 3 and 7, which are, in fact, similarities between the numbers of calls to similar destinations. The second level of comparison is the comparison of total call duration per category, which is only made if the corresponding number of calls yields equality. Thus the final similarity score is bounded between 0 and m*8. Using the aforementioned example one may check only for equalities between elements 2, 4 and 8. This comparison gives a value of second level similarity equal to 2. So the total equality between the two vectors is 5. Two problems arose from this similarity measure. The first one is that it is very common between users not to place any international calls for days. This zero count will increase similarity between accounts. Adding to this, zero number of calls yields zero call duration which gives more hits in favor of similarity between accounts. Under this consideration and after experimental results, situations with zero number of calls were omitted from the similarity measure counting. The second problem is that even in the case of equal, for example, number of local calls there is little chance that the corresponding duration will be exactly equal. So, an “equality interval” was used. Two durations are considered equal if the first lies within an ±X percent of the value of the second. This relaxed equality implies fuzziness in the system and the appropriate value for X was another point of experimentation. Under these considerations and for X=0.1 the similarity between the sequences of the previous example is, finally, 4. This is because seq1(1)=seq2(1), seq1(3)=seq2(3), seq1(4)=seq2(4) and 0.9*seq2(2) ≤ seq1(2) ≤ 1.1*seq2(2). Hence, the algorithm works as follows: 1. Start with k profiles and k test sets, 2. Select the length m of the sequence (seq) (seq = m*unit vector) 3. For each profile - test pair Select the first sequence from the test set Set similarity=0 Compare this sequence with the profile set
FOR each position, i, in the sequence length IF position i holds Number-Of-Calls info THEN IF seqtest(i)=seqprof(i) AND seqtest(i) ≠0 THEN similarity=similarity+1 record the position, i, of equality ELSE IF position i holds Duration info THEN IF current position is next to the previous position of equality THEN IF seq(i) ≠0 AND seqtest(i)=(1-X)*seqprof(i) THEN similarity = similarity +1 4. After all positions examined return the measure values and store the maximum value as the highest similarity measure between the first test sequence an the profile under comparison. 5. Store the vector containing the maximum values resulting after the repeated comparisons between all sequences from a test set with a profile set. 6. Repeat for all profile – test set combinations (k2 vectors). In this sense the similarity of a single sequence, i, drawn from the test set, seqitest, with all the sequences in the profile set K, seqj∈K, is defined as: i i similarity ( seqtest , K ) = max{ similarity ( seqtest , seq j )} (1) j seq ∈K
and is the similarity of that sequence with the most similar sequence in the profile set. Once all the k2 similarity vectors are computed, one can compare them to make decisions about the similarities between users’ behavior. Let us for example examine the case where the test set from User1 is compared with the k available user profile sets. If the starting hypothesis is true then the highest vector similarity should point out the pair User1test – User1profile. In other words, the hypothesis means that a user profile is expected to be consistent with itself. Under this assumption, once a representative user profile has been constructed, one can use it for comparisons with future user behavior. Any variation of a user’s profile may imply the existence of fraudulent behavior. This variation can trigger an alarm which will stimulate the staff of the Network Operations Center (NOC) to thoroughly examine the specific user’s account. IV. EXPERIMENTAL RESULTS The experiments were designed to test the hypothesis that users’ behaviors differ from each other when a proper behavior unit is used. Additional questions posed were a) the similarity measure that gives the maximum differentiation between user profiles and b) the appropriate statistic for the comparisons of the tests. In order to construct user profiles, CDRs from the PBX of a University, with more than five thousand users, were collected for one year. We are only interested in outgoing traffic because it is the kind that causes economic burden to the University. Incoming calls are not used in the present
4
3.5
Similarity Score
3
2.5
2
1.5
1
0.5
0 0
20
40
60 Sequence No
80
100
Fig. 2 Visualization of early similarity vector
6
5
Similarity Score
4
3
2
1
0 0
10
20
30
40 50 Sequence No
60
70
80
90
Fig. 3 Same similarity vector after “smoothening” manipulation
0
6 4 2 0
0 20 40 60 Similarity of Sample3 with Profile1
4 2
0
20
40
60
2
0 20 40 60 Similarity of Sample2 with Profile2 6 4 2 0
0 20 40 60 Similarity of Sample3 with Profile2 Similarity Score
6
4
0
Similarity Score
Similarity Score
0 20 40 60 Similarity of Sample2 with Profile1
6 4 2 0
Similarity of Sample1 with Profile3 Similarity Score
2
6
0
20
40
60
6 4 2
0 0 20 40 60 Similarity of Sample2 with Profile3 Similarity Score
4
0
Similarity of Sample1 with Profile2
6 4 2
0 0 20 40 60 Similarity of Sample3 with Profile3 Similarity Score
6
Similarity Score
Similarity Score
Similarity of Sample1 with Profile1
Similarity Score
study. Pubic service numbers and outward movement of dial-up modem calls are included in the set of local (loc) calls. It is noticed that the periods that a user is on a leave are not taken into account. Twelve telephone terminals were randomly selected and groups, of three terminals each, were formed. For the selected terminals the accumulated daily behavior was constructed. For each day the corresponding eight element vector was created (Fig. 1). So for each terminal a 365 x 8 matrix was created. Each terminal’s activity was divided in two parts, the train set (actually the user profile) and a test set at a split of 2/3 to 1/3 respectively. Similarity vectors for each pair of train (profile) and test set were computed by means of the aforementioned algorithm. The first questions posed were the proper length of the sequence and the consideration or not of zero values in the calculations. Preliminary experiments to that direction showed that the appearance of the similarity vector was very rough when m=1 and zero values were counted in the calculations (Fig 2). Under the considerations of chapter III zero values were omitted from the calculations. The exclusion of zero values also excludes the periods a user is on a leave. The variability of the plot in Fig. 2 led us to use some kind of smoothening filter on the similarity vector. The first thought about some moving average method was superseded by another thought. The length, m, of the sequence used, has an internal smoothening effect on the similarity vector. This property was used here. The plot in Fig. 2 transformed into Fig. 3 after using a value of m=3 and excluding zero values in the calculations of similarity vector. For each group of terminals the similarity vectors were computed. Plots of the resulting vectors, for one of those groups, are given in Fig. 4. Each row, n, represents the similarity of test set n with each profile set. The starting hypothesis in the design of the experiments was that a user profile is consistent, when compared with the same user, but differs when compared with others. The most straight forward comparison is the comparison of means of each similarity vector. The significance of this measure can be tested by means of an ANOVA test or k pair-by-pair t-tests.
6 4 2 0
0
20
40
60
Fig. 4 An example of similarity vectors for three profile – test sets (Group1)
The mean of each vector in Fig. 4 is presented in Table I. Note that the diagonal elements have the biggest values. T-tests were used to test the equality of means between similarityij and similarityii.. Table II lists the probability that the corresponding mean value (in Table I) is equal to the mean similarity of the same user. In this example the value of the relaxed equality factor was X=0. Observe that in the first row of (Tables I and II) the mean value for the comparison of test set 1 with profiles 1 and 3 gives values that are equal at a significance level of 39.83%. Experimentation with X led to the empirical estimation of its value close to X=0.15. The application of this value to the calculations with the same group (Group1) resulted to the values of Tables III and IV. Tables V – VI, show the aforementioned statistics for another group of terminals (Group2). An interesting point of the experiments is revealed here. Although the diagonal values of Table VI are the highest for the row they belong to, there is an issue with Profile6. It seems like all test sets fit equally well with this profile, (see, column 3 of Table VI). In order to check this, t-tests were also run for the columns of this group (Table VII). Note the high equality
probability for the elements of column 3. Further investigation about Profile6, revealed that it was a public phone. Being used by many different people may have given this terminal the property to fit with anybody’s behavior. In order to further search the dependence of user profiles on their real identity, another test was performed. The case of a retired employee of the University was examined. In such a case the phone terminal comes to the use of the new employee who takes the retired person’s office. The activity of the phone for 750 days before the retirement day (User7) was compared to its activity for 750 days after the installation of the new employee (User8). The outcome of this comparison is shown in Table VIII. Finally, six pairs of completely different accounts were used in order to specify the minimum size of test data that are necessary for one to decide that two accounts are probably different. At each step, of comparison, the size of the test data was incremented by one sequence. The probability of similarity for each pair is plotted in Fig. 5. In the same figure the mean probability for each step (pdif) is also plotted. The lowest the value of probability the most probable it is for the pairs to be different. High differentiation between accounts (80%) is succeeded after 13 sequences (39 days). From the above, it is concluded that the approach presented here can be used for midterm decisions and cannot be used for on-line account comparison. V. CONCLUSIONS AND DISCUSSION A statistical machine learning method is presented that constructs user profiles for the detection of fraudulent activities in telecommunications networks. User profiles are constructed in such a way that all personal information of the user, e.g. caller or called party ID, is hidden. This allows for the protection of the privacy of users during the experimentation for the development of the fraud detection technique. The approach presented is simple and can be applied in different and diverse fields like fixed or cellular phones, web usage and computer intrusion detection. Another key issue is that only eight features are used for the comparison between accounts. Other approaches, like [9], use from 28 up to 86 key features for the construction of user profiles. The empirical results demonstrate that such an approach yields high differentiation measures between users, and it is an interesting basis for future research. This work, also, gives an insight on the units of comparison that can be used and seems easily transferable to a neural or fuzzy network implementation. One point of interest is the identification of any additional criteria that can be applied for the identification of a user when thresholds are exceeded. These criteria must meet the privacy requirements posed and they may be based on
publicly known features of the user. In the case of the University employees, who are examined in the present paper, such a feature could be their home telephone number (home phone numbers of the University’s employees are published yearly). If an alarm, that a user has changed behavior, is set, one can examine whether or not the user’s home number is in the set of the phone numbers he calls. This can apply additional proof for his identity. 1 0.9
Probability of similarity
0.8 0.7 data1 data2 data3 data4 data5 data6 pdif psim
0.6 0.5 0.4 0.3 0.2 0.1 0 0
5
10 15 20 25 30 Number of (3−day) sequences used
35
40
Fig. 5 Plot of similarity probability between accounts against the data used in the test set
The main point is that there is no clue that the activity of an account is fraudulent or not. The only clear conclusion is that a differentiation measure between accounts exists which gives motivation for further research. The appearance of such a difference can trigger an alarm, in order to stimulate the NOC’s staff to further investigate the suspected account. The question of whether this technique can be applied equally well to any user is still open.
ACKNOWLEDGMENTS The authors would like to thank the members of the Aristotle University Telecommunications Center for their contribution of data. REFERENCES [1] P. Gosset and M. Hyland, “Classification, detection and prosecution of fraud in mobile networks,” Proceedings of ACTS Mobile Summit, Sorrento, Italy, June 1999. [2] R. J. Bolton and D. J Hand, “Statistical fraud detection: a review,” Statistical Science, vol. 17, no. 3, pp. 235–255, 2002. [3] ACTS ACo95, project ASPeCT: “Legal aspects of fraud detection,” AC095/KUL/W26/DS/P/25/2, July 1998. [4] S. Forest, S. Hofmeyr, and A. Somayaji, “Computer Immunology,” Communications of the ACM, 1996. [5] T. Lane and C. E. Brodley, “An Application of Machine Learning to anomaly detection,” Proc. 20th NIST-NCSC National Information Systems Security Conference, 1997. [6] Y. Moreau et al, “Novel Techniques for Fraud Detection in Mobile Telecommunication Networks”, ACTS Mobile Summit, Granada, Spain, 1997. [7] G. Adomavicious and Al. Tuzhilin, “User profiling in Personalization Applications through Rule Discovery and Valitation,” Proc of SIGKDD 99, San Diego, CA, USA, 1999. [8] S. H. Oh and W. S. Lee, “An anomaly intrusion detection method by clustering normal user behavior,” Computers & Security, Vol. 22, No. 7, pp 596-612, 2003. [9] R. Buschkes, D. Kesdogan and P. Reichl, “How to increase security in Mobile Networks by Anomaly Detection,” Proceedings of the 14th Annual Computer Security Applications Conference (ACSAC '98). 8, 1998. [10] C. Manikopoulos and S. Papavassilliou, “Network Intrusion and Fault Detection: A Statistical Anomaly Approach,” IEEE Communications Magazine, pp 76 – 82, October, 2002. [11] T. Fawcett and F. Provost, “Adaptive Fraud Detection,” Data Mining and Knowledge Discovery, Kluwer, 1, pp 291 – 316, 1997. [12] C. Phua, D. Alahakkon and V. Lee, “Minority Report in Fraud Detection: Classification of Skewed Data,” ACM SIGKDD Explorations – Special Issue on Imbalanced Data Sets, vol. 6 (1), pp 50 – 58. [13] T. Fawcett and C. Phua, "Fraud Detection Bibliography", Accessed From: http://liinwww.ira.uka.de/bibliography/Ai/fraud.detection.html, 2005. [14] S. F. Hinde, “Call Record Analysis,”Making Life Easier - Network Design and Management Tools (Digest No: 1996/217), IEE Colloquium on, pp. 8/1 – 8/4, 1996.