USING 5 ms SEGMENTS IN CONCATENATIVE SPEECH SYNTHESIS Toshio Hirai †
Seiichi Tenpaku
Arcadia Inc. 3–1–15 Nishishoji, Minoh, Osaka 5620003, Japan
[email protected]
ABSTRACT A concatenative speech synthesis system increases its potential to generate natural speech if the system uses more short speech segments, since the concatenation variation becomes greater. In this paper, we propose the use of very short speech segments (5 ms, one pitch period of 200 Hz pitch) for concatenative speech synthesis. The proposed method is applied to the speech database CMU ARCTIC, and 100 sentences synthesized. Though the synthesized speech maintains the speaker’s identity and is natural enough, it also has some noises caused by inappropriate unit selection, and the formant changes are awkward in some vowel regions. 1. INTRODUCTION Speech synthesis technology is one method of transmitting information from computers to humans. For the construction of a speech synthesis system, numerous speech samples are recorded and analyzed. The analyzed results are stored in a database (DB) in a form convenient for speech synthesis (“analysis stage”). In the synthesis stage, attribute parameters (“targets”) that will realizes synthesized speech according to the transmission information are estimated, appropriate information for realizing the targets is obtained from the DB, and speech is synthesized using the information. Speech synthesis methods are categorized into two types: parameter synthesis and concatenative synthesis. In the parameter synthesis method, speech samples are encoded into like LPC parameters [1] and stored in a DB, and, then, they are decoded in the synthesis stage. In this method, speech data is encoded (usually compressed), so it is appropriate for cases where the memory storage size is not large. However, information is lost in the encoding process, and speech intelligibility degrades. On the other hand, in concatenative synthesis [2, 3], speech segments are concatenated as they are, or processed lightly, so speech intelligibility and the speaker’s identity are maintained. In this method, speech samples are stored in the computer as they are, requiring large storage capabilities. Additionally, this method results in large computational cost for searching for appropriate concatenation speech segments. However, with ever-increasing advancements in computer technology these days, these problems will soon be resolved. In both synthesis methods, processing is executed based on “segments” into which speech data is split. In a general synthesis system, the length of a segment is a phoneme or syllable. Since each segment is concatenated during the synthesis stage (in the case of parameter synthesis, the segment is decoded from a compressed waveform, or compressed information is decoded after concatenation), the synthesis quality will deteriorate if the standard of the speech unit boundary definition is not consistent [4]. † Currently, he is a member of ATR–SLT, Japan. Both of the e-mail addresses noted above, as well as
[email protected], are valid.
5th ISCA Speech Synthesis Workshop - Pittsburgh
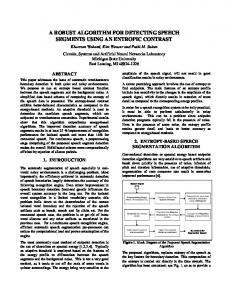
To maintain consistency, it has been proposed that the auto segmentation technique be employed [5]. According to Kishore et al., a syllable-based speech DB (which includes about 90 minutes of utterances) synthesizes the highestquality speech [6]. However, if the unit selection module works ideally, the use of short segments causes an increase in combination variation with the same size speech DB, and, as a result, the possibility of finding speech unit sequence which shows a small difference from the target unit sequence at each frame and small concatenation distortion increases. This merit is important since the size of the DB cannot be increased easily after the speech samples are recorded. Some research has been done on segments shorter than a phoneme: half-phoneme [3, 7], and 3- to 5-state HMM for a phoneme [1, 8]. The system which has the shortest segment length is based on parameter synthesis. There was a trial carried out, which applied the method to concatenative synthesis [9], but it did not attain the level where one can argue as to the quality of the synthesized speech. Therefore, it would be meaningful to realize such a short segment concatenative speech synthesis system, and to study the quality of the synthesized speech produced by the system from an academic point of view. Furthermore, since such a system is able to handle speech data thoroughly, the synthesized speech quality would become an objective measure of the speech DB if the speech unit selection module works ideally. In this paper, the use of short speech segments (5 ms, or one pitch period of the speech at 200 Hz pitch) for concatenative speech synthesis is proposed. In the proposed method, speech data is analyzed every 5 ms, and extracted features are stored in a speech DB in the analysis stage for system construction. The extracted features are the speech fundamental frequency (F0 ), power, and spectrum. In the synthesis stage, input text is used to estimate the feature time series (5 ms interval) as target vectors which are used to realize the required sound (step 1). Next, similar speech segments from the estimated features are searched for in the speech DB, and the N -best segments are selected as candidates in each frame (step 2). Finally, all combinations of the candidate connections are evaluated, and the unit sequence which shows the lowest connection distortion is concatenated in order to generate synthesized speech (step 3). The processing flowchart is given in Figure 1. In the usual synthesis system, input text is used to estimate the target vectors. However, in the proposed method, in order to focus on the problems of unit selection, target vectors are taken from natural speech sounds which would not include any unnaturalness in the vectors. Therefore, some type of estimation module that transposes text input into target vectors for the completion of the proposed method into a usable synthesis system is required. An HMM-based speech synthesis system [1, 8] is one candidate for such a module. The HMM-based system estimates the target vectors from text, and the output is entered into the system of the
37
I. Analysis Stage
F0 (Hz)
5 ms
Speech Waveform
5 ms
600 pau
/ao/
/th/
/er/ /ah/
/v/ (/dh/)
500 400
II. Synthesis Stage Time
unit-A
Input Text
unit-B [ Step 1 ] Feature Estimation
200
unit-C F0,pow,spc
F0,pow,spc
300
F0,pow,spc
100 1 level = 0.1 0
frame 1 F0,pow,spc
1st
2nd
--
frame 2 F0,pow,spc
--
1st
2nd
frame 3 F0,pow,spc
1st
--
2nd
frame 4 F0,pow,spc
--
1st
2nd
[ Step 2 ] Find 2-best Candidates in Each Frame ("1st" and "2nd") [ Step 3 ] Find the Best Path and Concatenate 2-best Candidates (bold arrows) Output Unit Sequence: unit-A + unit-B + unit-C + unit-B
Fig. 1. Processing flowchart of analysis/synthesis stages. The number of analyzed speech feature vectors is quite simplified (only three frames) in this example. In a real system, the number would approximately become “(the total duration of speech in the DB in ms) / 5.” The number of estimated feature vectors is also simplified. proposed method. This paper is organized as follows: Section 2 details the analysis/synthesis stages, and in Sections 3 and 4, experiments in which the method is applied and the results of the experiments are described. Discussions and a Summary conclude the paper. 2. SPEECH SYNTHESIS WITH 5 ms SEGMENTS 2.1. Analysis stage Sound, in which speech is included, has three features: pitch, power, and tone. In order to capture these features in speech, three features are extracted from speech: F0 , power, and spectrum. A concatenative speech synthesis system usually has a large quantity of speech. In such a system, it is desirable to extract the features automatically in order to reduce extraction cost. In the case of F0 extraction, it is difficult to get stable results. If errors are included in the speech DB, they cause some serious problems, such as degradation of synthesis quality. In order to avoid such errors in F0 extraction, it is not the scalar F0 value (as in usual speech synthesis systems), but the part of the power spectrum which includes information lower than 600 Hz (that is, the range of F0 ), that is treated as F0 information. In the next subsection, one example of F0 representation in this method is shown. The remaining features are taken from Mel cepstrum information: The zeroth order is treated as power, and the parameters from the first order are treated as spectral vector information.
100 ms
Time
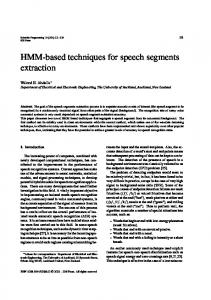
Fig. 2. F0 representation in power spectrum contours. The speaker is a female named slt [10]. The phrase is taken from the initial part of the utterance a0001, “Author of (the).” The height represented by contours is the normalized power spectrum. speech synthesis. At each point of time, the nearest N segments (“N -best”) are searched for in the speech DB as concatenation candidates. In order to search for similar segments, the distortion measure of each feature must first be defined. After that, these measures are integrated into one measure using some kind of weight. In this method, the root mean square (RMS) between the parts of the power spectral vectors of the target segment and the segment in the speech DB is adopted as the F0 distortion measure: v u F0 u 1 N X dF0 = t {F0 tgt (i) − F0 db (i)}2 . (1) NF0 i=1 The absolute value of the difference is adopted as the power distortion measure: dpow = |powtgt − powdb |.
(2)
And the RMS between the cepstrum parameter vectors is adopted as the spectrum distortion measure: v u mcep u 1 NX {mceptgt (i) − mcepdb (i)}2 . (3) dspc = t Nmcep i=1 In these formulas, NF0 means the order of the F0 part in the power spectrum, Nmcep means the order of the Mel cepstrum, and F0 ∗ (i), pow∗ , mcep∗ (i) refer to the (i-th) elements of each parameter vector. Additionally, the suffixes ∗tgt and ∗db mean the units are units of the target or speech DB. In the power spectral representation of F0 , the zeroth order (DC component) is eliminated, and each original element value is divided by the summation of the elements in order to remove the contribution of power. After this processing, the summation of new elements becomes 1: NF0
X i=1
NF0
F0tgt (i) =
X
F0db (i) = 1.
(4)
i=1
2.2. Taking N -best step in synthesis stage
Figure 2 is one example of F0 plotting in power spectral representation of the phrase “author of.” Each feature is normalized with its mean and standard deviation (S.D.) assuming normal distribution.
As mentioned in the Introduction, feature time series, which are extracted from natural speech, are treated as target vectors for
Next, we optimize the weight for each feature for the integration. One method of optimizing the weights is to evaluate the
5th ISCA Speech Synthesis Workshop - Pittsburgh
38
dseg = dF0 + dpow + dspc
Amp.
naturalness of the synthesized speeches in many weight combinations subjectively, and then find some relationship between the naturalness and the weights. According to preliminary experimental results (10 sentences were selected randomly and each sentence was synthesized with linear weighting for the three features, and the weight was 1, 2, or 3), there was no apparent tendency toward increased naturalness of the synthesized speech with some special weight combination. Therefore, in the experiments, the simplest summation of the three features, that is,
(1)
(2)
(2’)
(5)
is defined as the integrated distortion measure for searching for the N -best candidates. The measure corresponds to the “target cost” in conventional synthesis systems.
(3)
5ms
2.3. Selection/concatenation step in synthesis stage It is reported that the Kullback-Leibler distance (KL distance) between the power spectra at the concatenation points of segment p and segment q dKL =
NFFT FFTp (i) 1 X {FFTp (i) − FFTq (i)} log NFFT i=1 FFTq (i)
(6)
shows the highest detection rate of concatenation discontinuity [11]. In this formula, NFFT is the order of the power spectrum, and FFT∗ (i) is the normalized power spectrum at the concatenation points of the segments. Since the distance is used to measure the difference between two probability density functions, the summation of probability (in this case, the power spectrum) in the whole area must be 1. By this normalization, power information in the power spectrum is eliminated in KL distance. Therefore, in order to add power information for the distance measure, a new distortion measure which is the product of the second power of KL distance and the ratio of power r dKLr = d2KL r
(7)
is proposed. The reason why the second power of KL distance is adopted is that the results using this distance showed better synthesized speech in preliminary experiment. In this formula, r is the ratio of the root means of the original power spectrum FFT∗ at the concatenation points of the segments: ap /aq (for aq 5 ap ), r= (8) aq /ap (for ap < aq ), v u FFT u 1 N X FFTp or q (i). (9) where ap or q = t NFFT i=1 It becomes large when the difference between ap and aq becomes large. At each point of time, one unit is selected from the candidates, and the mean concatenation distortion dKLr is calculated from each concatenation boundary distortion dKLr (i). The distortion corresponds to the “concatenation cost” in conventional synthesis systems. The unit sequence which shows the smallest dKLr is used to generate synthesized speech. For the optimal unit sequence search, Dijkstra’s shortest path search algorithm [12] is adopted. Speech segments are concatenated in phase with fade-in/out of previous/post-segment ends (cross-fade method). A concatenation processing example is illustrated in Figure 3. If there is no phase at the concatenation point (e.g., voiceless consonant), the segments are just faded-in/out.
5th ISCA Speech Synthesis Workshop - Pittsburgh
Time
Fig. 3. Waveform concatenation processing example. In the case of the concatenation of the first segment (solid line in square of (1)) and the second segment (solid line in square of (2)), the second segment is shifted (solid line in (2’)) according to the correlation coefficient between both waveforms, overlapped with weights (dotted lines, weighted with dashed lines) between the vertical bars (8.33 ms (+ 1000/120), see Subsection 3.3), and added (line in (3)). 3. SYNTHESIS EXPERIMENTS 3.1. Speech material and computational abilities As the speech material, we used speaker slt in the public domain speech data (recorded in 16 kHz, 16 bits) for speech synthesis [10]. The sentences are phonetically balanced. There are 1,132 sentences in the material. From them, 100 sentences (a0100–a0199) were preserved to generate target features for speech synthesis experiments, and the remaining 1,032 sentences were used as the speech DB for synthesis. The initial/final 50 ms regions were eliminated from target feature extraction since there might be no speech signal. (N OTE: It is found that there are speech signals in such regions. For example, a0129’s final /t/, see Figure 6.) For the synthesis experiments, a computer with a 2.4 GHz CPU and 768 MB memory was used. The highest calculation priority was given to the processes with the “renice” command in the Linux OS (“renice -20 process-ID”). 3.2. Analysis conditions These are the segment analysis conditions: Frame length was 512 points (= 32 ms) with Hanning windowing, the step width was 80 points (= 5 ms). For the extraction of F0 information, the part of the power spectrum (from 1st to 19th orders, corresponding to the spectrum range lower than 600 Hz, approximately) was used. For the extraction of power and tone information, we used the “mcep” command in Tokuda’s Speech Signal Processing Toolkit [13]. The order was 12, the zeroth order was treated as power, and the remaining orders were treated as tone information. The resultant NF0 and Nmcep were 19 and 12, respectively. The α value for mcep command was set to 0.42 according to the application document. N was set at 300. These are the analysis conditions for distortion measurement at the segment edge: Frame length was 256 points (= 16 ms) with 0.97 pre-emphasis and Hanning windowing. The step width was
39
In the segment concatenation step, the width of fade-in/out was set to 8.33 ms, which was the wavelength of the speaker’s lowest F0 (120 Hz). The width is the interval of the vertical bars in Figure 3. The shift allowance length was set to half the pitch period at the lowest F0 (±4.17 ms). The minimum correlation coefficient threshold realized as a synchronized phrase pair was set to 0.6.
: /iy/ : /ax/
1
0.8 : /ih/
3.3. Concatenation conditions
In DB Phoneme
80 points (= 5 ms). Half of the power spectrum (128 points) was used for distance calculation. The resultant NFFT was 128.
0.6
0.4
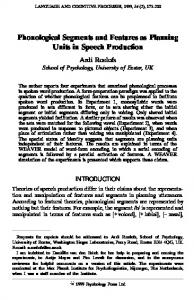
4. RESULTS 4.1. Synthesized speech and its distortion The one hundred synthesized speeches are accessible at the following home page: http://www.arcadia.co.jp/˜thirai/ssw5 2004/results/. The mean concatenation distortion dKLr of the synthesized speeches was 0.208 and S.D. was 0.0393. Three distortion level samples are shown in Figure 4 (minimum, dKLr : 0.121), Figure 5 (average, 0.207), and Figure 6 (maximum, 0.300). The maximum distortion is 4.048 at 0.139 s in Figure 6. 4.2. Correspondence of relative position of segment forming /ih/ with its original relative position In the proposed method, there are no limitations for a segment in the speech DB to be used as any phoneme kind or at any position in synthesized speech. In order to investigate the randomness of the origin of the kind and the position, a phoneme kind was chosen for examination. The chosen kind was /ih/ (e.g., the first ‘i’ of “Philip” in utterance a0001), which occurs most frequently in the synthesized speech (204 times). The analysis results are shown in Figure 7: x axis means the relative position of a segment which belongs to /ih/ phoneme in a synthesized speech (0: at the starting point of the phoneme, 1: at the end of it), and y axis means the relative position of the segment which is used to form /ih/ in synthesized speech. The phoneme boundary information which was used for the relative position calculation was taken from the attached label data of the public speech DB. There were 2,203 segments in the synthesized /ih/ phonemes. The origin of the segments was investigated. As a result, the top three phonemes made up more than 50% of all the segments (/ih/: 32.9%, /ax/: 11.8%, /iy/: 7.1%), and the top eleven phonemes made up more than 80% (the other phonemes were: /ey/, /eh/, /n/, /uw/, /ay/, /ae/, /aa/, /z/). The top three phonemes are distinguished in the figure. 4.3. Calculation cost The mean and S.D. of the calculation time to synthesize one second of speech was 2302.16 s and 14.12 s. In other words, it takes about 3 × 2302.16/60/60 = 1.92 hours for three seconds of synthesized speech. Almost all the calculation time was spent on the N -best candidate selection. 5. DISCUSSIONS According to an informal evaluation test of synthesis quality, it was confirmed that the generated speech maintained the speaker’s identity and it maintained the naturalness of the original speech. However, some phonemes which caused synthesis degradation were found in the synthesized speeches. For example, in the region
5th ISCA Speech Synthesis Workshop - Pittsburgh
0.2
0 0
0.2
0.4 0.6 In TGT Phoneme (/ih/)
0.8
1
Fig. 7. Plotting of segment’s relative positions in synthesis phoneme /ih/ vs. in the phoneme of speech DB. Horizontal axis represents the relative position of the target segment in the phoneme /ih/, and vertical axis represents the relative position of the selected unit in the phoneme to which the unit belongs. The diagonal line is added for reference. The unit selected from speech DB to form /ih/ was in /ih/ (‘˜’), in /ax/ (‘×’), in /iy/ (‘+’), or in other phonemes (‘·’). 0.61∼0.62 s of the synthesized speech of Figure 6, there are two impulse noises, and they degrade the speech naturalness. The noises were not caused by concatenation, but got mixed in with the segments. It is possible to cite two causes for the problem. (1) Some inappropriate segments were selected as N -best candidates. It would be suppressed by introducing a threshold for dseg to select candidates since the constant candidate number N could not remove such inappropriate segments. It raises fresh questions about setting the threshold value. (2) There was no consideration of dseg for the calculation of the mean concatenation distortion dKLr . The integration of dseg into dKLr would solve the problem, and it would be a new subject of study to decide the best way for such integration. Also, it raises fresh questions about setting the weight value in the integration formula. In any case, it is necessary to introduce new free parameters and to define a new integration formula. In order to optimize the parameters and definitions effectively, it is important to come up with a faster synthesis system which can carry out tests under many experimental conditions. Another frequently found problem was awkward formant transition in vowel regions. For example, in Figure 4, though the third format around 2.2 s (/ow/) in the original speech moves from 2 kHz to 1 kHz smoothly, the imitation failed in the synthesized speech (around 2.2 s). It might be caused by problems in N -best unit selection or in final unit sequence searching, but the more likely cause may be the lack of unit variation in the speech DB. It is clear from Figure 7 that the segments which belong to various kinds of phonemes at various relative positions in the phoneme were used to synthesize phoneme /ih/, though many segments in /ih/ (‘˜’) were located around the diagonal line. (In phonemebased synthesis systems, all the points are ‘˜,’ and they are all on the diagonal line.) It may suggest that the proposed method used
40
kHz
7 6 5 4 3 2 1
Hz 400 300 200 100
pau dh ey Time (s)
kHz
l uh
k ae
z dh
owhh
iyhhae
d bih
n d
ah r
m ih
ngax
p
iy
ae n ow
ao
l hhih
z l
ay
pau f
0.2
0.4
0.6
0.8
1.0
1.2
1.4
1.6
1.8
2.0
2.2
2.4
2.6
2.8
3.0
0.2
0.4
0.6
0.8
1.0
1.2
1.4
1.6
1.8
2.0
2.2
2.4
2.6
2.8
3.0
7 6 5 4 3 2 1
Hz 400 300 200 100
Time (s)
Fig. 4. Synthesized speech which shows minimum dKLr (bottom) with original speech (top). Utterance is a0159: “They look as though he had been drumming a piano all his life.” In each panel, the spectrogram, expanded spectrogram (0˜500 Hz, for F0 pattern displaying) with automatically detected F0 points generated by the algorithm of ESPS in the WaveSurfer [14], waveform, and phoneme labels (attached to the speech data [10], given by automatic segmentation) are drawn from top to bottom. The label boundaries at the bottom of the synthesized speech waveform show the concatenation points. kHz
7 6 5 4 3 2 1
Hz 400 300 200 100
pau hh iyhh ae Time (s)
kHz
d
n
owih
k
s
k y uw
s
0.2
0.4
0.6
0.8
1.0
1.2
0.2
0.4
0.6
0.8
1.0
1.2
ao f r dhax 1.4
f iy
lih
1.6
er er
aw
1.8
ng z
w ih ch 2.0
w 2.2
2.4
2.6
z dih 2.8
n hh ih 3.0
m 3.2
pau
1.8
2.0
2.2
2.4
2.6
2.8
3.0
3.2
7 6 5 4 3 2 1
Hz 400 300 200 100
142:0_8e−05_323_328 Time (s)
1.4
1.6
Fig. 5. Synthesized speech which shows mean dKLr with original speech. Utterance is a0115: “He had no excuse for the feelings which were aroused in him.” Also see the explanation below Fig. 4. the segments in the speech DB effectively. In the synthesized speech of Figure 6, the maximum distortion point was at 0.139 s. However, there was no audible discontinuity at that point. It may mean that the definition of dKLr needs to be improved upon. As mentioned in Subsection 3.3, the phase shift allowance was about 4 ms. If the spectral change is very fast (e.g., around /r/) and
5th ISCA Speech Synthesis Workshop - Pittsburgh
the unit is shortened considerably during shifting, the change can be eliminated in the synthesized speech. It may be effective to use shorter units around such rapid spectral changes to trace them, and to also set the shift allowance shorter.
41
kHz
7 6 5 4 3 2 1
Hz 400 300 200 100
pau pau Time (s)
kHz
hh
er
f
ey
s
w aa
z ax
g
eh
n
s
thh ih
z
b
r
eh
s
pau t
0.1
0.2
0.3
0.4
0.5
0.6
0.7
0.8
0.9
1.0
1.1
1.2
1.3
1.4
1.5
1.6
1.7
1.8
1.9
0.1
0.2
0.3
0.4
0.5
0.6
0.7
0.8
0.9
1.0
1.1
1.2
1.3
1.4
1.5
1.6
1.7
1.8
1.9
7 6 5 4 3 2 1
Hz 400 300 200 100
Time (s)
Fig. 6. Synthesized speech which shows maximum dKLr with original speech. Utterance is a0129: “Her face was against his breast.” Also see the explanation below Fig. 4. 6. SUMMARY This paper has presented a new concatenative speech synthesis system for handling very short segments. The segment duration is 5 ms, one pitch period of 200 Hz speech. Synthesis experiments of 100 sentences were also carried out using the utterances of speaker slt in the public speech DB. The generated speech sometimes includes noise, but it is confirmed that the naturalness of the original speech is maintained. It seems that new free parameters need to be introduced to prevent the mixing in of unexpected segments which include noise. In order to improve the quality of synthesized speech, dynamic features (not only the features at the point, but also the features at the adjacent points), which were excluded to reduce calculation cost in this paper, should be considered. The handling of F0 information is different from the conventional system: the system uses part of the power spectrum as F0 information. Such representation allowed for stable modeling of F0 . The calculation cost was more than 2,000 times the synthesized speech duration. Speeding up this process is one of the most important problems to be resolved. In this paper, the target features were taken from natural speech. Therefore, in order to integrate the proposed system into a complete speech synthesis system, a module which transforms the input text into target feature time series is necessary. An HMM speech synthesis system is one candidate for the module. That is, the feature information is gotten from the HMM system, and it is entered into the proposed method. Regarding the dseg definition, there is no need for it to be the linear summation of the features. The definition should be modified into a more reasonable one which is in line with human auditory perception. 7. REFERENCES [1] R. E. Donovan and P. C. Woodland, “Improvement in an HMM-based speech synthesizer,” in Proc. Eurospeech95, pp. 573–576, 1995.
5th ISCA Speech Synthesis Workshop - Pittsburgh
[2] A. J. Hunt and A. W. Black, “Unit selection in a concatenative speech synthesis system using a large speech database,” in Proc. ICASSP, 1996. [3] A. Conkie, M. C. Beutnagel, A. Syrdal, and P. E. Brown, “Preselection of candidate units in a unit selection-based text-to-speech synthesis system,” in Proc. ICSLP, 2000. [4] T. Hirai, S. Tenpaku, and K. Shikano, “Using start/end timings of spectral transitions between phonemes in concatenative speech synthesis,” in Proc. ICSLP, 2002. [5] M. J. Makashay, C. W. Wightman, A. K. Syrdal, and A. Conkie, “Perceptual evaluation of automatic segmentation in Text-to-Speech synthesis,” in Proc. ICSLP, 2000. [6] S. P. Kishore and A. W. Black, “Unit size in unit selection speech synthesis,” in Proc. Eurospeech2003, Sept. 2003. [7] T. Toda, H. Kawai, M. Tsuzaki, and K. Shikano, “Perceptual evaluation of cost for segment selection in concatenative speech synthesis,” in Proc. IEEE 2002 Workshop on Speech Synthesis, Sept. 2002. [8] K. Tokuda, T. Yoshimura, T. Masuko, T. Kobayashi, and T. Kitamura, “Speech parameter generation algorithms for HMM-based speech synthesis,” in Proc. ICASSP, May 2000. [9] N. Mizutani, T. Yoshimura, K. Tokuda, and T. Kitamura, “A study on concatenative speech synthesis based on HMM,” in Rec. Spring Meeting, Acoust. Soc. Jpn., pp. 273–274, Acoust. Soc. Jpn., March 2002. In Japanese. [10] J. Kominek and A. W. Black, “CMU ARCTIC — databases for speech synthesis,” Tech. Rep. CMU–LTI– 03–177, Carnegie Mellon University, Language Technologies Institute, 2003. http://festvox.org/cmu arctic/ cmu arctic report.pdf. [11] Y. Stylianou and A. K. Syrdal, “Perceptual and objective detection of discontinuities in concatenative speech synthesis,” in Proc. ICASSP, May 2001. [12] A. V. Aho, J. E. Hopcroft, and J. Ullman, Data Structures and Algorithms. Addison-Wesley Pub. Co., 1982. [13] K. Tokuda, “Reference manual for Speech Signal Processing Toolkit ver. 3.0,” 2002. http://kt-lab.ics.nitech.ac.jp/˜tokuda/ SPTK/ (as of May, 2004). [14] “Wavesurfer,” 2004. http://www.speech.kth.se/wavesurfer/ (as of May, 2004).
42