Using a 3D geometrical model to improve accuracy in the evaluation and selection of countermeasures against complex cyber attacks Gustavo Gonzalez Granadillo, Joaquin Garcia-Alfaro, and Herv´e Debar Institut Mines-Telecom, Telecom Sudparis, SAMOVAR UMR 5157 9 rue Charles Fourier, 91011 EVRY, France {name.last
[email protected]}
Abstract. The selection of security countermeasures against current cyber attacks does not generally perform appropriate assessments of the attack and countermeasure impact over the system. In addition, the methodologies used to evaluate and select countermeasures are generally based on assumptions, estimations, and expert knowledge. A great level of subjectivity is considered while estimating parameters such as benefits and importance of the investment in cost sensitive models. We propose in this paper a decision support tool that uses a Return On Response Investment (RORI) metric, and a 3D geometrical model to simulate the impact of attacks and countermeasures on the system. The former is a cost sensitive model used to evaluate, rank and select security countermeasures against complex cyber attacks. The latter, is a tool that represents the impact of attacks and countermeasures in a three dimensional coordinate system. As a result, we are able to automatically select mitigation strategies addressing multiple and complex cyber attacks, that are efficient in stopping the attack and preserve, at the same time, the best service to legitimate users. The implementation of the tool and main results are detailed at the end of the paper to show the applicability of our model. Keywords: Countermeasure Selection, Geometrical Volume, Security Impact, CARVER, Response Actions
1
Introduction
Innovation in Information Technology has brought numerous advancements but also some consequences. Cyber attacks have evolved along with technology, reaching a state of high efficiency and performance that makes the detection and reaction process a challenging task for security administrators. Current research focuses on approaches to detect such sophisticated attacks and to demonstrate their robustness and the difficulty in their mitigation [1, 3]. On the contrary, research on mitigation strategies receives considerably less attention, owing to the inherent complexity in developing and deploying responses in an automated fashion. Mitigation strategies are part of a reaction process
2
Gustavo Gonzalez Granadillo, Joaquin Garcia-Alfaro, and Herv´e Debar
that requires security administrators to remediate to threats and/or intrusions by selecting appropriate security countermeasures. The definition of countermeasures to protect these systems is a process that requires a great expertise and knowledge. Inappropriate countermeasures may result in disastrous consequences for the organization [5]. Typically, the selection of a given countermeasure requires a manual intervention of security operators. No appropriate assessment of the countermeasure impact over the system is currently performed, and service dependencies among the numerous components of large systems in complex environments are not considered. There is a need for automated mitigation strategies addressing multiple and complex cyber attacks that enable to select optimal countermeasures that are efficient in stopping the attack and preserve, at the same time, the best service to legitimate users. An attack surface with regard to an information system being attacked is defined as a model that measures quantitatively the level of exposure of a given system, i.e., the reachable and exploitable vulnerabilities existing on the system [11]. Howard et al., [6] consider three dimensions to determine the attack surface of an operating system (e.g. Linux, Windows): Target and enablers, Channels and protocols, and Access rights. However, the approach does not provide a systematic method to assign weights to the attack vectors; it focuses on measuring the attack surfaces of operating systems; and it is not possible to determine if all attack vectors have been identified. Manadhata et al. [10] measure the attack surface of a software system (e.g., IMAP server, FTP daemons, Operating Systems) based on the analysis of its source code, through three dimensions: methods, channels, and data. However, in the absence of source code, the proposed methodology is useless. The damage potential estimation includes only technical impact (e.g., privilege elevation) and not monetary impact (e.g., monetary loss). The model only compares the level of attackability between two similar systems; no attempt has been made to compare the attack surface of different system environments. The method does not make assumptions about the capabilities of attackers or resources in estimating the damage potential-effort ratio. The methodology does not allow the security administrator to evaluate multiple attacks occurring simultaneously in a given system. Petajasoja et al. [13] propose an approach to analyze a system’s attack surface using CVSS. As a result, it is possible to identify most critical interfaces in order to prioritize the test effort. However, this approach limits the attack surface to known vulnerabilities, it is not meant to be used as a reaction strategy and only compares relative security of similar infrastructures. Microsoft has recently developed an attack surface analyzer tool [4], that identifies changes made to an operating system attack surface by the installation of new software. However the tool can be used only for Windows operating systems and is useless to measure a network attack surface.
Geometric Volume Model
3
Taking into account the aforementioned limitations, we propose in this paper a method of selecting countermeasures for a service of an information system, against complex cyber attacks. The method comprises: – identifying elements of the service exposed to the cyber attack(s), – calculating the return on response investment (RORI) of each countermeasure with respect to the cyber attack(s), – ranking the countermeasure(s) on the basis of the RORI metric – simulating the impact of the attack(s) and countermeasure(s) on the system, the countermeasure to be implemented being selected as a function of the result of the simulation. The rest of the paper is structured as follows: Section 2 introduces the Return On response Investment (RORI) index. Section 3 describes our proposed geometric volume model and details the different types of volumes considered in the approach, as well as the system dimensions. Section 4 discusses the methodologies to select optimal countermeasures. Section 5 presents our approaches to calculate the financial impact of attacks and countermeasures. Section 6 presents our model implementation and main results. Finally, conclusions and perspective for future work are presented in Section 7.
2
Return On Response Investment
The Return On Response Investment (RORI) was first introduced by Kheir et al. [8] as an extension of the Return On Security Investment ROSI [14]. RORI identifies three cost dimensions for intrusion response i.e. the response collateral damages (CD), the response operational costs (OC), and the response goodness (RG). This latter is computed as the difference between the expected intrusion impact before response (ICb) and the combined impact of intrusion and response (RC). The deployment of the RORI index into real world scenarios has presented the following shortcomings: – The absolute value of parameters such as ICb and RC is difficult to estimate, whereas a ratio of these parameters is easier to determine, which in turn reduces errors of magnitude. – The RORI index is not defined when no countermeasure is selected. Since the operational cost (OC) is associated to the security measure, the RORI index will lead to an indetermination when no solution is enacted (hereinafter denoted as NOOP). – The RORI index is not normalized with the size and complexity of the infrastructure. Gonzalez Granadillo et al. [5] propose an improvement of the RORI index by taking into account not only the countermeasure cost and its associated risk mitigation, but also the infrastructure value and the expected losses that may
4
Gustavo Gonzalez Granadillo, Joaquin Garcia-Alfaro, and Herv´e Debar
occur as a consequence of an intrusion or attack. The improved RORI handles the choice of applying no countermeasure and provides a response that is relative to the size of the infrastructure. RORI is used as a quantitative approach to evaluate, rank, and select a set of countermeasures. The proposed RORI index is calculated according to Equation 1. RORI =
(ALE × RM ) − ARC ARC + AIV
(1)
Where: – The Annualized Loss expectancy (ALE) refers to the impact cost that is produced in the absence of countermeasures. It is expressed in currency per year and includes loss of assets (La ), loss of data (Ld ), loss of reputation (Lr ), legal procedures (LP ), loss of revenues from clients or customers (Lrc ), as well as other losses (Lo ), contracted insurances (Ins), and the annual rate of occurrence (ARO) of the attack. ALE = (La + Ld + Lr + LP + Lrc + Lo − Ins) × ARO – The Annual Infrastructure Value (AIV ) corresponds to the fixed costs that are expected on the system regardless of the implemented countermeasure. AIV is strictly positive and is expressed in currency per year. AIV includes the following costs: equipment costs (Ce ), personnel costs (Cp ), service costs (Cs ) and other costs (Co ), as well as the resell value (Vr ). AIV = Ce + Cp + Cs + Co − Vr – The Risk Mitigation (RM ) refers to the risk reduction associated with a given countermeasure. RM is computed as the product of the Countermeasure Coverage (Cov, which corresponds to the percentage of the attack covered by the countermeasure) and the Effectiveness Factor (EF , which refers to the degree at which a countermeasure protects a target against an attack). RM = Cov + EF – The Annual Response Cost (ARC) refers to the costs associated to a given countermeasure. ARC is always positive and expressed in currency per year. It includes direct costs such as the cost of implementation (Cimpl ), the cost of maintenance (Cmaint ), as well as other direct costs (Cod ) and indirect costs (Ci ) that may originate from the adoption of a particular countermeasure. ARC = Cimpl + Cmaint + Cod + Ci
3
3D Geometrical Model
In analogy with access control models [7,9], we identified three main dimensions that contribute directly to the execution of a given attack: User account (subject), Resource (object), and Channel (the way to execute actions, e.g., connect, read, write, etc). This latter is represented as the transitions between subjects and objects. For instance, in order to access a web-server (object) of a given organization, a user (subject) connects to the system by providing his/her login and password (action).
Geometric Volume Model
3.1
5
Coordinate System
Our geometric model is proposed to represent services, attacks and countermeasures in a three dimensional coordinate system (i.e., user account, channel, and resource). User Account: A user account is a unique identifier for a user in a given system that allows him/her to connect and interact with the system’s environment. A user account is associated to a given status in the system, from which his/her privileges and rights are derived (i.e., system administrator, standard user, guest, internal user, or nobody). Channel: In order to have access to a particular resource, a user must use a given channel. We consider the IP address and the port number to represent channels in TCP/IP connections. However, each organization must define the way its users connect to the system and have access to the organization’s resources. Resource: A resource is either a physical component (e.g., host, server, printer) or a logical component (e.g., files, records, database) of limited availability within a computer system. We defined two levels of privileges (i.e., kernel, user), and seven levels of transitions (i.e., read, write, execute, and their combinations), and we assigned numerical values to each privilege and transitions based on their characteristics.
Resource
IP-Port
User Account
Table 1. Weighting Factor (WF) Results
Dimension Super Admin System Admin Standard User Internal User Guest Nobody Class 1 Class 2 Class 3 Class 4 Class 5 Public Private Reserved/ Special purpose Kernel & R-W-X Kernel & W-X/R-X/R-W Kernel & W/X Kernel & R / User & R-W-X User & W-X/R-X/R-W User & W/X User & R
C 10 8 6 4 3 1 10 8 7 3 2 8 5 2 10 8 6 5 5 3 1
A 9 8 7 5 3 1 9 7 8 2 1 7 1 1 10 9 7 5 5 3 2
R 8 7 6 4 2 1 8 6 5 3 1 5 4 3 9 9 7 7 6 5 2
V 10 9 7 6 5 1 8 5 7 4 3 7 3 1 9 9 8 7 5 3 1
E 10 8 7 5 4 1 7 5 5 3 1 6 4 1 9 7 7 6 4 2 1
R 9 7 5 5 2 1 8 6 6 5 1 5 3 1 9 8 5 6 5 3 3
Total 56 47 38 29 19 6 50 39 38 20 9 37 20 9 56 50 40 36 30 19 10
WF 5 4 3 2 1 0 4 3 3 1 0 3 1 0 5 4 3 3 2 1 0
6
Gustavo Gonzalez Granadillo, Joaquin Garcia-Alfaro, and Herv´e Debar
Each dimension contributes differently in the volume calculation. This contribution represents the criticality of a given element in the execution of an attack. Following the CARVER methodology [12], which considers multiple criteria (i.e., criticality, accessibility, recuperability, vulnerability, effect, recognizability), we assign numerical values on a scale of 1 to 10 to each entity within the dimension. Table 1 summarizes this information. As a result, we are able to represent graphically services, attacks and countermeasures in the same coordinate system. It is therefore possible to determine through geometrical operations the impact of attacks and countermeasures within a particular system, the residual risk (i.e., the volume of the system that is being attacked but is not covered by any countermeasure), as well as, the potential collateral damage (i.e., the volume of the system that is not being attacked but is covered by a countermeasure, and whose implementation could cause a damage over the target element). 3.2
Volume Calculation
The projection of the three axis in our coordinate system generates a parallelepiped in three dimensions. For a system S, having three vectors CoAcc (S), CoCha (S) and CoRes (S) in a three dimensional space R3 , these vectors form three edges of a parallelepiped. The volume of this parallelepiped is equal to the absolute value of the scalar triple product of all three vectors, as shown in Equation 2. V (S) = |CoAcc (X) · (CoCha (X) × CoRes (X))|
(2)
The volume calculation requires the computation of the contribution of each axis represented in the coordinate system. This contribution is determined as the sum of each set of axis entities (e.g., user account type, port class, resource type) times its associated weighting factor, as shown in Equation 3.
CoAxis (S) =
n X
Count(E ∈ T ypeAxis (S)) × W F (T ypeAxis (S))
(3)
i=0
3.2.1 System Volume It represents the maximal space a given system (e.g., S1) is exposed to users and attackers. This volume includes tangible assets (e.g., PCs, mobile phones, network components, etc.), as well as intangible assets (e.g., confidential information, business reputation, etc) that are vulnerable to known and unknown threats. Each of these assets are represented in the system volume as user accounts, channels, and/or resources. The system volume is calculated as the product of its dimension’s contribution, as shown in Equation 4. SV (S) = CoAcc (S) × CoCha (S) × CoRes (S)
(4)
Geometric Volume Model
7
3.2.2 Attack Volume Within the complete system volume exposed to attackers (including all possible vulnerable resources of the given system), we concentrate on a given attack to identify the portion of the volume being targeted based on the vulnerabilities it can exploit. These vulnerabilities are related to all the dimensions that comprise the system volume (i.e., user accounts, channels, and resources). The attack volume is calculated as the product of its dimension’s contribution, as shown in Equation 5. AV (A) = CoAcc (A) × CoCha (A) × CoRes (A)
(5)
The coverage (Cov) of a given attack (A) respect to a given system (S) is a value that ranges between zero and one. Such coverage is computed as the ratio between the attack volume overlapping with the system volume (AV(A∩S)) and the system volume (SV(S)), as shown in Equation 6: Cov(A/S) =
AV (A ∩ S) SV (S)
(6)
Where AV(A ∩ S) represents the volume that results from the elements of system (S) that are compromised by attack (A). 3.2.3 Countermeasure Volume The countermeasure volume represents the level of action that a security solution has on a given system. In other words, the countermeasure volume is the percentage of the system volume that is covered and controlled by a given countermeasure. An attack is covered by a countermeasure if their volumes overlap. The countermeasure can exceed the attack volume and cover part of the system that is not covered by the attack. The countermeasure volume is calculated as the product of its dimension’s contribution, as shown in Equation 7. CV (C) = CoAcc (C) × CoCha (C) × CoRes (C)
(7)
The coverage (Cov) of a given countermeasure (C) respect to a given attack (A) is a value that ranges from zero to one. Such coverage is calculated as the ratio between the countermeasure volume overlapping with the attack volume (CV(C ∩ A)) and the attack volume (AV(A)), as shown in Equation 8: Cov(C/A) =
CV (C ∩ A) AV (A)
(8)
Where AV(C ∩ A) represents the volume that results from the elements of attack (A) that are mitigated by countermeasure (C). From Equation 8, the higher the ratio, the greater the mitigation level.
4
Countermeasure Evaluation
The process of evaluating and selecting security countermeasures is depicted in Figure 1. The process starts by receiving an alert indicating the presence of a malicious entity in the system (1). A determination is made as whether the system
8
Gustavo Gonzalez Granadillo, Joaquin Garcia-Alfaro, and Herv´e Debar
detected multiple attacks (2). In such a case, the system calculates the impact of multiple simultaneous attacks (2a). For this, the system represents graphically each attack in our 3D coordinate system, and calculates their coverage with respect to the system (using Equation 6). Such coverage is then transformed into the annual loss expectancy as detailed in Section 5.
Fig. 1. Countermeasure Selection Process
In case the system detects only one attack (2b), the system calculates the monetary impact of such attack (i.e., ALE) using a methodology as the one described in Section 2. Then, the system selects the countermeasure candidates to be evaluated (3). In order to perform the countermeasure evaluation, the system requests the input parameters (ALE, AIV, RM, and ARC) to the internal database (4). If parameters such as the ALE or the RM are missing for that particular attack (5), the system will request them to the graphical representation module (5a). Upon reception of all the parameters (5b), the system performs the individual evaluation of all the countermeasures (6).
Geometric Volume Model
9
The resulting RORI indicates the expected return that can be obtained if a given countermeasure is implemented in the system to mitigate the effects of a given attack. A determination is made as whether countermeasures could be combined (7). In such a case, it is necessary to select the desired approach to combine countermeasures (e.g., perform all possible combinations, combine only those countermeasures whose RORI index is above the average or a predefined threshold), and to consider countermeasures that are totally restrictive, mutually exclusive and partially restrictive in order to obtain the list of combinable countermeasures (7a). Then, it is possible to generate groups of 2, 3, ..., n countermeasures, where n is the total number of elements to be combined. In order to calculate the RORI index for combined countermeasures, it is necessary to determine their risk mitigation and annual response cost (8). For that we need to calculate the coverage and effectiveness of each group of countermeasures with respect to the attack. A simulation is then performed using our geometric volume tool, which considers Resources, Channels, and User accounts (hereinafter denoted as RCU) that are protected by each countermeasure. The countermeasure coverage is calculated using Equation 8. Then we can compute the RORI for each group of countermeasures (6), taking into account that the cost of multiple countermeasures is estimated as the sum of all the individual countermeasure costs and the risk mitigation of a combined solution is calculated as the probability of the union of events. More details of these calculations are given in [5]. The Annual Infrastructure Value and the Annual Loss Expectancy remains unchangeable for all combined solutions. When no other possible combination is possible, the system compares the RORI index of all countermeasure candidates and selects the one with the highest value (7b). The higher the RORI index, the better for the organization.
5
Impact Calculation
We propose to develop a conversion factor in order to transform cubic units (hereinafter denoted as units3 ) into monetary values (e.g., $, e). For this purpose, we need to estimate the monetary value of the system (e.g., the dollar value of the whole infrastructure), and to calculate its volume (as proposed in Equation 4). The conversion factor will be, therefore, the resulting value between these two parameters (e.g., $/units3 ). By calculating the volume of attacks and countermeasures on the system, we are able to determine the monetary impact value for single and/or multiple entities. 5.1
Attack Impact
The Annual Loss Expectancy measures the monetary impact of a given attack over a target system. Several methodologies have been developed to compute this metric. The simplest way to compute it is by the product of the single loss expectancy (SLE) and the annual rate of occurrence (ARO) [2].
10
Gustavo Gonzalez Granadillo, Joaquin Garcia-Alfaro, and Herv´e Debar
For single attacks, we compute its volume on the system (in units3 ) and we calculate the corresponding monetary value using the previous conversion factor (CF). The resulting value represents the SLE of such attack on the system, and the ARO (i.e., Likelihood) is estimated as the number of times per year an attack is expected to occur in the system [2]. For instance, let us assume that the volume of attack A1 is calculated as AV(A1 ) = 100,000 units3 , and the conversion factor CF = 0.1 e/unit3 . The single loss expectancy for A1 is therefore, SLE(A1 ) = 10,000.00 e. Considering that A1 has a likelihood estimated as 12 times per year, we calculate the annual loss expectancy as: ALE(A1 ) = 120,000.00 e/year. For multiple attacks occurring simultaneously in the system, we determine the union and/or intersection of the different volumes, and we estimate the total volume of the group of attacks (in units3 ). The resulting volume is then transformed into its corresponding monetary value in order to calculate their single loss expectancy. The ALE is then computed as the product of the SLE and the ARO. This value is further used in the countermeasure evaluation process. 5.2
Countermeasure Impact
Each countermeasure is represented as a geometrical figure that covers a set of resources, channels, and users (RCU) from a given system. Such coverage is calculated using Equation 8. For this, it is necessary to determine the RCU elements that belong to both: the attack and the selected countermeasure. For instance, considering that A1 affects resources R1:R3 (WF=5), channels Ch1:Ch3 (WF=3), and users U1:U3 (WF=2), the attack volume is equivalent to (AV(A1 ) = (3 × 5) × (3 × 3) × (3 × 2) = 810 units3 ); and countermeasure C1 protects resources R2:R5, channels Ch2:Ch5, and users U2:U5, (CV(C1 )= 1,920 units3 ), the RCU elements that are covered by C1 respect to A1 are the following: R2:R3, Ch2:Ch3, U2:U3. The coverage volume of C1 with respect to A1 is therefore equivalent to: CV (C1 ∩ A1 )= [(2 × 5) × (2 × 3) × (2 × 2)]= 240 units3 . The coverage of C1 with respect to A1 is calculated as: Cov(C1 /A1 ) =
240units3 810units3
= 0,2962%
As a result, only 29,62% of the total volume of A1 is covered by C1 . This value helps improving the accuracy in the evaluation and selection of security countermeasures. The remaining 70,38% of the attack is considered as a residual risk.
6
Implementation and Results
We developed a Python software application to generate the graphical representation of multiple attacks and countermeasures within a particular system, and
Geometric Volume Model
11
to evaluate, rank, and select optimal countermeasures against complex attacks. This section describes the tool and the resulting geometrical figures, as well as, the approach to calculate the monetary impact of attacks and countermeasures and the process of countermeasure selection. A software prototype of our approach is available at http://j.mp/3d-rori. It implements all the modules introduced in this section, i.e., input data, RORI and geometrical calculation, and graphical representation. The prototype has been implemented using the Python language. It has been tested using realworld scenarios. 6.1
Tool Description
Our proposed tool is composed of three modules: Input data processor, RORI & Geometrical Calculation, and Graphical Representation, as depicted in Figure 2. For more information about the tool, please see http://j.mp/3d-rori.
Fig. 2. Decision Support Tool
6.1.1 Input Data Processor : This module stores information about the Organization, Policy Enforcement Points (PEPs), Attacks, and Countermeasures. Organization: provides information of a given organization regarding its security infrastructure (e.g., name, description, annual infrastructure value). An organization has one or more Policy Enforcement Point -PEP (RFC2904) , and it is exposed to one or many attacks. PEPs: refer to the list of security equipments i.e., Policy Enforcement Points that are associated to a given organization to protect the confidentiality, integrity and availability of its resources against attacks. Examples of PEPs are: firewall, IDS, Access Control, SIEMs, etc. The tool allows assigning a name, a category and the countermeasures that the PEP can implement on the system, as well as the annual cost of each PEP. The sum of all PEP’s annual costs represents the annual infrastructure value.
12
Gustavo Gonzalez Granadillo, Joaquin Garcia-Alfaro, and Herv´e Debar
Attacks: correspond to any kind of detrimental event (e.g., intrusions, attacks, errors) to which the organization is exposed and that could cause damage to the system’s organization. Each attack is assigned a name, a description, a risk level (e.g., low, medium, high), and one or more countermeasures. In addition, it is possible to assign one or more attacks to a given organization, with a given likelihood and severity, the product of these two parameters represents the annual loss expectancy. Countermeasures: are mitigation actions used to stop or minimize the impact of a given attack. Countermeasures are assigned a name, a description, a percentage of the risk that is mitigated, the annual response cost, and restrictions if they exist. A countermeasure is associated to one or more attacks. 6.1.2 RORI & Geometrical Calculation: This module allows to perform the evaluation, rank and selection of individual and combined countermeasures against a cyber attack in a given organization. it uses the Return On Response Investment (RORI) metric to compare multiple alternatives. It communicates with the geometrical calculation sub-module to obtain more accurate information about input parameters, in particular the financial impact of individual and multiple attacks (i.e. ALE), as well as the impact coverage of single and multiple countermeasures (i.e., Cov(CM)). 6.1.3 Graphical Representation: This module provides a graphical representation of attacks and countermeasures in a three-dimensional coordinate system (i.e., Resource, Channel, and User account - RCU), making it possible to identify the size of each attack and countermeasure in a given system, as well as priority areas (e.g., areas affected by most attacks, or those with insufficient protection). 6.2
Use Case: Olympic Games
For testing purposes, we stored the RCU information of a target system from an Olympic Games scenario. The case study responds to the needs of improving the security of a system whose mission is to provide services and real time information for games of around 20 disciplines that spans more than 60 competition and non-competition venues, involving more than 10,000 athletes, 20,000 members of the media, and 70,000 volunteers. The target system has 100 network resources (e.g, workstations, databases, servers, etc.); 171 channels (e.g., public IP address, credential connections); and 71 user accounts (e.g, IT professionals, partner staff, volunteers). Table 2 summarizes this information. The annual infrastructure value (AIV) has been calculated as 12.800 e/year. This latter corresponds to the annualized cost of operation and maintenance of the security infrastructure. Applying Equation 4, we calculate the volume of system S1 as: SV(S1) = (351)×(513)×205 = 36,912,915 units3 . Considering that
Geometric Volume Model
13
Table 2. RCU Information of the target system
Dimension Resource
Range R1:R16 R17:R17 R18:R19 R20:R22 R23:R25 R26:R35 R36:R100 Channel Ch1:Ch91 Ch92:Ch103 User Account U1:U40 U41:U47 U48:U71
Description Server Access Control Tool Database IDS Firewall Network device Workstation Public IP address Credentials IT professional Partner staff Volunteer
Q WF Range 16 5 0:80 1 4 80:84 2 4 84:92 3 4 92:104 3 4 104:116 10 4 116:156 65 3 156:351 100 3 0:300 3 71 300:513 40 4 0:160 7 3 160:181 24 1 181:205
the complete infrastructure value is estimated as 450,000 euros, the conversion factor (currency/units3 ) is therefore computed as: CF = 450,000/36,912,915 = 0.01219086 e/unit3 . 6.3
Attack Scenario
A first attack (i.e., A1) is detected in the Olympic Games scenario. The general process starts when the attack accesses the URL of an external web application and studies its behavior (the attacked web application could also be internal). Then, he/she rewrites the URL of the web application to bypass any implemented security check (login, cookies, session). As a result, the attacker bypasses security checks and accesses restricted information. Attack A1 affects resources R1:R12 (range 0:60), channels Ch1:Ch12 (range 0:36), and users U1:U71 (range 0:205). The volume of A1 is calculated using Equation 5 as: AV(A1) = (12×5) × (12×3) × [(40 × 4)+ (7 × 3) +(24 × 1)] = 442,800 units3 . A second attack (i.e., A2) is executed simultaneously on the system. A2 is based on modification of data sent between client and web applications in HTTP headers, requests for URLs, form fields, and cookies. This kind of attack allows unauthorized access to restricted information and operations. It affects resources R9:R16 (range 40:80), channels Ch1:Ch16 (range 0:48), and users U1:U71 (range 0:205). The attack volume is calculated as: AV(A2) = (8 × 5) × (8 × 3) × [(40 × 4)+ (7 × 3) +(24 × 1)] = 393,600 units3 . Attacks A1 and A2 are partially joint, each attack has an estimated “Significant” severity Level and a “High” likelihood (one attempt per month, starting four months prior to the Games event). The union of both attacks is treated as a new attack (i.e., A3 = A1 ∪ A2) that affects resources R1:R16 (range 0:80), channels Ch1:Ch16 (range 0:48), and users U1:U71 (range 0:205), and whose
14
Gustavo Gonzalez Granadillo, Joaquin Garcia-Alfaro, and Herv´e Debar
volume is calculated as: AV(A3) = (16 × 5) × (16 × 3) × [(40 × 4)+ (7 × 3) +(24 × 1)] = 787,200 units3 . Applying the previously calculated conversion factor, we obtain the monetary impact loss expected from the combined attack as: SLE(A3) = 787,200 units3 × 0.0121986 e/unit3 = 9,596.65 e. Using the Lockstep methodology [2], we transform the likelihood value into the annual rate of occurrence (i.e., high likelihood = 12), then the ALE for attack A3 is expected to be equivalent to: ALE(A3) = 115,159.69 e/year. This latter is the monetary impact expected on the system in yearly basis, if both attacks are realized. 6.4
Countermeasure Analysis
The following are sample countermeasures associated to attack A3, (i.e., the combination of URL-rewriting attack ‘A1’, and data modification attack ‘A2’). We assume security experts providing the list of countermeasures. – C0. No Operation (NOOP): This solution considers to accept the risk and does not require any modifications. The cost and risk mitigation level are equal to zero. – C2. Activate abnormal behavior rules: this countermeasure requires to update the existing rules (i.e., default security policies) to be more restrictive and/or to activate new rules that disable other less restrictive ones. – C6. Deny or redirect requests: URL requests coming from origins that are generating an unusual amount of requests are denied or redirected. This is similar to blocking requests from the offending IPs. The downside is that false positives may be denied access to the URL resources. – C7. Disable URL-rewriting mode: either at the server side or at the application level. An attractive option is a Servlet filter which wraps the response object with an alternate version and changes the encoded URL and related methods into no-operations. However, disabling also defensive URL rewriting increases the risk of other attacks. – C8. Activate automatic expiring URLs: a URL that expires a short period of time after it is requested (e.g., 10 minutes) would greatly reduce the window of opportunity for an attacker to perform a URL rewriting attack but still allow legitimate users enough time to work with the resource. – C9. Enable HTTPS: when enabling HTTPS security, some systems allow applications to obtain the SSL/TLS session identifier. The use of SSL/TLS session identifier is suitable only for critical applications, such as those on large financial sites, due to the size of the systems. – C13. Generate new SID: even though an attacker may trick a user into accepting a known SID, the SID will be invalid when the attacker attempts to reuse the SID. However, session regeneration is not always possible. Problems (e.g., logouts, session separation, etc.) are known to occur when third-party software such as ActiveX or Java Applets is used, and when browser plug-ins communicate with the server. For this reason, session regeneration is only advised when performing sensitive operations or accessing sensitive links.
Geometric Volume Model
15
Table 3 summarizes the RCU information of each security solution except for C0 (NOOP), since this latter implies no changes in the system. In addition, we provide information about the coverage of each countermeasure based on the detected attack. Such coverage is calculated using geometrical operations from the geometrical calculation module. For instance, having the RCU of attack A3 (0:80, 0:48, 0:205), and the RCU of countermeasure C2 (0:156, 0:105& 300:513, 0:205) we compare both entities and we obtain the RCU intersection (i.e., 0:80, 0:48, 0:205), then we compute the volume (using Equation 7) and we determine the percentage of the attack volume that is covered by the countermeasure volume (using Equation 8). As a result, C2 covers 100% of attack A3.
Table 3. RCU Information of the security countermeasures
CM Resource Range Channel C2 R1:R35 [0,156] Ch1:Ch35& Ch101:Ch171 C6 R1:R17& [0,84]& Ch1:Ch17& R20:R25 [92,116] Ch20:Ch25 C7 R1:R13 [0,80] Ch1:Ch13 C8 R1:R13& [0,80]& Ch1:Ch13& R36:R100 [156,351] Ch36:Ch100 C9 R1:R16 [0,80] Ch1:Ch16 C13 R1:R17 [0,84] Ch1:Ch17
Range User [0,105]& U1:U71 [300,513] [0,51]& U1:U71 [57,75] [0,39] U1:U71 [0,39]& U1:U71 [105,300] [0,48] U1:U71 [0,51] U1:U71
Range Coverage [0,205] 1.00 [0,205]
1.00
[0,205] [0,205]
0.81 0.81
[0,205] [0,205]
1.00 1.00
We determine the annual response cost and effectiveness of each security countermeasure. The risk mitigation value (RM) is calculated as the product of the Effectiveness (EF) and the Coverage (COV). This latter is obtained via the geometrical calculation module. The RORI index is calculated using Equation 1. Table 4 summarizes this information.
Table 4. Countermeasure Evaluation Information
CM C0 C2 C6 C7 C8 C9 C13
EF 0.00 0.68 0.55 0.89 0.79 0.49 0.39
COV 0.00 1.00 1.00 0.81 0.81 1.00 1.00
RM 0.00 0.68 0.55 0.72 0.64 0.49 0.39
ARC 0.00 400.00 500.00 700.00 450.00 550.00 250.00
RORI 0.00 0.590 0.472 0.609 0.552 0.418 0.342
Restriction all C0 C0 C0 C0 C0 C0
16
Gustavo Gonzalez Granadillo, Joaquin Garcia-Alfaro, and Herv´e Debar
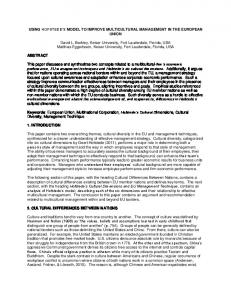
From the list of proposed countermeasures, C7 (Disable URL-rewriting mode) provides the highest RORI index. By taking this action, the risk is expected to be reduced 72%, resulting in a RORI index of 0.609. The graphical representation of each countermeasure vs. the detected attacks is depicted in Figure 3, where the blue parallelepiped represents attack A3 and the green parallelepiped represents the countermeasures. Attack A3 remains the same (in size and affected elements) for all the different cases, whereas countermeasures change their size according to the elements they cover. Therefore, the bigger the countermeasure, the smaller the graphical representation of the attack. That explains why in Figure 3(a) the attack looks smaller than the one represented in Figure 3(c).
(a) A3 and C2
(b) A3 and C6
(c) A3 and C7
(d) A3 and C8
(e) A3 and C9
(f) A3 and C13
Fig. 3. Graphical representation of attack A3 and all individual countermeasures
We evaluated all possible combinations of security countermeasures (considering mutually exclusive, partially restricted and totally restrictive countermeasures) and taking into account that for a combined solution, the cost is computed as the sum of all the individual countermeasure costs (Pessimistic Approach) and the risk mitigation is calculated as the probability of the union of events (using the effectiveness and coverage parameters as detailed in [5]). The Annual Infrastructure Value and the Annual Loss Expectancy remains the same for all combined solutions. Table 5 presents the results of the five best combinations of security countermeasures. From Table 5, the value of EF c corresponds to the minimum effectiveness value of the combined solution, whereas COV c corresponds to the value of the intersection coverage of the combined countermeasures. RM c and ARC c
Geometric Volume Model
17
Table 5. Countermeasure Combination Results
N 1 2 3 4 5
CM c C2+C7 C2+C7+C13 C2+C7+C8 C6+C7 C2+C6+C7
EF c 0.68 0.39 0.68 0.55 0.55
COV c 0.81 0.81 0.71 0.81 0.81
RM c 0.85 0.85 0.86 0.82 0.85
ARC c 1,100.00 1,350.00 1,550.00 1,200.00 1,600.00
RORI c 0.695 0.681 0.679 0.669 0.668
represent the risk mitigation and the annual response cost respectively for each combination. RORI c is the resulting RORI index for the combination. After comparing the RORI index on all the different options, we determined that the best solution is to combine C2 and C7, which proposes to activate abnormal behavior rules and to disable URL-rewriting mode. As a result, the risk is expected to be reduced 85%, and the RORI index is expected to be 0.695. This combined solution becomes the selected countermeasure for a combined attack based on URL-rewriting and data modification in the attack scenario described in Section 6.3.
7
Conclusion and Future Work
In this paper we introduced a 3D geometrical model (i.e., Attack volume), as an improvement of the attack surface model proposed by Howard et al. [6] and Manadhata et al. [10] . The attack volume is fully integrated with a cost sensitive metric (i.e., Return On Response Investment) to evaluate, rank and select security countermeasures against complex attack scenarios. The 3D geometrical model proposes to measure the volume of multiple entities (e.g., system, attack, countermeasures) by using geometrical operations in order to calculate their coverage. Entities are plotted as cubes or parallelepipeds in a three dimensional coordinate system that represents user accounts, channels and resources in each axis. Implementation and main results of our model are presented at the end of the paper, using a real case scenario where two cyber attacks are detected in the Olympic Games Infrastructure. Using the attack volume model, we improve RORI results by providing more accurate values of the the financial impact of multiple attacks and countermeasures. Considering that the number of axis could change, the system should be flexible to model the information into two or more dimensions, resulting in a variety of geometrical figures (e.g., lines, surfaces, hyper-cubes, etc). Future work will therefore concentrate in evaluating such figures through other geometrical operations (e.g., length, area, hyper-volume).
18
Gustavo Gonzalez Granadillo, Joaquin Garcia-Alfaro, and Herv´e Debar
Acknowledgements: The research in this paper has received funding from the Information Technology for European Advancements (ITEA2) within the context of the ADAX Project (Attack Detection and Countermeasure Simulation), and the PANOPTESEC project, as part of the Seventh Framework Programme (FP7) of the European Commission (GA 610416). Authors would like to thank the MAnagement of Security information and events in Service InFrastructures (MASSIF) projet and the use case providers for their contribution of a real case study.
References 1. P. Agarwal, A. Efrat, S. Ganjugunte, D. Hay, S. Sankararaman, and G. Zussman. Network vulnerability to single, multiple and probabilistic physical attacks. In Military Communications Conference, 2010. 2. L. Consulting. A Guide for Government Agencies Calculating ROSI. Technical report, http://lockstep.com.au/library/return on investment, 2004. 3. J. Fan, B. Gierlichs, and F. Vercauteren. To infinity and beyond: Combined attack on ecc using points of low order. In 13th International Conference on Cryptographic Hardware and Embedded Systems, pages 143–159, 2011. 4. D. Fisher. Microsoft releases attack surface analizer tool. In http://threatpost.com/en us/blogs/microsoft-releases-attack-surface-analyzertool-080612, 2012. 5. G. G. Granadillo, M. Belhaouane, H. D´ebar, and G. Jacob. Rori-based countermeasure selection using the orbac formalism. International Journal of Information Security, 13(1):63–79, 2014. 6. M. Howard and J. Wing. Measuring relative attack surfaces. In Computer Security in the 21st Century, pages 109–137, 2005. 7. A. A. E. Kalam, R. E. Baida, P. Balbiani, S. Benferhat, F. Cuppens, Y. Deswarte, A. Miege, C. Saurel, and G. Trouessin. Organization Based Access Control. In 8th International Workshop on Policies for Distributed Systems and Networks, 2003. 8. N. Kheir, N. Cuppens-Boulahia, F. Cuppens, and H. D´ebar. A service dependency model for cost-sensitive intrusion response. In Proceedings of the 15th European Symposium on Research in Computer Security (ESORICS), pages 626–642, 2010. 9. N. Li and M. Tripunitara. Security analysis in role-based access control. ”ACM Transactions on Information and System Security”, 9(4):391–420, November 2006. 10. P. Manadhata and J. Wing. An attack surface metric. In IEEE Transactions on Software Engineering, 2010. 11. S. Northcutt. The attack surface problem. In SANS technology Institute Document, http://www.sans.edu/research/security-laboratory/article/didattack-surface, 2011. 12. F. of American Scientists. Special operations forces intelligence and electronic warfare operations. Appendix D: Target Analysis Process, http://www.fas.org/irp/doddir/army/fm34-36/appd.htm, 1991. 13. S. Petajasoja, H. Kortti, A. Takanen, and J. Tirila. Ims threat and attack surface analysis using common vulnerability scoring system. In 35th IEEE Annual Computer Software and Applications Conference Workshops, 2011. 14. W. Sonnenreich, J. Albanese, and B. Stout. Return On Security Investment (rosi) A Practical Quantitative Model. Journal of Research and Practice in Information Technology, 38(1), 2006.