Journal of Visualized Experiments
www.jove.com
Video Article
Using a Comparative Species Approach to Investigate the Neurobiology of Paternal Responses Catherine L. Franssen1, Massimo Bardi2, Kelly G. Lambert1 1Department 2Department
of Psychology, Randolph-Macon College of Psychology, Marshall University
Correspondence to: Kelly G. Lambert at
[email protected] URL: http://www.jove.com/video/3173/ DOI: 10.3791/3173 Keywords: Neuroscience, Issue 55, Peromyscus, mouse, paternal behavior, vasopressin, immunocytochemistry, microsequencing behavioral analysis, Date Published: 9/19/2011 This is an open-access article distributed under the terms of the Creative Commons Attribution Non-Commercial License, which permits non-commercial use, distribution, and reproduction, provided the original work is properly cited. Citation: Franssen, C.L., Bardi, M., Lambert, K.G. Using a Comparative Species Approach to Investigate the Neurobiology of Paternal Responses. J. Vis. Exp. (55), e3173, DOI : 10.3791/3173 (2011).
Abstract A goal of behavioral neuroscience is to identify underlying neurobiological factors that regulate specific behaviors. Using animal models to accomplish this goal, many methodological strategies require invasive techniques to manipulate the intensity of the behavior of interest (e.g., lesion methods, pharmacological manipulations, microdialysis techniques, genetically-engineered animal models). The utilization of a comparative species approach allows researchers to take advantage of naturally occurring differences in response strategies existing in closely related species. In our lab, we use two species of the Peromyscus genus that differ in paternal responses. The male California deer mouse ( Peromyscus californicus) exhibits the same parental responses as the female whereas its cousin, the common deer mouse (Peromyscus maniculatus) exhibits virtually no nurturing/parental responses in the presence of pups. Of specific interest in this article is an exploration of the neurobiological factors associated with the affiliative social responses exhibited by the paternal California deer mouse. Because the behavioral neuroscience approach is multifaceted, the following key components of the study will be briefly addressed: the identification of appropriate species for this type of research; data collection for behavioral analysis; preparation and sectioning of the brains; basic steps involved in immunocytochemistry for the quantification of vasopressin-immunoreactivity; the use of neuroimaging software to quantify the brain tissue; the use of a microsequencing video analysis to score behavior and, finally, the appropriate statistical analyses to provide the most informed interpretations of the research findings.
Video Link The video component of this article can be found at http://www.jove.com/video/3173/
Protocol
1. Identification of Animal Model 1. The California Deer Mouse (Peromyscus californicus) is an ideal model to explore paternal responses. As you see, this mouse grooms the pups just as the moms do - they even crouch over them so that it looks like the pups are nursing. The behavior of the California mice is compared to a species of the same genus, the common deer mouse (Peromyscus maniculatus) which exhibits little interest in the pups, often trying to escape or even attack them. (See Figure 1 for pictures of these species interacting with pups.) 2. Once the species model has been identified then the various groups need to be established. In this study, biological fathers, virgins with no parenting experience, and virgins with limited pup exposure (pup-exposed or foster fathers) of both species are used so that both predisposed and acquired paternal characteristics can be assessed. In this particular study we also exposed all groups to a toy mouse pup to assure that the social interactions were specific to a pup and not a representative response to anything placed in the cage (See Figure 2.) 3. Before investigating neurobiological factors, it is important to confirm that the selected species exhibit clear differences in the behavior of interest. In this study, males are placed in a cage with a pup for five minutes and a paternal behavior ethogram (see Table 1 for example of ethogram) is used to score behaviors such as latency to approach the pup and amount of time spent in contact with the pup. If aggressive responses are observed, the pup is removed immediately. These sessions are often videotaped so a careful behavioral analysis can be subsequently conducted.
2. Preparing Brain Tissue 1. Following a standard perfusion of each mouse (protocol attached), the brains are removed so that they can be sectioned in the specific area of interest (show brain). 2. A standard mouse brain atlas (show atlas) is used to locate the paraventricular nucleus in the hypothalamus, an area known to be rich in cells producing the neuropeptide of interest in this study - vasopressin (AVP).
Copyright © 2011 Creative Commons Attribution License
September 2011 | 55 | e3173 | Page 1 of 6
Journal of Visualized Experiments
www.jove.com
3. The brain is then blocked and mounted on a freezing chuck so that the tissue will freeze before being sectioned with the microtome. The brain is sectioned in a trim mode until specific landmarks are identified, then the specific brain thickness, 30 microns in this case, is set for the brain sections used for analysis. 4. The brain sections are carefully placed in well plates filled with phosphate buffer saline (PBS); (protocol for PBS attached; please note that this is only one example of a standard immunocytochemistry protocol).
3. Immunocytochemistry 1. Throughout the various steps of this process (see attached protocol), it is important to have accurate pipetting skills to assure accurate measurements of chemicals and other ingredients important for this technique (show student pipetting). 2. The first step in this process is washing the brains which involves replacing the PBS in the well plates three to five times; between each wash the well plates are placed on a rocker for 10 minutes (show student replacing PBS and placing well plates on rockers). 3. The brain slices are then exposed to the primary antibody solution and stored at 4 °C overnight on the rocker (show process). 4. Following another wash, the brain slices are exposed to a secondary antibody for one hour on the rocker at room temperature, then washed again. 5. Next the brains are exposed to an Avitin-Biotin Complex solution to prepare for the visualization of the neurochemical-positive cells. 6. For the final visualization step, the brains are exposed to DAB. This is a hazardous product and should always be handled with caution. As seen here, the brain slices begin to get darker before your eyes (show process). 7. Following the DAB exposure, the brains go through the last series of washes and are then carefully placed on subbed microscope slides and allowed to dry overnight (show the placement of a brain slice on a slide; see attachment for subbed slides protocol). 8. The slides are then cleared through a series of distilled water and alcohol washes, finally being submerged in Citrosolv before being coverslipped and stored in a slidebox for safe keeping (show various aspects of this process; see attachment for clearing process).
4. Neuroquantification 1. After the slides have dried, they can be assessed with specialized neuroquantification software. Here Bioquant software is used to quantify the vasopressin-positive cells and fibers in the paraventricular nucleus of the mouse brains (show software on screen...and microscope). 2. The specific area of interest is identified using the measurement options of the software to establish the visual field for neuroquantification. It is important that a consistent visual field size is quantified for each animal (show student doing this). 3. Here the darkly stained vasopressin-immunoreactive cell bodies and fibers are apparent. Because it is difficult to count or trace this tissue, a special feature of this software uses light thresholding to determine the total amount of positively stained tissue within the specified area of interest. This thresholding tells us how much of the specified area contained vasopressin-positive tissue (show the data value on the computer screen).
5. Behavioral Analysis 1. If more than one observer will be scoring the videotapes, it is important to establish inter-rater reliability to assure that the observers are scoring the behavior in a consistent manner. For the actual scoring session, a behavior scoring sheet should be prepared to allow for easy scoring of behavior during observation sessions (see Table 2 for example of scoring spread sheet). 2. For behaviors that aren't fast episodic responses, a microsequencing analysis can reveal subtleties about the progression of the specific responses. For example, grooming behavior consists of a chain of very fast responses. Although one option is to simply record the presence and duration of grooming, another is to document the chain of events accompanying this response. Using this microsequencing software, observers score the presence of a particular behavior every second, as prompted by the software (show software and video). 3. Following data collection, the parameters of interest are determined and the appropriate behavioral scores are analyzed. Examples may be total duration of time spent in contact with the pup, or number of disruptions in the grooming sequence (show computer with spread sheet with data entered for each animal). 4. Once the behavior is scored it is important to confirm that the two species exhibited different response strategies for the behavior of interest in the study. In this case the California deer mice should exhibit more paternal behavior than the common deer mice. Additionally, various behavioral measures can be correlated with brain measures to get a more informed view of relevant influences.
6. Representative Results: 1. To validate the model, the data should clearly indicate that the two species performed differently with regard to the behavior of interest. Here you see that the P. californicus males spent more time grooming and crouching over the pups, two hallmarks of paternal responses (See Figure 4). 2. In order to determine if the neurobiologial variable of interest is important in paternal responses, the amount of vasopressin (AVP)-positive tissue was quantified for several relevant brain areas; as can be seen, the paternal P. californicus animals had more immune-positive tissue in several of these brain areas. (see Figure 5). 3. In a related study using the microsequencing analysis, it was hypothesized that paternal California mice would exhibit less anxiety than their virgin counterparts; accordingly, when exposed to a predator odor, the fathers exhibited fewer interruptions in the grooming sequence than the virgin animals (see Figure 6).
Copyright © 2011 Creative Commons Attribution License
September 2011 | 55 | e3173 | Page 2 of 6
Journal of Visualized Experiments
www.jove.com
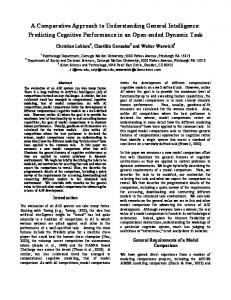
Figure 1: (A) Male California mice exhibiting paternal responses toward conspecific alien pup. (B) Male deer mouse exhibiting a cautious approach (stretch attend) and avoidance response in the presence of a conspecific alien pup. Note: In these social interaction assessments, if a male exhibits aggressive responses toward the pup, the experimenters immediately hit the top of the cage to distract the male. At this time the session is terminated and the pup is removed, inspected for any wounds and returned to the mother. In our laboratory, this rarely is observed with P. californicus males but is occasionally observed with P. maniculatus; close observation and immediate intervention, however, prevent harm from occurring to the animals.
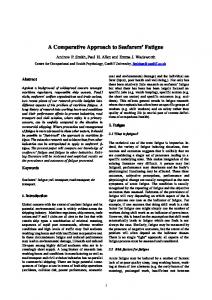
Figure 2: A California mouse interacting with a toy mouse; most tried to chew on these stimuli.
Figure 3: Experimental design of study; there were approximately 6 animals in each group for each species.
Copyright © 2011 Creative Commons Attribution License
September 2011 | 55 | e3173 | Page 3 of 6
Journal of Visualized Experiments
www.jove.com
Figure 4: Graphic of immunocytochemistry process.
Figure 5. Paternal responses in the California and deer mice; more paternal responses (groom, crouch, faster approach) were observed in the California mice. More stretch attends (stress response) were observed in the deer mice.
Copyright © 2011 Creative Commons Attribution License
September 2011 | 55 | e3173 | Page 4 of 6
Journal of Visualized Experiments
www.jove.com
Figure 6. Vasopressin immunoreactivity in various brain areas of both species. The California mice had more staining in the PVN cells and fibers.
Figure 7: Paternal California mice exhibited fewer disruptions in their grooming sequences in the presence of a predator odor than the pup-exposed and virgin groups.
Copyright © 2011 Creative Commons Attribution License
September 2011 | 55 | e3173 | Page 5 of 6
Journal of Visualized Experiments
www.jove.com
Discussion This article discusses three essential components thought to be critical for the successful execution of behavioral neuroscience investigations: (1) a representative and valid animal model; (2) an accurate and sensitive immunocytochemistry protocol; and (3) the most analysis (observational and statistical) of both the behavioral and brain data. Mistakes in a single category will most certainly compromise the results of the entire study. Hence, after carefully selecting the appropriate animal model, considerable effort should be directed toward pilot testing the behavioral and histological procedures to assure that the behavior will be reliably observed in the study, followed by the successful processing of the brains. As mentioned earlier, the use of comparative species to identify neurobiological mechanisms of a particular response is a valuable methodological approach because this technique doesn't require genetic engineering or painful surgical manipulations. Thus, this methodological approach utilizes less threatened, intact animals. The use of natural variations of animals, however, is strengthened by the incorporation of natural-like environments even if the animals are housed in the laboratory. Further, if laboratory studies can be extended to the field to further validate the authenticity of species differences in the behavior of interest, this next step is recommended. Although the comparative approach offers many advantages, a limitation is the correlative nature of the data; consequently, additional techniques such as pharmacological manipulations should be used to further validate the role of targeted neurobiological systems in the behavior of interest. Once the experimenters feel confident about the behavioral, histological and statistical procedures, care should be taken so that the living conditions of the animals remain constant for all groups except, of course, for the experimental manipulation. Changes in variables such as light schedules, noise levels, caretakers, humidity levels and odors in the laboratory could have significant effects on the animals' neurobiological responses. In this article the primary antibody was used for the detection of vasopressin but other primary antibodies can be used for a plethora of different neurochemicals of interest. If the experimenter is working with a new antibody, it is important to conduct titration studies to determine the optimal dilution of the new antibody. Many times too much antibody is used (as suggested by the vendor), resulting in tissue that is too dark to differentiate the signal; further, excessive use of the antibody is very expensive. Finally, if more than a single statistical analysis can be used to provide alternate views and interpretations of the data, they should be utilized. In this particular study, general linear models, correlational, and multidimensional scaling analyses were used to provide the most informative views of the data.
Disclosures No conflicts of interest declared.
Acknowledgements This research was funded by grant no. 0723341 (to KGL) from the National Science Foundation. We are also grateful for contributions provided by the Schapiro Undergraduate Research Fellowship program and the Psychology Department at Randolph–Macon College. Finally, we appreciate Craig Kinsley’s collaborative contributions in this research and Amanda Rzucidlo’s help in preparing the R-MC laboratory for this video article.
References 1. Gubernick, D.J. & Teferi, T. Adaptive significance of male parental care in a monogamous mammal. Proc. Biol. Sci. 267, 147-150 (2000). 2. Hartung, T.G. & Dewsbury, D.A. Paternal behavior in six species of muroid rodents. Behavioral and Neural Biology. 26, 466-478 (1979). 3. Ribble, D.O. The monogamous mating system of Peromyscus californicus as revealed by DNA fingerprinting. Behav. Ecol. Sociobiol. 29, 161-166 (1991). 4. De Jong, T.R., Chauke, M., Harris, B.N., & Saltzman, W. From here to paternity: Neural correlates of the onset of paternal behavior in California mice (Peromyscus californicus). Horm. Behav. 56, 220-231 (2009). 5. Ferguson, J.N., Young, L.J., & Insel, T.R. The neuroendocrine basis of social recognition. Front. Neuroendocrinol. 23, 200-224 (2002). 6. Kinsley, C.H. & Lambert, K.G. Reproduction-induced neuroplasticity: Natural behavioural and neuronal alterations associated with the production and care of offspring. J. Neuroendocrinol. 20, 515-525 (2005). 7. Lambert, K.G., Franssen, C.L., Bardi, M., Hampton, J.E., Hainley, L., Karsner, S., Tu, E.B., Hyer, M.M.,Crockett, A., Baranova, A., Ferguson, T., Ferguson, T., & Kinsely, C.H. Characteristic neurobiological patterns differentiate paternal responsiveness in two Peromyscus species. Brain, Behav & Evolution. 77, 159-175, DOI: 10.1159/000326054 (2011). 8. Lee, A.W. & Brown, R.E. Comparison of medial preoptic, amygdala, and nucleus accumbens lesions on parental behavior in Californica mice (Peromuscus californicus). Physiol. Behav. 92, 617-628 (2007). 9. Numan, M. & Insel, T.R. The Neurobiology of Parental Behavior. Springer-Vergag, New York, (2003). 10. Wang, S., Ferris, C.F., & De Vries, G. Role of septal vasopressin innervations in paternal behavior in prairie voles (Microtus ochrogaster). Proc Natl Acad Sci. 91, 400-404 (1994). 11. Franklin, K.B.J., & Paxinos, G. The Mouse Brain in Stereotaxic Coordinates. New York, Academic Press, (1996). 12. Hoffman, G.E., Le, W.W., & Sita, L.V. The importance of titrating antibodies for immunocytochemical methods. Curr protoc Neursci. 45, 2.12.1-2.12.26 (2008). 13. Kemmler, G., Holzner, B., Kopp, M., Dunser, M., Greil, R., Hahn, E., & Sperner-Unterweger, B. Multidimensional scaling as a tool for analyzing quality of life data. Quality of Life Research. 11, 223-233 (2002). 14. Parker, K.J. & Lee, T.M. Central vasopressin administration regulates the onset of facultative paternal behavior in Microstus pennsylvanicus (meadow voles). Horm. Behav. 39, 285-294 (2001). 15. Schiffman, S., Reynolds, L.M., & Young, F.Y. Introduction to multidimensional scaling: Theory, methods and applications. New York, Academic Press, (1981).
Copyright © 2011 Creative Commons Attribution License
September 2011 | 55 | e3173 | Page 6 of 6